USD/JPY(20250910)Today's AnalysisMarket News:
U.S. employment data was significantly revised downward, with the number of jobs for the 12 months ending in March revised down by 911,000.
Technical Analysis:
Today's Buy/Sell Levels:
147.08
Support and Resistance Levels:
148.32
147.85
147.55
146.60
146.30
145.84
Trading Strategy:
On a breakout above 147.55, consider a buy entry, with the first target at 147.85.
On a breakout below 147.08, consider a sell entry, with the first target at 146.60
Technical-analysis

USD/JPY(202509008Today's AnalysisMarket News:
Non-farm payroll growth fell significantly short of expectations, with June's data revised downward to negative territory, marking the first contraction since 2020. The unemployment rate hit a nearly four-year high.
Technical Analysis:
Today's buy/sell levels:
147.57
Support and resistance levels:
149.28
148.64
148.23
146.92
146.51
145.87
Trading Strategy:
On a breakout above 148.23, consider a buy entry, with the first target price being 148.64.
On a breakout below 147.57, consider a sell entry, with the first target price being 146.92

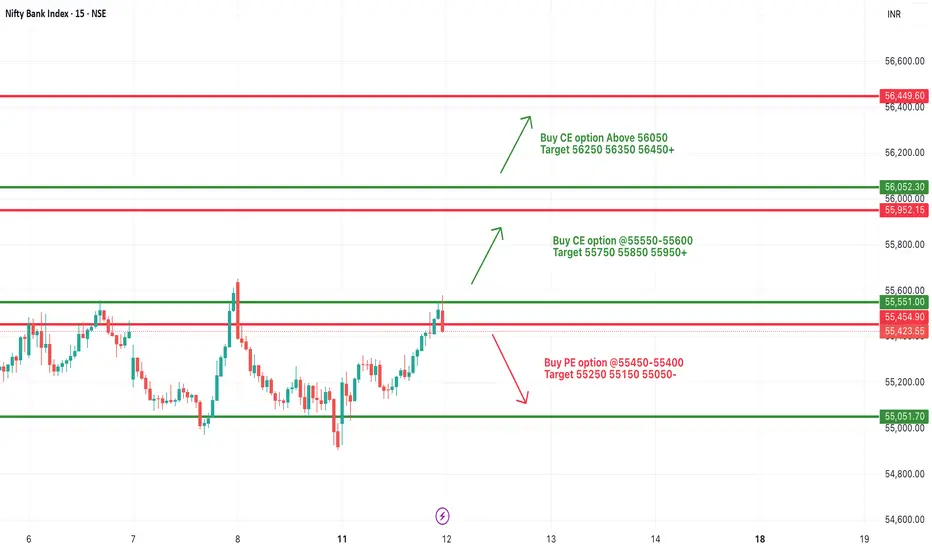
[INTRADAY] #BANKNIFTY PE & CE Levels(12/08/2025)Bank Nifty is likely to open with a gap-up, indicating strong bullish sentiment at the start. If the index sustains above 55,550–55,600, buying momentum may push it toward 55,750, 55,850, and 55,950+. Further strength can be expected if it breaks above 56,050, opening the path for 56,250, 56,350, and 56,450+.
On the downside, weakness could emerge if Bank Nifty falls below 55,450–55,400, which may lead to a decline toward 55,250, 55,150, and 55,050-. Price action around the 55,550 zone will be crucial in deciding intraday direction, so traders should wait for confirmation before entering trades and maintain strict stop-losses.
BUY IDEA EURAUD Looking to buy EURAUD after pull back expecting bulls to continue pushing the market higher.

XAU/USD 1H – Bullish Continuation from Demand Zone?📊 XAU/USD (Gold) 1H Analysis – Bullish Continuation Setup
🔹 Market Structure: Gold has been in a strong uptrend, with price currently consolidating near a key demand zone.
🔹 Key Levels:
🔴 Resistance: $3,050 - $3,060 (Potential target)
🟣 Demand Zone: $3,030 - $3,035 (Support area)
🟠 Deeper Support: $3,025 (Break below weakens bullish bias)
📈 Potential Trade Setup:
1️⃣ A possible pullback into the demand zone could attract buyers.
2️⃣ Price may wick below liquidity before reversing.
3️⃣ If support holds, we anticipate a move toward $3,050+.
✅ Entry Zone: $3,030 - $3,035
🎯 Target: $3,050 - $3,060
🚨 Stop Loss: Below $3,025
⚠️ Watch for price action confirmation before entering. A strong bullish candle from support could signal entry. Let the market show its hand! 🚀✨

Bitcoin (BTCUSD) Rejection – Bearish Move Incoming?📉 Key Observations:
Resistance Zone (Purple Box): Price has tested this area and faced rejection.
Bearish Projection (Gray Box & Arrow): The chart anticipates a drop towards the $76,800 - $77,000 range.
Liquidity Grab? Price might consolidate before a sharp decline.
⚠️ Possible Scenarios:
Rejection Confirmation 🔻: If BTC fails to reclaim $84,470, selling pressure could increase.
Breakout Fakeout? 🤔: A deviation above resistance followed by a dump remains a risk.
🎯 Levels to Watch:
Resistance: $84,470 - $85,078
Support: $80,000 and $76,825
🔥 Final Take: If BTC struggles below resistance, a short setup could play out. Confirmation is key!

BTC/USD Breakdown! Bearish Target: $78K🔍 BTC/USD 30-Minute Chart Analysis
📉 Market Structure:
The chart displays an ABCDE corrective pattern, likely a descending wedge or contracting triangle, which has now broken to the downside.
Price action shows a breakout below the wedge, leading to further bearish momentum.
The 200-period moving average (red line) is acting as resistance, reinforcing the downward trend.
📊 Current Price: ~$83,057
🔻 Bearish Target: $78,049 (marked as the potential support level)
🛑 Key Observations:
Rejection from wave E indicates a lack of bullish strength.
Lower highs and lower lows confirm a continuation of the bearish trend.
Potential retest of ~$85,000 before dropping further.
🚀 Trading Insights:
Bearish Bias: Short opportunities on pullbacks toward resistance.
Bullish Reversal? Look for price action near $78,049—if buyers step in, a potential bounce could occur.
⚠️ Watch out for:
Sudden Bitcoin volatility (news-driven moves).
A fake breakdown (if buyers reclaim above ~$85,000).

XAU/USD 4H Analysis: Bullish Momentum Towards $2,780📊 XAU/USD 4H Chart Analysis – Bullish Momentum 🚀💰
📌 Key Observations:
🔹 Current Price: $2,754.16 (+0.19%)
🔹 Support Zone: $2,740 - $2,750 (Previous resistance turned support ✅)
🔹 Resistance Zone: $2,780 (Next potential target 🎯)
🔹 200 EMA: $2,687.43 (Price is above = Bullish signal 📈)
🔹 Breakout Confirmation: Price has broken past a key level and might retest before moving higher 🔄📊
📉 Potential Scenarios:
✅ Bullish Case: If price holds above $2,750, we could see a rally towards $2,780+ 🚀
❌ Bearish Case: If price drops below $2,740, we might see a correction back to $2,720 ⚠️
🔥 Conclusion:
Gold is showing strong bullish momentum and may continue its uptrend towards $2,780+ if it sustains above the breakout level! Keep an eye on support at $2,750 for confirmation. 👀💎
Tell me in Comments Would you like further indicators or a different timeframe analysis? ⏳📊

IREDA Analysis!NSE:IREDA Analysis on a Daily Timeframe!
Triangle Pattern Formation in IREDA!
Triangle Pattern Breakout in IREDA!
Analysis:
As we can see the stock in moving in a triangle since December 2023. It was continuously consolidating in it. On 27th June it tried breaking out the resistance but unable to sustain above the resistance. Today again it has been successfully given the breakout and able to close above the breakout. As i marked all the important levels on the chart please have a look.
Trade Setup:
Entry = Current price level is good to Enter
Key Level = 214.80 This is the All Time High Level, Price may reverse from this level but if it breaks, will the major uptrend
Target = 455.85
Stop Loss = Below 173 or as per your Risk To Reward
Disclaimer = Consider my analysis for Educational Purpose only.
Before entering into any trade -
1) Educate Yourself
2) Do your research and analysis
3) Define your Risk to Reward ratio
4) Don't trade with full capital

CHF Loses Ground After The SNB Rate CutToday, the Swiss National Bank cut its interest rate, dropping from +1.75% to +1.50%. Last time we saw any changes made in the rate were back in June 2023, when the Bank lifted the rate from +1.75% to +1.50%. After the release of the news CHF devalued against all of its major counterparts, even against the currently-weak USD.
Looking at the technical picture of EASYMARKETS:USDCHF on our daily chart, we can see that the pair popped higher today after the SNB release. The rate rose above a key resistance barrier, at 0.8886, which is the highest point of February. As long as EASYMARKETS:USDCHF continues to trade above that barrier, we will stay positive, at least with the near-term outlook.
Given that the pair had already reached and overshot one of our key resistance areas, at 0.8954, we will continue aiming higher. That's when we will target the 0.9052 obstacle, or even the 0.9113 level, marked by the highest point of November 2023.
In order to shift our attention to some lower areas, a break of a short-term tentative upside support line taken from the lowest point of December 2023, is needed. This way a directional change of the current uptrend may occur, possibly inviting more sellers into the game. EASYMARKETS:USDCHF could then fall to the current lowest point of March, at 0.8730, a break of which may set the stage for a move to the 0.86500 area. That area is marked near the inside swing highs of January 29th and February 1st.

Triveni Engineering - Short Term BuyThis stock has formed Cup and Handle pattern on weekly charts, and possibly look to show upward break out soon. An entry at ₹ 358 with a Target of ₹ 400 - ₹ 420 - ₹ 440 could be achieved. A strict Stop loss of ₹ 320 shall be places

GSFC Analysis(Descending Triangle)!GSFC Analysis on Weekly Timeframe
Descending Triangle Pattern Formation in GSFC on Weekly Timeframe!
Descending Triangle Pattern Breakout on Upper Side!
Bullish view on GSFC!
GSFC has made Descending Triangle Pattern on Weekly Timeframe. GSFC has given a huge breakout on the upper resistance trendline. We should wait for retest because we don't want to buy it at higher price so we are waiting for a decent retesting. We can see a huge breakout volume so we need to wait for the volume adjustment for avoiding the breakout trap.
Trade Psychology and setup =
Entry = After Retesting between 147.10 - 153.30
Target = Target will be 241.40
Stop Loss = Below 122.35
Disclaimer = All my analysis are for Educational Purpose only. Before entering into any trade - 1) Educate Yourself 2) Do your own research and analysis 3) Define your Risk to Reward ratio 4)Don't trade with full capital

Fake BreakoutBajaj finance were forming Ascending Triangle and Gave a Breakout once but didn't sustain our the resistance level and breakout turn into fake breakout and now again price trending in a range...
Get full analysed video on our youtub chnnel very soon @influitive capital

Infosys WeakInfosys Weak until it doesn't break the trendline mentioned in the chart...
What do you say?

Gati Ltd - A Morning Star pattern perfectly formed on support.Swing - 113 to 177
Shallow Pullback - 38.20% retracement level
Chart Pattern - Morning Star
The price takes support from the level of 150 which is a 38.20% Fibonacci retracement level. This level is considered as a shallow pullback. And the price formed a morning star pattern on this support level. This type of structure indicates the start of an uptrend.
1st Resistance - 160
2nd Resistance - 177
These levels can be considered as targets.
Hit the like button!! Show some energy!!
Thanks
Er. Simranjit Singh Virdi

WELSPUN INDIA LOOKS GREAT ON CHART.Welspun India has been forming a rectangle pattern for a year. It broke out recently, went up, and then retraced to its old resistance. This is a good chance for me because that resistance could now become support. The company's earnings and sales have been impressive, making it a promising option for a swing trade.
We can target a 12% gain from the current level while setting a 10% stop loss. This setup offers a balanced risk-reward ratio of approximately 1:1 for the trade.
Note- Do your own analysis, I am not SEBI registered.

Remarkable Breakout in MPS LTD.Good morning Guys! Here is a potential trade set up for next week.
Providing you some pointers for MPS LTD.
>>MPS Ltd experienced a beautiful breakout from a well-defined rectangle pattern last week
>> As we see in a daily timeframe, it was religiously following a rectangular pattern since more than 1 year, it is more like a broadening rectangular pattern.
>> After witnessing breakout it has retraced back to its breakout zone and again bounced back as bulls got activated, it seems lot of juice has still left.
Sales and profits are also looking promising.
Now question comes, How to trade in this zone as it has already shown significant moves ?
So, Checks these pointers out to understand it.
>>Either we can take entry while it retraces back to its BZ level or it gives a good upward move after little accumulation.
>>IF it comes back all the way to 1460 that would be our trigger point.
>>Now in second scenario if it does not give a pull back then we will wait for little consolidation and if we find a sort of engulfing type green candle then also we can think of taking entry.
STOP-LOSS.
Now stop loss would be deferent in both the scenarios.
First scenario: Buying at Breakout Zone- we can go with 5% of stop loss.
Second scenario: Buying higher level- In this case we will have to with higher stop loss, that would be 12%.
Targets totally depend on your patience level.
If you find this analysis helpful, please consider boosting 🚀 it. If you have some suggestions and any question please post in comment section.
Please note- I am not SEBI registered, so do your research before investing.

NOW NO TRADE FOR UPSIDENow Banknifty near Resistance level. Here is no trade for upside move. Banknifty may move downside here and after that it may come upside

FDCOne can also enter one head and shoulder pattern is active
Chart is self explanatory. Levels of breakdown, possible down-moves (where stock may find support) and resistances (close above which, setup will be invalidated) are clearly defined.
Disclaimer: This is for demonstration and educational purpose only. This is not buying or selling recommendations. I am not SEBI registered. Please consult your financial advisor before taking any trade.

XRPUSDT ANALYSIS SORRY FOR THE PREVIOUS ERROR
I strongly feel that its time to go on short
Because after pattern breakout here we get a proper retest and i am thinking to go short on it..
Plz be free to give your opinion ..
Thankyou

Alkem Pharma Buy for a target of 3327Sentiment: Bullish
From these levels the stock can show the targets of 3327
Analysis:
1. Bollinger Bands are squeezed and the breakout of the upper band.
2. Rsi is above 60.
3. Macd is bullish crossover.

BTC: UNDER BEAR CONTROLWith 1 hr time frame in candle stick, it shows downward trends. Erasing previous bull run, #BTCUSDT may reach 20k in upcoming days.

NIFTY 15 Min Time Frame Analysis FAKE BreakdownNIFTY 15 Min Time Frame Analysis FAKE Breakdown for educational purpose only
