Gold Rewards Timing, Not Activity🟡 Gold Rewards Timing, Not Activity ⏳✨
Gold is not a market that rewards constant action.
It rewards waiting, observation, and precise timing.
Many traders believe that trading more means earning more. In Gold, this mindset often leads to overtrading, emotional decisions, and unnecessary losses.
⏱️ 1. Gold Moves in Phases, Not Constant Trends
Gold spends a large amount of time in:
consolidation 🔄
slow accumulation 🧩
controlled ranges 📦
During these phases, price appears “boring,” but the market is actually preparing.
Trading aggressively in these conditions usually means trading noise, not opportunity.
🧠 2. Activity Feeds Emotions, Timing Controls Risk
High activity leads to:
impatience 😤
forced entries 🎯
emotional exits ❌
Good timing, on the other hand, comes from:
understanding context 🧭
waiting for price to show intent 📊
acting only when conditions align ✅
Gold punishes impatience faster than most markets.
🏦 3. Institutions Trade Less, But Trade Better
Large players do not chase every candle.
They wait for:
liquidity to build 💧
weak hands to exit 🧹
price to reach meaningful zones 📍
When timing is right, Gold often moves fast and decisively — leaving overactive traders behind.
⚡ 4. Big Gold Moves Come After Quiet Periods
Some of the strongest Gold expansions begin after:
low volatility 😴
reduced participation 📉
trader boredom 💤
This is why patience is not passive — it is strategic.
🧩 Key Insight
In Gold, doing less at the right time often outperforms doing more at the wrong time.
🎯 Final Takeaway
❌ More trades ≠ more profits
✅ Better timing = cleaner execution
🟡 Gold rewards discipline, context, and patience
Master timing, and activity will take care of itself.
Technical Analysis

The Calm Stocks Swing Strategy - Big Moves Start in Silence!Hello Traders!
Most people believe swing trades work only when stocks are moving fast.
Strong candles, news headlines, social media hype and suddenly everyone feels confident.
But after spending years studying stock charts, I have learned something very different.
The best swing trades in stocks usually begin when nothing looks exciting.
When a stock becomes quiet, volume dries up and nobody is talking about it
that is often when serious preparation starts.
Retail bolega “ye stock toh bilkul boring hai” and moves on 😄
What a Calm Stock Phase Really Means
A calm phase appears when a stock starts moving in a tight range with smaller candles and limited volatility.
Price keeps respecting the same support and resistance levels again and again.
Volume slowly reduces but price structure remains stable which shows balance not weakness
For swing traders, this boredom is not a problem. It is actually a signal to start paying attention.
Why Smart Money Loves Silence
Big players cannot build positions when price is moving fast because it attracts attention.
They prefer calm stocks where accumulation can happen slowly without pushing price.
Low volatility allows them to prepare before the real move begins.
Silence does not mean nothing is happening. It often means something is being built quietly.
Why Retail Traders Miss These Moves
Most retail traders want action and fast movement.
Calm stocks feel uninteresting so they get ignored.
When the breakout finally happens, retail notices it late and enters emotionally.
Retail chases movement. Swing traders prepare before movement.
How I Personally Trade Calm Stock Swing Setups
I scan daily and weekly charts to find stocks moving in tight consolidation ranges.
I check whether price is repeatedly reacting from the same support and resistance zones.
I focus on stocks where volume is reducing but structure is still clean.
Instead of chasing breakouts, I plan entries near the range with limited risk.
This keeps my mind calm and decisions logical. No pressure and no hurry.
Real Chart Example: Hero MotoCorp
To make this concept practical, I have explained it using the Hero MotoCorp daily chart above.
If you look closely, the stock spent a long time moving inside a tight consolidation zone.
Price reacted multiple times near resistance and support while volume kept reducing.
During this phase, many traders ignored the stock because it looked slow and boring.
But this calm structure was actually preparation.
Once the stock finally broke out, it delivered a clean swing move with strong follow through and very limited pullbacks.
This is exactly how calm stocks reward patience.
Main yahi karta hoon, I study the silence first and let the move come to me.
The Breakout Is the Result Not the Start
Most traders believe the breakout candle is the opportunity.
In reality, the real edge comes from preparation during consolidation.
When volatility expands, the swing trader is already positioned.
Jab sab excited😄hote hain tab smart planning already ho chuki hoti hai.
Rahul’s Tip
If a stock feels too quiet, too slow or too boring, do not ignore it immediately.
Sometimes silence is the market’s way of preparing something big.
Patience during calm phases has helped me far more than chasing excitement.
Conclusion
The Calm Stocks Swing Strategy teaches you to think opposite to the crowd.
Instead of chasing noise, you learn to prepare during silence.
In stocks, the loudest moves often begin when nobody is paying attention.
If this post helped you see calm stocks differently,
like it, share your view in the comments and follow for more practical swing trading insights.

Bharat Dynamics Ltd – Symmetrical Triangle Breakout on Watch (D)Bharat Dynamics is currently trading near a key breakout point of a symmetrical triangle pattern on the daily chart. After a prolonged downtrend, the stock has entered a consolidation phase, forming higher lows and compressing price action — a setup that often leads to a strong directional move.
Bharat Dynamics Q2 Results
✅ Net Profit: ₹216 Cr vs ₹123 Cr (YoY) — 🔼 up 75.5%
✅ Revenue: ₹1,147 Cr vs ₹545 Cr (YoY) — 🚀 strong growth
✅ EBITDA: ₹188 Cr vs ₹98.8 Cr (YoY) — 🔼 up 89.4%
✅ EBITDA Margin: 16.4% vs 18.1% (YoY) — 🔽 slight dip
The price has reclaimed the ₹1,500–₹1,530 zone, and a sustained close above ₹1,550 could confirm a breakout, opening the path for a quick momentum rally toward ₹1,650 and beyond.
🎯 Key Levels:
CMP: ₹1,525.70 (−0.95%)
Breakout Zone: ₹1,550 – ₹1,560
Target 1: ₹1,650 – ₹1,670
Target 2: ₹1,710 – ₹1,740
Resistance: ₹1,950 – ₹2,000
Stop-Loss: ₹1,470 (on daily close basis)
📊 Technical View:
Symmetrical triangle pattern forming after a prolonged correction.
Price compression with reduced volume indicates breakout buildup.
Breakout confirmation expected above ₹1,560 with increasing volume.
If sustained, the move could extend toward the higher resistance zone around ₹1,950+.
🧠 View:
Bharat Dynamics is at a decisive point — a breakout above ₹1,550–₹1,560 with volume can mark the start of a short-term uptrend. Keep an eye on price action near this level for confirmation.

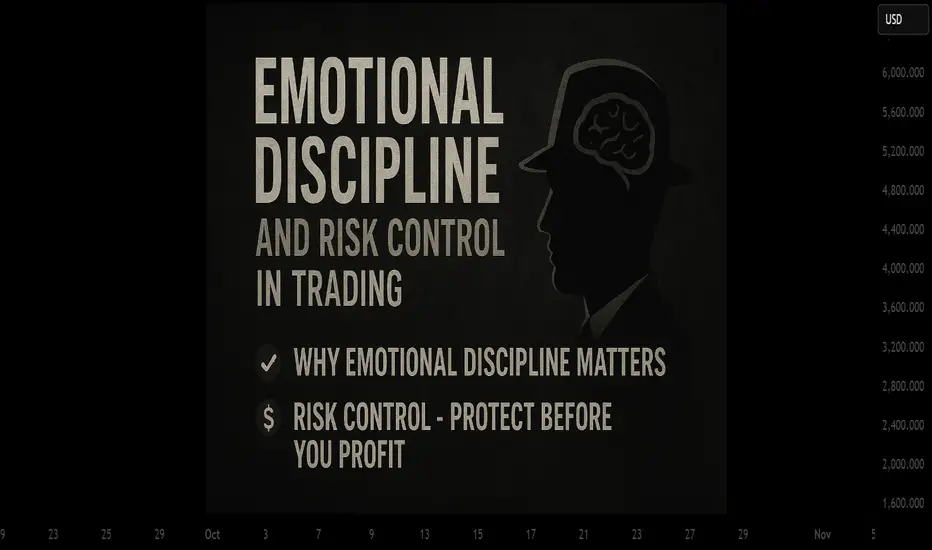
Emotional Discipline and Risk Control in Trading🧠 1. Why Emotional Discipline Matters
Emotional discipline means sticking to your plan regardless of fear or greed.
Markets are designed to test your patience, confidence, and decision-making. Every losing trade tempts you to change your system — but consistency wins.
✅ Key habits of emotionally disciplined traders:
They accept losses without revenge trading.
They follow rules, not impulses.
They manage expectations — no trade will make them rich overnight.
💰 2. Risk Control — Protect Before You Profit
Your risk management defines your survival. Successful traders think in probabilities, not certainties. They never risk too much on one idea.
📏 Golden Rules of Risk Control:
Risk 1–2% of your capital per trade.
Always use a stop-loss, never a “mental” one.
Define your R:R ratio (minimum 1:2 or better).
Never add to a losing position — only to confirmed winners.
Risk control is not about avoiding losses — it’s about limiting damage and staying consistent over time.
🧩 3. How to Strengthen Emotional Discipline
Like a muscle, discipline grows with routine. Try this daily:
Pre-trade routine – review your plan before every session.
Post-trade journal – log your emotions, not just results.
Take breaks – emotional fatigue leads to poor judgment.
Detach from outcomes – focus on process, not profit.
💡 Tip: When you reduce emotional pressure, your clarity and accuracy both improve.
⚙️ 4. Professional Mindset Shift
Amateurs chase profit; professionals protect capital.
Each trade is just one data point — not a reflection of your worth. Once you start thinking like a risk manager first, your results change naturally.
🗣️ “Discipline is choosing what you want most over what you want now.”
📊 Conclusion
To grow as a trader, focus on controlling yourself before controlling the market.
Emotional stability + strict risk control = long-term success.
Be the trader who executes with logic, not emotion. 🧘♂️
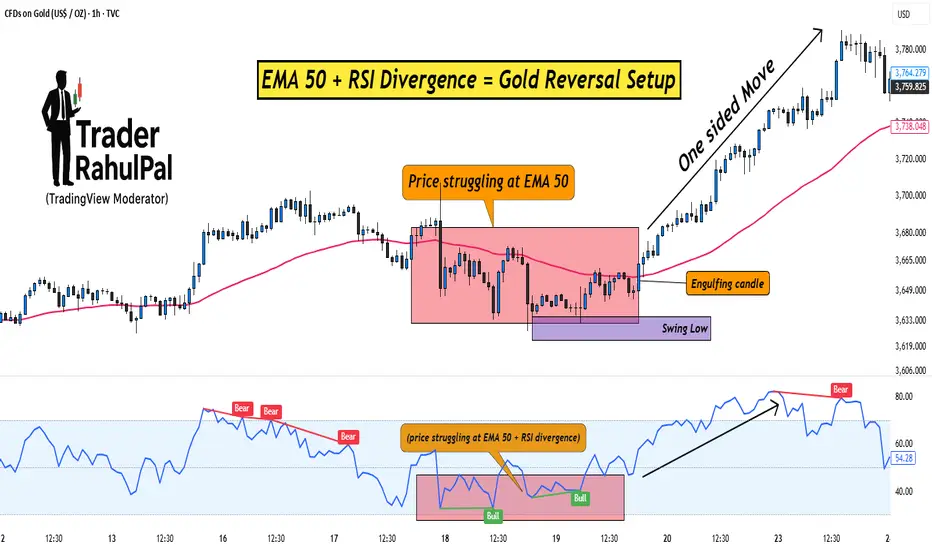
EMA 50 + RSI Divergence = Gold Reversal Setup!Hello Traders!
Gold often makes sharp one-sided moves, trapping traders who enter too late. But if you know how to combine a simple moving average with a momentum indicator, you can spot high-probability reversal setups.
One such method is using the EMA 50 together with RSI Divergence . Let’s break down how it works.
1. Why EMA 50?
The 50-period EMA acts as a dynamic trend filter.
When gold trades above it, the short-term trend is bullish; below it, bearish.
Price often retests the EMA 50 during pullbacks, making it a key level to watch for reversals.
2. What is RSI Divergence?
Divergence happens when price makes a new high/low, but RSI doesn’t confirm it.
Example: Price makes a higher high, but RSI makes a lower high → bearish divergence.
This signals that momentum is weakening, even if price is still moving strongly.
3. Combining EMA 50 with RSI Divergence
First, check where price is relative to EMA 50.
Next, look for divergence on RSI near that zone.
If both align (price struggling at EMA 50 + RSI divergence), chances of a reversal increase sharply.
4. Entry & Risk Management
Wait for a confirmation candle near EMA 50 (like engulfing or pin bar).
Place stop loss just above recent swing high/low.
Target the next support/resistance zone for exits.
Rahul’s Tip:
Don’t use divergence alone, combine it with EMA 50 for structure and you’ll filter out most false signals. This setup works best on higher timeframes like 1H or 4H for gold.
Conclusion:
EMA 50 gives you the trend filter, and RSI divergence reveals momentum weakness.
Together, they form a reliable reversal setup that helps you enter gold trades at the right time instead of chasing moves.
This Educational Idea By @TraderRahulPal (TradingView Moderator) | More analysis & educational content on my profile
If this post gave you a new setup idea, like it, share your thoughts in comments, and follow for more practical trading strategies!
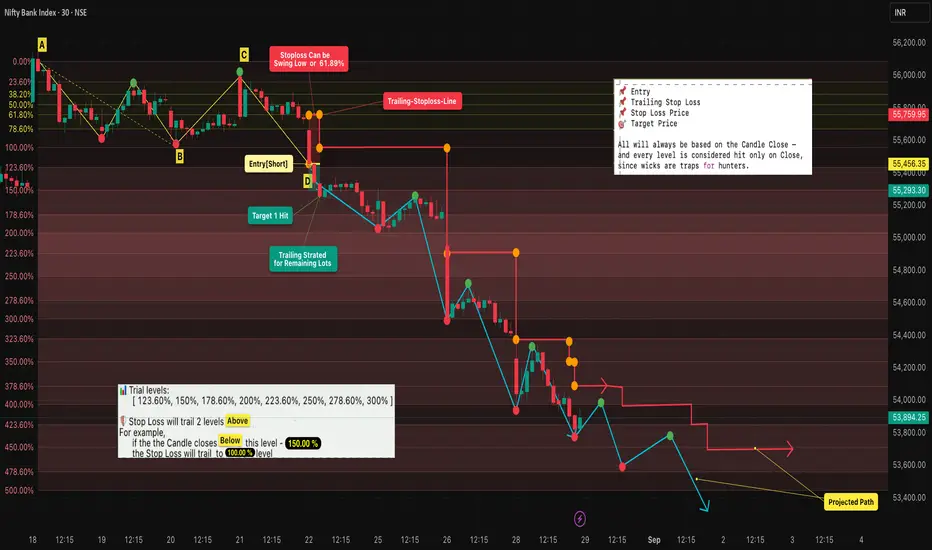
Fibonacci Trailing : Lock Profits & Ride Trends [BANKNIFTY]🔹 Intro / Overview
Managing trades after entry is just as critical as spotting the entry itself.
In this idea, we apply Fibonacci retracements with a trailing stop system to capture profits while staying disciplined.
A well-structured trailing plan helps traders:
✅ Lock in gains early
🛡️ Protect capital against reversals
📊 Stay rule-based instead of emotional
📈 In this case study, BANKNIFTY aligned well with Fibonacci retracement levels , showcasing how these concepts can work in practice as an educational example.
---
📖 Concept
- A swing High (A) to Low (B) defines our Fibonacci retracement zones.
- Retracements (C) test Fibonacci levels but don’t confirm entry until structure is validated.
- Entry (D) occurs only after a successive close confirms the short trade.
- Stop Loss (SL) is placed at the 61.8% retracement (closer and more protective than the far swing).
- Trailing: SL trails forward only , two Fib levels behind price. It manages the remaining position after booking partial profits.
---
📊 Chart Explanation (Step-by-Step)
1️⃣ Swing Definition
📍 A = Swing High
📍 B = Swing Low
2️⃣ Retracement Testing
- C → first retracement (no confirmation) - Here there's a retracement but due to the candle closes below the 38.20% level so devalidation doesn't occured.
3️⃣ Entry Point
✅ At D, successive closes confirm → short entry taken
4️⃣ Stop Loss (SL)
📉 Set at 61.8% retracement for tighter risk management
5️⃣ Targets & Trailing
🎯 Target 1 hit → exit one lot, secure partial profits
🔄 Remaining lots managed with trailing system:
• SL adjusted only forward , never backward
• SL trails as price moves down:
• 150% → SL to 100%
• 178.6% → SL to 123.6%
• 200% → SL to 150%, etc.
6️⃣ Projected Path
🔍 Blue/red paths illustrate how price could move while trailing locks in gains
---
🔍 Observations
📌 Entry validated on structure → reduces false signals
🎯 Booking partial profits builds confidence and ensures realized gains
🔄 Trailing maximizes potential while staying safe
📊 Fib-based progression keeps decisions mechanical, not emotional
---
✨ Why It Matters
✔ Turns static Fibonacci into a dynamic strategy
✔ Prevents giving back profits when trends reverse
✔ Adds confidence and discipline in trade management
✔ Teaches how to scale out smartly
---
✅ Conclusion
Fibonacci retracement alone gives levels — but combining it with a trailing stop system transforms it into a complete trade plan.
By booking partial profits and trailing the rest:
🛡️ You protect capital
🚀 You ride trends longer
🤝 You trade with discipline instead of emotion
---
⚠️ Disclaimer
For educational purposes only · Not SEBI registered · Not a buy/sell recommendation · No investment advice — purely a learning resource
Effective and Widely Used Trading StrategiesTrend Following Strategy
Definition: Trading according to the market trend, buying when the trend is up and selling when the trend is down.
How to Implement: Use technical analysis tools like Moving Averages (MA), RSI, and MACD to identify the market trend. One simple strategy is to trade long when the price is above the moving average (MA), and trade short when the price is below the MA.
Why it Works: The Forex market often has strong trends, which increases the chances of success.
Reversal Trading Strategy
Definition: Finding trading opportunities when the price shows signs of reversing after a strong trend.
How to Implement: Use indicators like RSI, Stochastic Oscillator, or reversal candlestick patterns (such as Doji, Engulfing) to identify reversal points. When the indicators show overbought or oversold conditions, you can place a sell order (if overbought) or a buy order (if oversold).
Why it Works: The market can reverse sharply after a long trend, offering high-profit opportunities when entering at the right reversal point.
News Trading Strategy
Definition: Trading based on major news events, such as interest rate announcements, GDP reports, or employment data.
How to Implement: You need to monitor economic events such as interest rate announcements, GDP reports, employment data (Non-Farm Payrolls), and inflation indices (CPI) to make trading decisions. Usually, before and after important news, the price will experience significant volatility.
Why it Works: News can cause strong market movements, creating high potential profit opportunities if you predict correctly.
Would you like to learn more about any specific strategy? Please leave a comment below to discuss with us.

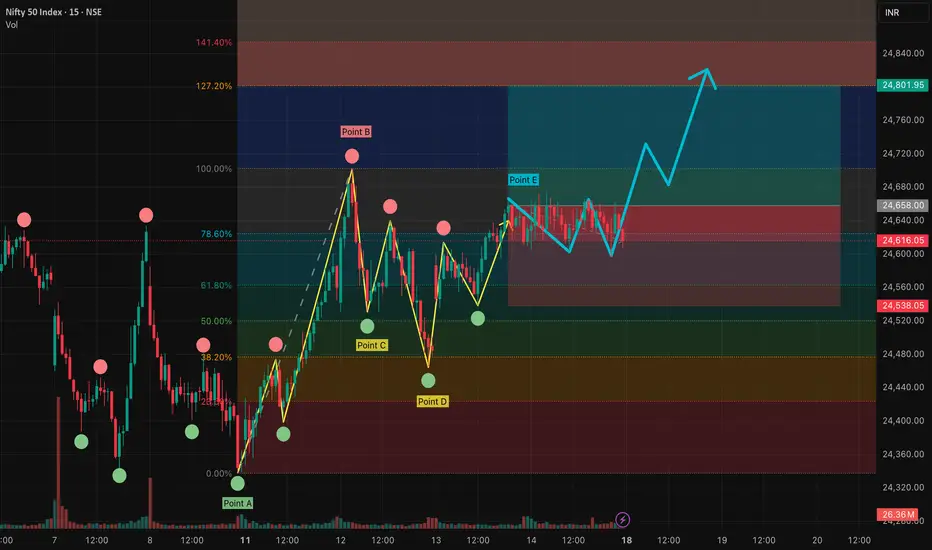
Fibonacci Retracement Explained: Smarter Entries & Exit Zones🔹 Intro / Overview
Fibonacci retracement highlights potential support and resistance zones during pullbacks. By mapping ratios between swing highs and lows, traders can structure trades, plan entries, and manage risk — not predict the market.
📖 How to Use
1️⃣ Identify Swing Points – Draw from recent swing low ➝ swing high (or reverse for downtrend)
2️⃣ Watch Key Levels – 23.6%, 38.2%, 50%, 61.8%, 78.6%
3️⃣ Confirm with Price Action – Candle closes above/below key levels = stronger signal
4️⃣ Plan Stops & Targets – Use Fibonacci zones or swing points
5️⃣ Enhance Reliability – Combine with trendlines, moving averages, or candlestick patterns
📊 Chart Explanation (Step-by-Step)
The chart demonstrates a possible long setup using Fibonacci retracement:
Point A (Swing Low) : Starting point of the retracement
Point B (Swing High) : Endpoint establishing Fibonacci ratios
Point C (Chart Confirmation) : Swing low confirming levels are relevant
Point D (Potential Invalidation) : Price dips near 38.2%–61.8%; closes below could invalidate
Point E (Entry Zone) : Successive closes above 78.6% confirm entry
🔍 Observations
Price respected multiple Fibonacci zones (38.2%, 50%, 61.8%)
Swing highs/lows defined the structure
Yellow path = past trend movement
Blue path = potential reaction for illustration only
📌 Trade Management
Stops : Just beyond Fibonacci zones or swing points
Targets : Next Fibonacci level or previous swing high/low
Reliability increases when combined with other confirmations
✨ Key Takeaways
✔ Fibonacci is a guide, not a prediction
✔ Candle closes near levels strengthen entries
✔ Stops & targets can flex with Fibonacci or swing structure
✔ Always use confluence for decision-making
✅ Conclusion
Fibonacci retracement is a visual framework to time entries and exits with discipline. Combine it with other tools for stronger setups.
⚠️ Disclaimer: For educational purposes only. Not financial advice.
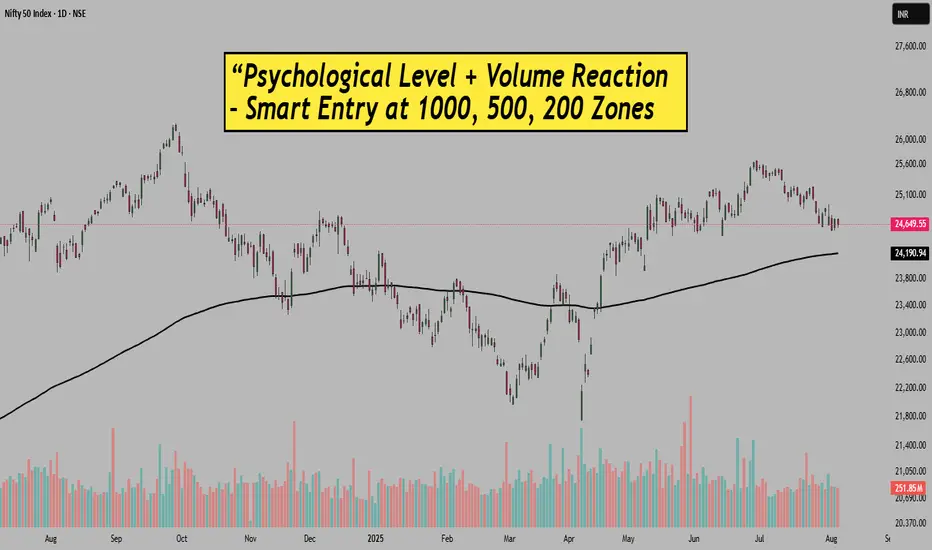
Psychological Level+Volume Reaction–Smart Entry at 1000-500 ZoneHello Traders!
Ever noticed how the market behaves around round numbers like 1000, 200, 500 levels?
There’s something powerful about these zones, not just technically, but psychologically too.
These are the levels where large participants often step in… and smart traders take entry.
Today’s post will help you understand how psychological price levels work — and how to combine them with volume confirmation for better intraday or swing setups.
Why Psychological Levels Matter
Round numbers attract attention:
Levels like 24500, 25000, 25500 in Nifty or BankNifty act as magnets. Institutions, algos, and even retail traders tend to place orders around these levels.
Buyers or sellers take control at these points:
Price often pauses or reverses here, as it becomes a battleground of supply and demand. Especially if this level is also a previous support/resistance zone.
Self-fulfilling behavior of traders:
Because everyone expects a reaction near these zones, price actually reacts. This creates great opportunities if you can enter with the right confirmation.
Volume Confirmation Makes It Powerful
Look for unusual volume near these zones:
Let’s say Nifty hits 24600 and suddenly you see a volume spike on a bullish candle — that’s not coincidence. That’s your cue.
Price rejection with volume is key:
Wick-based candles, engulfing patterns, or inside bars rejecting psychological levels with volume boost often lead to clean intraday moves.
Consolidation + Breakout works best:
If price consolidates near these psychological zones with low volume and breaks out with high volume, it often creates strong directional moves.
Rahul’s Tip:
Instead of randomly entering trades, mark round levels like 24500/24750 on your charts.
Then wait patiently, combine volume + price action and let the trade come to you.
Most false moves get filtered out when you use this setup with discipline.
Conclusion:
These psychological levels are used by big players to trap retail traders, but if you learn to read reactions at these levels, you can trade smarter.
No need to chase. Just observe, react, and manage risk.
What’s your experience with psychological levels? Have they helped your trades?
Share your thoughts in comments.
If this post helped, do like, follow and share with your trader friends.
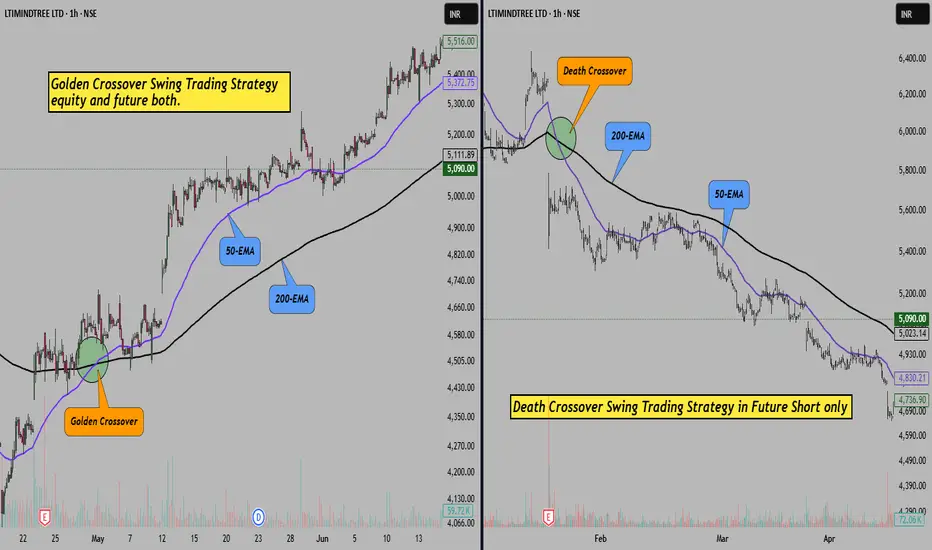
Golden EMA Setup – Catch Medium-Term Trends with 50 & 200 EMA!Hello Traders!
One of the simplest yet most powerful ways to identify long-lasting trends is by using moving averages. And among all combinations, there’s one that stands out for swing and positional trades, the Golden EMA Setup .
It uses just two tools: the 50 EMA and the 200 EMA. When used correctly, this setup helps you ride big trends and avoid choppy zones.
Let’s understand how this works and how you can apply it.
What is the Golden EMA Setup?
It’s a trend-following strategy based on the crossover of two EMAs:
50 EMA (Fast Average): Reacts quicker to price changes
200 EMA (Slow Average): Represents the long-term trend
When 50 EMA crosses above 200 EMA, it’s considered a Golden Crossover , a bullish signal.
When 50 EMA crosses below 200 EMA, it’s a Death Crossover , a bearish signal.
How to Trade This Setup:
Entry:
Buy when 50 EMA crosses above 200 EMA and price is above both.
Stop Loss:
Just below the 200 EMA or recent swing low.
Target:
Trail the stop loss and ride the trend till the crossover reverses or price weakens.
Timeframe:
Works best on daily or 1-hour chart for positional/swing trades.
Rahul Tip:
Golden EMA setup works great during trending phases, but avoid using it in sideways markets — you may get trapped in whipsaws. Always confirm with volume or RSI divergence before entering.
Did you ever used this strategy before, let me know in comment box.
Bollinger Bands: How to Stop Being a Slave to the Markets.Bollinger Bands: How to Stop Being a Slave to the Markets.
Bollinger Bands are a technical analysis indicator widely used in trading to assess the volatility of a financial asset and anticipate price movements. Created in the 1980s by John Bollinger, they consist of three lines superimposed on the price chart:
The middle band: a simple moving average, generally calculated over 20 periods.
The upper band: the moving average to which two standard deviations are added.
The lower band: the moving average to which two standard deviations are subtracted.
These bands form a dynamic channel around the price, which widens during periods of high volatility and narrows when the market is calm. When a price touches or exceeds a band, it can signal an overbought or oversold situation, or a potential trend reversal or continuation, depending on the market context.
What are Bollinger Bands used for? Measuring volatility: The wider the bands spread, the higher the volatility.
Identifying dynamic support and resistance zones.
Detecting market excesses: A price touching the upper or lower band may indicate a temporary excess.
Anticipating reversals or consolidations: A tightening of the bands often heralds an upcoming burst of volatility.
Why is the 2-hour time frame so widely used and relevant?
The 2-hour (H2) time frame is particularly popular with many traders for several reasons:
Perfect balance between noise and relevance: The H2 offers a compromise between very short time frames (often too noisy, generating many false signals) and long time frames (slower to react). This allows you to capture significant movements without being overwhelmed by minor fluctuations.
Suitable for swing trading and intraday trading: This timeframe allows you to hold a position for several hours or days, while maintaining good responsiveness to take advantage of intermediate trends.
Clearer reading of chart patterns: Technical patterns (triangles, double tops, Wolfe waves, etc.) are often clearer and more reliable on H2 than on shorter timeframes, which facilitates decision-making.
Less stress, better time management: On H2, there is no need to constantly monitor screens. Monitoring every two hours is sufficient, which is ideal for active traders who don't want to be slaves to the market.
Statistical relevance: Numerous backtests show that technical signals (such as those from Bollinger Bands) are more robust and less prone to false signals on this intermediate timeframe.
In summary, the 2-hour timeframe is often considered "amazing" because it combines the precision of intraday trading with the reliability of swing trading, providing superior signals for most technical strategies, especially those using Bollinger Bands.
To summarize
Bollinger Bands measure volatility and help identify overbought/oversold areas or potential reversals.
The 2-hour timeframe is highly valued because it filters out market noise while remaining sufficiently responsive, making it particularly useful for technical analysis and trading decision-making.
MACD + RSI Divergence Combo – The Deadly Entry Trick!Hello Traders!
In today’s educational post, we’ll break down one of the most powerful technical setups used by pro traders – the MACD + RSI Divergence Combo . When used together, these indicators don’t just show momentum — they reveal high-probability reversal zones. This setup can help you time perfect entries and avoid false breakouts or breakdowns.
Why Combine MACD and RSI Divergence?
MACD Divergence shows when the price is moving in one direction, but momentum is fading — a clear warning of potential reversal.
RSI Divergence helps confirm overbought/oversold conditions and adds strength to the reversal signal.
Combining Both gives double confirmation, increasing accuracy of entries with minimal lag.
How to Trade This Combo Setup
Step 1: Identify Divergence on MACD
Look for a higher high in price but a lower high on MACD (bearish divergence) or lower low in price with higher low on MACD (bullish divergence).
Step 2: Confirm with RSI Divergence
Now check if RSI also shows a similar divergence pattern. If yes — the setup is strong.
Step 3: Enter with Candle Confirmation
Wait for a strong reversal candle (like engulfing, hammer, or shooting star) before entering the trade.
Step 4: Place Stop-Loss
Place SL below recent swing low (for long) or above swing high (for short).
Step 5: Ride the Move with Trailing Stop
Use support/resistance or moving averages to trail your stop-loss and let profits run.
Rahul’s Tip
One divergence = a warning. Two divergences = a sniper entry!
This combo setup reduces noise and gives you clarity — especially during range-bound markets or weak trends.
Conclusion
The MACD + RSI Divergence Strategy is a reliable tool for spotting trend exhaustion and entering before the crowd. Combine this with proper candle confirmation and risk management, and you’ll have a deadly weapon in your trading toolkit!
Have you tried using this combo before? Drop your experience in the comments and let’s learn together!
If you found this post valuable, don't forget to LIKE and FOLLOW!
I regularly share real-world trading setups, actionable strategies, and learning-focused content — all from real trading experience, not theory. Stay connected if you're serious about growing as a trader!

How to gwt success ?To achieve success, define your goals, cultivate a growth mindset, and prioritize your health. Build strong relationships, embrace continuous learning, and be adaptable. Celebrate your achievements, seek feedback, and stay committed to your long-term goals.
Elaboration:

Management and PsychologyManagement psychology explores how psychological principles and theories can be applied to understand and improve organizational performance. It focuses on human behavior, motivation, and decision-making within a workplace context, helping managers develop more effective strategies for leading teams and achieving business goals.

Option TradingIf you're looking for a simple options trading definition, it goes something like this: Options trading gives you the right or obligation to buy or sell a specific security on or by a specific date at a specific price. An option is a contract that's linked to an underlying asset, such as a stock or another security.

How we trade in option chain ?To trade using an option chain, you first need to understand its structure and the information it provides. Option chains are organized by strike prices, expiration dates, and whether they are call or put options. You then decide whether to buy (long) or sell (short) a particular option contract, specifying the strike price, expiration date, and quantity. Finally, you submit your order through your brokerage platform.

Explanation of RSIThe Relative Strength Index (RSI) is a momentum indicator in technical analysis that measures the magnitude of recent price changes to assess whether an asset is overbought or oversold. It oscillates between 0 and 100, with values above 70 often suggesting overbought conditions and values below 30 indicating oversold conditions.

Technical TradingIn trading, "technical" refers to the practice of analyzing historical price and volume data to identify patterns and predict future price movements. This approach, called technical analysis, is a way to evaluate securities and forecast their behavior based on charts and statistical data.

Basic to Advance in TradingMake profits in intraday.
Stock market concepts and workings explained from very basic level.
Learn powerful day trading strategies.
Learn a step by step approach of how to trade in intraday.
Trend Following (Wealth Generation)
Learn the art of minimizing the risk and maximizing the return.

RSI Divergence Part 3RSI divergence happens when the price and the RSI move in opposite directions. This signals that the current trend may be losing momentum and could reverse soon. For example, if the price keeps rising but the RSI starts falling, it could mean the uptrend is weakening.

Explanation of MACDThe Moving Average Convergence Divergence (MACD) is a technical indicator used in trading to analyze the strength, direction, and momentum of a trend. It's calculated using two exponential moving averages (EMAs) and a signal line, helping traders identify potential entry and exit points.

Technical Analysis class1 1Technical analysis is a means of examining and predicting price movements in the financial markets, by using historical price charts and market statistics. It is based on the idea that if a trader can identify previous market patterns, they can form a fairly accurate prediction of future price trajectories.

Database Trading Part 3
InfluxDB is a high-performance, purpose-built time-series database designed for real-time analytics. It boasts low-latency writes, efficient storage, and a powerful query engine tailored for event-driven systems like algorithmic trading
