VRLLOG Weekly BO zone - Best for trading/investing for mid/long NSE:VRLLOG Levels already mentioned.. Good candidate for swing and investing if interested..
Extra tip: Debt free and even other fundamentals are not bad with the company.
Note:
1. Views are personal. Recheck and take the trade as per your RR.
2. Always remember SL is your lifeline not the big target...
3.Follow us for more patterns and like, share so that we feel it is helpful to many and share more patterns...
3. Views given here is not a tip rather it is for educational purpose... After market opens, the condition might change so learn to handle for different conditions..
4. To learn more about patterns, Psychology behind the trade and price action trading... contact us.. Thanks.
TERM

ITC - Still looks bearish in 1d,1w & 1month chartITC chart still looks in bearish mode..buying will not be a good idea. It will test the support levels at 159 & around 140-136.
Previously, it had bounced upside from 159 level on 12th May (1d chart) it will most probably test that level before going upside.
If it moves further down below 159 level then it will test support range of 140-135. Till then keep an observation..
Also, once it breaks 20 EMA upside, one can think of buying as it moved upward on 20th May (1D chart) but it will face resistance at 50 ema and 200 ema above like it faced on 20th April at 50 ema & 200 ema on 3rd July & 11th Aug.
On a safer side for a long term, it would be better to wait till it breaks 200 ema and buying above 206.
*This view is based on my technical analysis and is for educational purpose only. Please feel free to discuss if I'm wrong somewhere.

CAMS - GOOD INVESTMENT PICK AT DIPSCAMS is a fresh enterant into the market which it's IPO opening up in October! It gave decent gains to the IPO investors but not sufficent enough as expected. Price fell from the IPO bell open and it's been under profit booking until last three weeks when it broke the IPO Open day high and the price has been rallying upwards.
CAMS is a great business to own. As more GEN Z population enter into the markets, we can see CAMS growning.

APEX: Advance pattern (W + Flag) + 'W' + 'W' within Channel► ADVANCE PATTERN #4 ◄
📌 Levels are mentioned on chart for ❝Swing trading❞.
☆ Please check the description section ⌨ for early entry level in given stock ₪ to get better Risk to Reward (☈☈) ratio.
☆ Kindly like & share ➥ this pattern. Comment ⎚ with what do you think. Follow me @ tradingview for more updates and like the chart ❤!!!
Entry: ▲ 325
SL: ☢ 300
Target: ➚ 390
RR: ☈ 1:2.6
☆ Thank you. Happy Trading!!!
Best Regards,
𝘿𝙧. 𝙎𝙝𝙖𝙢𝙧𝙖𝙟𝙖 𝙉𝙖𝙙𝙖𝙧
𝙋𝙝𝘿 𝙞𝙣 𝙏𝙚𝙘𝙝𝙣𝙤𝙡𝙤𝙜𝙮.
✮ Disclaimer ✮
--------------------------------------------------------
All investments involve risk, and the past performance of a security, industry, sector, market, financial product, trading strategy, or individual’s trading does not guarantee future results or returns. Investors are fully responsible for any investment decisions they make. Such decisions should be based solely on an evaluation of their financial circumstances, investment objectives, risk tolerance, and liquidity needs.
---------------------------------------------------------

ICICI Prudential - Symmetrical Triangle BreakoutICICI Prudential looking good on a weekly/daily timeframe.
Above 508 it should march towards its lifetime high (538) and once crosses 540 levels, we can expect the 570 and 630 levels according to Fib extension and Pivot levels respectively.
Note - Feel free to give any advice regarding this analysis down in the comments section.
Disclaimer - Please do not take trades according to this analysis and do your due diligence before entering into this. This is just for educational purposes and not to be considered as a tip.

▰ Time to Learn Advance Pattern #2: CENTURYTEX ▰► Time to learn Advance Pattern #2 ◄
♒ E͙V͙E͙R͙Y͙T͙H͙I͙N͙G͙ ͙ O͙N͙ ͙ C͙H͙A͙R͙T͙ ♒
📌 I have found 15 new patterns on the charts. These are original and unique patterns that can achieve their target almost 80-90% times. Here, I have posted one of my favourite 💕 chart patterns.
☆ I will post the remaining patterns one by one on Sunday. For your reference, you can check out my previous studies as well. Please find the stocks and comment their name in the comment ⌨ section.
☆ Follow me @ Tradingview for more updates and like the chart ❤!!!
☆ Thank you. Happy Trading!!!
Best Regards,
𝘿𝙧. 𝙎𝙝𝙖𝙢𝙧𝙖𝙟𝙖 𝙉𝙖𝙙𝙖𝙧
𝙋𝙝𝘿 𝙞𝙣 𝙏𝙚𝙘𝙝𝙣𝙤𝙡𝙤𝙜𝙮.
✮ Disclaimer ✮
--------------------------------------------------------
All investments involve risk, and the past performance of a security, industry, sector, market, financial product, trading strategy, or individual’s trading does not guarantee future results or returns. Investors are fully responsible for any investment decisions they make. Such decisions should be based solely on an evaluation of their financial circumstances, investment objectives, risk tolerance, and liquidity needs.
--------------------------------------------------------


PIDILITE INDUSTRIES - LONG New Breakout Trade Idea
Pidilite Industries
LTP ~ INR 1718.70/-
Consolidation Breakout At INR 1710/-
Profit Target Goal ~ TP 1~ 1850/- Shorter Term
TP 2 ~ 2000/- Long Term
Stop Loss ~ INR 1600/- Closing Below
ROI ~ 16% Long TErm Holding
RRR ~ 2.39:1.00
Note:- High Financial Strength, Expensive Valuation With Technically Moderately Bullish

Nifty view till December ExpiryAs Index moves higher approaching resistance trend line with RSI above 80. Small intraday dips are being bought and somehow index management is going on. The risk reward for Long becomes very unfavourable at these levels.
Immediate resistance at 13880-13920 and if index manages to stay above 13600-700 for upcoming sessions then we may see one more attempt towards 13950-14020.
Immediate Support at 13600 followed by 13350. 12750-13000 zone should act as strong demand zone, one can use the dip in this zone to buy.
For next 2 weeks - 21st Dec-31st Dec
Any gap ups towards resistance zone should be used to sell with SL 14050.
If holds 13600, one can go long using 13550 as SL.
Sustaining below 13600 will make this structure weak and may attract more selling till 13350.
Happy Trading

TATA MOTOREVERY FALL IS A BUY IN TAMO UNTIL 100, BEWARE A 100 IF IT GOES BELOW 100 MIGHT BE DIFFICULT TO COME BACK FOR YOU THAN THE COMPANY, THEY HAVE MULTIPLE BUSINESS.....

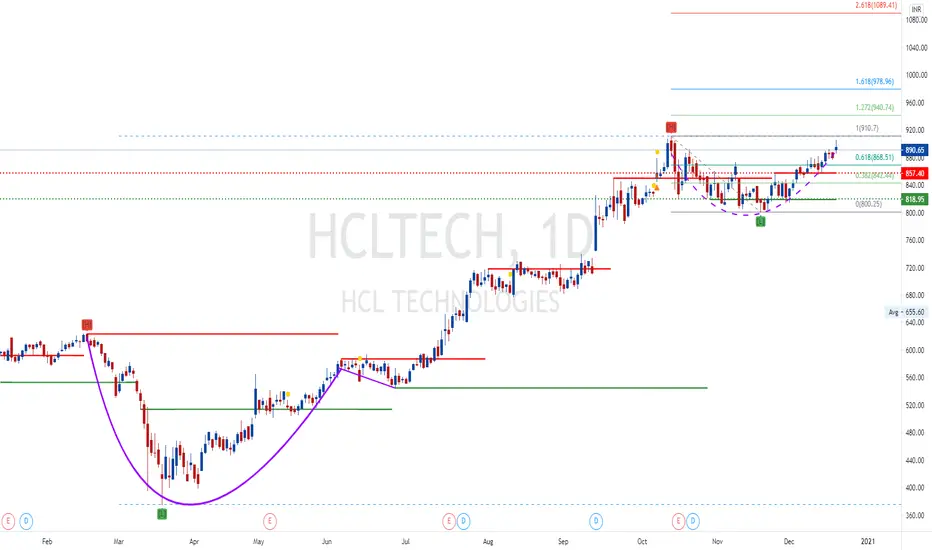
HCL TECHNOLOGIES - LONG
New Breakout Trade Idea
Action - BUY - Positional
Script - HCL TECHNOLOGIES
LTP ~ INR 890/-
Flat Base Breakout at INR 910.70/-
Profit Target Goal ~ INR 1050/-
Stop Loss ~ INR 850/- Closing Below
ROI ~ 18% Long Term
RRR ~ 4.00:1.00
MACD ~ 14.1 Above Signal
RSI ~ 64.1 Mid-Range
PE Trailing 12M ~19.84 Industry P/E ~ 29.03
ROE ~ 21.53% ROCE ~ 29.85%
P/B~ 4.22
Moving Averages: - Trading above 50 Day SMA since 22 days (since Nov 27, 2020)
Trading above 30 Day SMA since 22 days (since Nov 27, 2020)
Note ~ High Financial Strength, Expensive Valuation With Technically Moderately Bullish
AUDUSD MAKING UP TREND AUD IS BULLISH ON USD LIKE EURO,GBP, OTHERS AND MAKING NEW HIGH FOR THIS BULLISH MOVEMENT MY TARGET IS 0.76500 AFTER THAT IT DO SOME CORRECTION THAT'S MY MY ANALYSIS BTW WHAT YOUR ANALYSIS SAY ABOUT AUDUSD MENTION IN COMMENTS :)

Pattern on High TimeFrame... Major Breakthrough expectedCan see a triangle pattern on a weekly time frame. Looks like a major breakthrough can come in it. Can keep a watch on this and might give good returns.
The time range here is almost 5 months so move can give good result with swing trade.
======================================================================================================================================================
Disclaimer:
The information provided here is for educational & instructive purposes only. Our intention is not to provide any financial advice, investment advice, training advice or any other advice. This is general information and is not explicit to you or anyone else.
Please do your own research and consult with your financial adviser before investing or trading. We will not be responsible for any profit or loss.

Long term view on Tata PowerTata Power had gave a 1st big breakout at levels of 53 and gave a 2nd breakout at levels of 64 after forming head and shoulders pattern.
Company is establishing EV charging stations. It recently gained letter of intent from 2 Odisha discoms and it's arm CGPL cleared a debt of 1550 crores. These points make the company fundamentally attractive too.
Levels of 110-120 can be seen in the long term.


Bandhan Bank looking good Bandhan bank breakout + Retest and break the breakout candle perfect charts according to me for long from CMP for the first target of 500

IRCTC (Long term)Can start a directional move anytime soon. Has been sideways for quite some time now. Good for long term investment


Hdfc bank for buy level NSE:HDFCBANK
Hdfc bank for buy level buy on 1350 hold up to 1550 1000% target will Hit


DEEPAK NITRITE TO MAKE NEW LIFE TIME HIGHAccording to my analysis a very good breakout of cup and handle pattern is observed and crossover has happened in moving averages.
so very good upside move is possible.
Disclaimer: Dont invest based on my views.

