Texmaco Rail 30 mins TF Price Action AnalysisAnalysis is valid for 30th Jan to 7th Feb trading week only
Refer to the trading logic and entry / exit levels shown on the chart
Happy trading!
Tradingsignals

XAUUSD (Gold) | Bullish vs Bearish SetupS | 23rd Jan'2026XAU/USD – Key Levels (23 Jan 2026)
Resistance:
* R1: 4975–4985 → Near-term supply
* R2: 5000–5015 → Psychological breakout zone
Support:
* Pivot / Demand Zone: 4940–4955 → Intraday balance
* Primary Support: 4920–4940 → Trend bullish above
* Secondary Support: 4880–4900 → Strong swing support
* Trend Invalidation: 4850 → Break weakens bullish trend
Bullish Swing Setup
* Buy on Dip: 4920–4940 | SL: 4900 | Targets: 4975 → 5000 → 5015
* Breakout Buy: Above 4985 | SL: 4955 | Targets: 5000 → 5030 → 5050
Bearish Swing Setup (Corrective)
* Pullback Sell: Below 4920 | SL: 4940 | Targets: 4880 → 4850 → 4820
* Trend Shift Sell: Break below 4850 | SL: 4880 | Targets: 4800 → 4760

Trading Master classTechnical Analysis is the study of price movements and trading volume to forecast future market behavior. It is widely used by traders and investors to identify entry, exit, and trend direction.
One of the core topics is Price Action, which focuses on analyzing raw price movement without indicators. Traders observe candlestick patterns, market structure, and momentum to understand buyer–seller behavior.
Charts are another foundation. Common chart types include Line Charts, Bar Charts, and Candlestick Charts. Candlestick charts are most popular because they clearly show open, high, low, and close prices along with market psychology.
Trend Analysis helps identify whether the market is in an uptrend, downtrend, or sideways trend. Tools like trendlines, higher highs & higher lows, and lower highs & lower lows are used to confirm trend direction.
Support and Resistance levels represent key price zones where demand or supply is strong. Support acts as a floor where prices may bounce, while resistance acts as a ceiling where prices may face selling pressure.
Technical Indicators are mathematical calculations based on price and volume. Popular indicators include Moving Averages, Relative Strength Index (RSI), MACD, Bollinger Bands, and Stochastic Oscillator. These help measure trend strength, momentum, volatility, and overbought/oversold conditions.

XAUUSD (Gold) | Bullish vs Bearish Scenario | Trading SetupBullish vs Bearish View
Bullish Scenario (Primary Bias – Trend Continuation)
Trend remains strongly bullish as long as price holds above the pivot zone (4858–4845).
Buyers are in control, supported by ADX strength, MACD momentum, and moving average
alignment.
Break and hold above 4888 opens the door for further upside expansion.
Bearish Scenario (Corrective Pullback Only)
Bearish moves are considered corrective, not trend-reversing, unless price falls below 4800.
Overbought conditions may trigger short-term profit booking, but trend remains bullish
above key supports.
Key Levels to Watch
Resistance Levels
4888 – 4895 (Day high / breakout zone)
4914
4939 – 4950 (extension zone)
Support Levels
4858 – Pivot
4845
4829
4803
4773 (strong trend support)
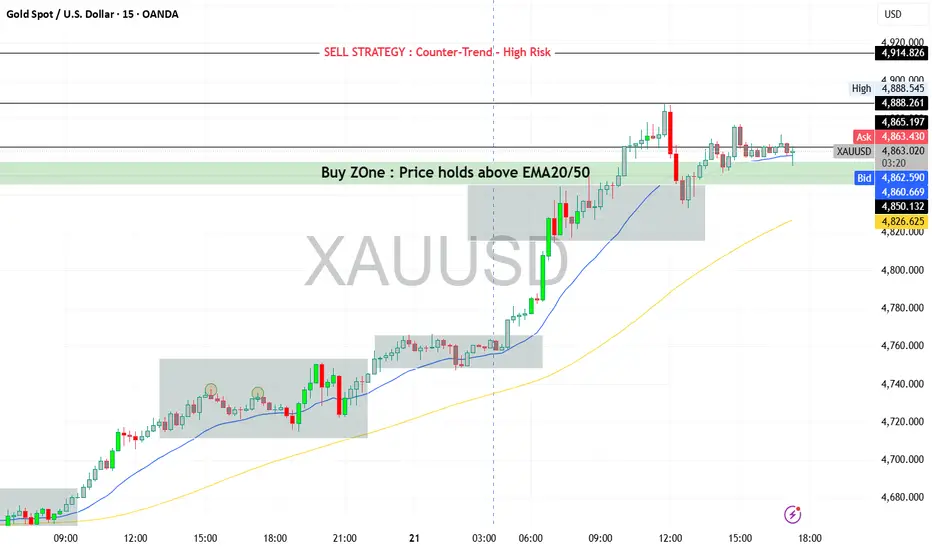
Intraday Trading Strategy (Day Trading Plan)
Strategy Type:
Trend Continuation Buy-on-Dips
Buy Setup
Buy Zone: 4858 – 4845 (pivot support / minor pullback)
Confirmation:
Price holds above EMA20 / EMA50
Bullish rejection candle or continuation pattern on M15–M30
Targets
Target 1: 4888
Target 2: 4914
Target 3 (extension): 4939
Stop Loss
Intraday SL: Below 4825
Aggressive SL: Below 4800 (trend invalidation zone)
Alternative Sell Strategy (Counter-Trend – High Risk)
⚠️Only for experienced traders
Sell Zone: 4914 – 4940
Condition: Clear rejection + bearish divergence on M15/M30
Target: 4880 → 4858
Stop Loss: Above 4955
Preferred Trading Style Today
✔️Buy on dips
❌Avoid chasing price at highs
❌Avoid heavy counter-trend sells
XAUUSD H3 – Liquidity Dominates Near ATHGold is trading in a sensitive zone just below all-time highs, where liquidity, Fibonacci extensions, and trend structure are converging. Price action suggests a controlled rotation rather than a clean breakout, with clear reaction levels on both sides.
TECHNICAL STRUCTURE
Gold remains in a broader bullish structure, with higher lows supported by an ascending trendline.
The recent impulse confirmed bullish intent, but price is now stalling near premium liquidity, signaling potential short-term distribution.
Market behavior shows buy-the-dip dynamics, while upside extensions are being tested selectively.
KEY LEVELS FROM THE CHART
Upper liquidity / extension zone:
Fibonacci 2.618 extension near the top band
This area represents profit-taking and sell-side liquidity, especially if price reaches it with weak momentum.
Sell reaction zone:
4412 – 4415 (Fibonacci 1.618 + prior ATH reaction)
A classic area for short-term rejection if price fails to break and hold above.
Buy-side focus:
4480
This level acts as a buy-on-pullback zone, aligned with trendline support and prior bullish structure.
Expected flow:
Price holds above 4480 → attempts to push toward ATH → potential extension into the 2.618 zone.
Failure to hold 4480 → rotation back toward lower structure for liquidity rebalance.
MARKET BEHAVIOR & LIQUIDITY LOGIC
Current structure favors reaction-based trading, not chasing breakouts.
Liquidity above ATH is attractive, but the market may need multiple attempts or a deeper pullback before a sustained breakout.
As long as higher lows are respected, pullbacks remain corrective.
MACRO CONTEXT – DXY BACK ABOVE 99
The US Dollar Index (DXY) has climbed above 99 for the first time since December 10, gaining 0.14% on the day.
A firmer USD can slow gold’s upside momentum in the short term.
However, gold’s ability to hold structure despite a stronger dollar highlights underlying demand and strong positioning.
This divergence suggests gold is not purely trading off USD weakness, but also off liquidity, positioning, and risk hedging flows.
SUMMARY VIEW
Gold remains structurally bullish on H3
Short-term price action is driven by liquidity near ATH
4480 is the key level defining bullish continuation
Upside extensions may require consolidation or pullbacks before a clean break
In this environment, patience and level-based execution matter more than directional bias.

XAUUSD H1 Main Trend for the Weekend
Gold failed to confirm a sustainable upward momentum after yesterday's price reaction, prioritizing a short-term adjustment scenario before reassessing the trend
PRIORITY SCENARIO
Strategy to sell based on reactions at large volume areas, suitable for the current short-term structure
Focus sell area: 4332 – 4342
Technical basis: these are areas concentrated with volume according to the Volume Profile, where price is likely to show distribution reactions after a weak recovery
Expected movement: price recovers to the large volume area for distribution, then continues the adjustment phase
Daily target:
Heading towards the 4275 area, coinciding with the Fibonacci retracement area and underlying support
Position management:
Sell should only be held short-term. If the price surpasses and stabilizes above 4342, risk should be reduced and avoid holding sell orders.
ALTERNATIVE SCENARIO
Monitor price reactions at deeper support areas to reassess trading opportunities
Strong support area: around 4275
Technical context: this is the convergence area between structural support and Fibonacci retracement, likely to show defensive buying force
Expected movement: if the price reacts well at this area, the market may enter a re-accumulation state
MAIN REASON
On H1, the previous upward phase failed to maintain a clear upward structure, indicating weakening buying force
Volume Profile helps identify the 4332 – 4342 areas as advantageous entry points for the sell reaction scenario
The 4275 area serves as a reasonable adjustment target in the context of a typically momentum-lacking weekend market
MACRO CONTEXT AND MEDIUM-TERM OUTLOOK
While short-term fluctuations lean towards adjustment, major institutions still maintain a positive outlook for gold in the medium and long term. Goldman Sachs forecasts gold prices could reach $4,900/oz by the end of 2026, supported by strong buying demand from central banks and positive impacts from the Fed's interest rate cut cycle.
This suggests that short-term declines may be more of a technical adjustment rather than a reversal of the long-term trend.

XAUUSD (H1) – Friday Weekend
Lana prioritizes the adjustment phase towards the POC area, looking to Sell in the liquidity zone 💛
Quick Summary
Context: Friday, the market often tends to take profits and sweep liquidity before the week closes
Monitoring Frame: H1
Main Viewpoint: Prioritize a decrease during the day (adjustment phase)
Key Point to Note: 4308 has reacted multiple times, a sensitive point in the structure
Market Context
The weekend is usually a time when the cash flow is “lighter” and price behavior tends to lean towards profit-taking. Therefore, an adjustment phase to gain more liquidity is the scenario Lana prioritizes today.
From a medium-term perspective, some large institutions still maintain a positive view on gold. However, in intraday trading, Lana still prioritizes following the current price behavior and trading according to the liquidity zone.
Technical View H1
On H1, the price is fluctuating around the accumulation zone, and the POC/VAL area indicates this is a market zone that has been “back and forth” for quite a while. When the price returns to these areas, there is usually a clear reaction.
The 4308 area is noteworthy because the price has reacted multiple times, so this is a point that could determine whether the adjustment phase continues.
Today's Trading Scenario
Main Scenario – Sell at POC/VAL area (large liquidity)
Sell: 4335 – 4340
Lana prioritizes waiting for the price to rebound to this area to sell according to the adjustment phase. This is a large liquidity zone, suitable for finding a downward reaction during the day.
Alternative Scenario – Buy scalping at near support
Buy: 4284 – 4289
This Buy order is only for scalping when the price hits the support area and a bounce reaction appears. If the market continues to be weak, Lana will not hold the Buy for too long.
Session Notes
If the price continues to be rejected around resistance areas and cannot surpass the supply zone, the adjustment scenario will have an advantage.
For Friday, Lana prioritizes light trading, quick closing, avoiding holding positions too long over the weekend.
Lana's Notes 🌿
Each scenario is just a probability. Lana always sets a stop loss first, chooses the appropriate volume, and is ready to skip if the price does not reach the waiting area.

XAUUSD H1 Analysis Before Key NewsXAUUSD H1 Analysis Before Key News
During the Asian-European session, gold is likely to move sideways awaiting news as the market enters a sensitive phase with data and political factors, amidst a clearly formed short-term downtrend structure.
PRIORITY SCENARIO
Trading strategy according to the current structure, prioritizing short-term sell and buy at lower liquidity zones.
Main sell zone: around 4323, coinciding with the POC of the Volume Profile.
Technical context: price is moving below the equilibrium zone, clear H1 downtrend structure; the POC area often acts as a "pullback to sell" price zone.
Expected movement: early European session may see a pullback of about 40–50 points, then price returns to sideways movement and faces downward pressure again.
Position management:
Sell should only be held short-term and tightly managed when price reacts at 4323. If price surpasses POC and holds above this zone, risk should be reduced and avoid holding sell positions.
ALTERNATIVE SCENARIO
Strategy to buy at lower liquidity zones, suitable for medium-term trading.
Buy zone 1: around 4242, important VAH zone.
Buy zone 2: around 4215, Buy Zone according to Volume Profile.
Technical context: these are two price zones with high liquidity density, often attracting buying force when the market needs to rebalance after a decline.
Expected movement: price sweeps liquidity below, creating a new accumulation base and seeking recovery opportunities.
MAIN REASON
On H1, a downtrend structure has formed after a distribution phase, indicating short-term advantage leans towards the sell side.
Volume Profile clearly identifies POC 4323 as a reasonable pullback zone to sell, while 4242 and 4215 are price zones with high probability of buying reaction.
Sideways scenario before news fits the market context awaiting important macroeconomic and political information.
MACRO CONTEXT AND POLITICAL NEWS
Political factors are strongly impacting the currency market, especially the USD. The US is said to have proposed a security guarantee mechanism for Ukraine similar to NATO's Article 5 to promote negotiations to end the conflict with Russia, although territorial issues have not yet reached consensus.
These signals are putting weakening pressure on the USD, thereby continuing to support gold in the medium term. However, in the short term, strong volatility around news release time is something to be particularly noted.
RISK MANAGEMENT AND MONITORING
Do not prioritize trading when price is between the equilibrium zone and has not reached important Volume Profile levels.
Sell orders should only be considered short-term trades before news, avoiding holding through data release or important political speeches.
Medium-term buy strategy will have more advantage if price reacts clearly at 4242 or deeper at 4215.
Closely monitor USD fluctuations as current political news is the main driving factor.

XAUUSD – Continuation Update | Buy Trade Progressing as PlannedAfter the earlier move and corrective phase, Gold once again respected the previous high → support zone, confirming that buyers were still defending structure.
🔹 Buy Trade Recap:
Entry taken after structure held above support
Price dipped close to SL, but never broke structure
Liquidity was grabbed, weak hands shaken out
Market respected demand and expanded upward
🎯 TP1 hit successfully
Partial profits secured as planned.
🔹 Current Status:
Buy position still active
Targeting TP2
SL protected and trade managed
This trade is a reminder:
Markets don’t reward impatience.
They reward those who trust their analysis and manage risk.
Almost stopped out, yes — but structure stayed intact.
And that’s all that matters.
Patience is not passive.
It’s a position.
#XAUUSD #Gold #TradeManagement #SmartMoney #TradingView #ValhallaCore

XAUUSD – Structure Delivered | Buy Complete Sell Phase InitiateThis chart was shared on 12-12-2025 when Gold was holding previous high → flipped support.
That level did exactly what it was supposed to do.
🔹 Buy Logic (12-12-2025):
Previous highs tapped → support confirmed
Strong displacement from the level
Clean bullish structure continuation
Price respected demand and delivered full upside move
🎯 Buy target hit cleanly, no drawdown drama.
Now fast forward ⏩
After the expansion, price reached premium supply / distribution zone, failed to continue higher, and started forming lower highs.
🔻 Current Sell Bias:
Rejection from supply
Bullish structure weakened
Market shifting into retracement / distribution phase
Expecting continuation towards lower imbalance / support zones
This is how the market works:
➡️ Expansion
➡️ Target delivery
➡️ Distribution
➡️ Reversal / retracement
Same chart. Same plan.
Bias changes when structure changes, not when emotions do.
#XAUUSD #Gold #SmartMoney #MarketStructure #TradingView #ValhallaCore

XAU/USD: Sell on Bearish OB, Buy Deep at Bullish OB1. Context & Price Structure (M30)
• The price is in a downward correction after a strong previous increase.
• On the retracement zone, EQH + ChoCH decrease appears → signal of weakening buying flow, prioritize "retracement to sell" in the short term.
• The price is still pressed under the descending trendline, so the short-term bias remains downward until a clear break occurs.
• Support Zone 4,275 is the decisive point: if held, it will rebound technically, if broken, it opens the path to the lower demand zone.
2. Key Levels (according to the chart drawn)
• OB Bearish (Sell Zone): 4,308 – 4,312 (≈ 4,311.888) → supply zone + trendline confluence, prioritize watching for SELL when retracing.
• Support Zone: 4,272 – 4,276 (≈ 4,275.451) → central support zone, can create a rebound/retracement.
• Mid Support / Target: 4,247.624 → next target if 4,275 is broken.
• OB Bullish (Buy Zone): 4,223.400 – 4,205.983 → strong demand zone, expected to sweep and reverse.
3. Trading Plan (with clear conditions)
Scenario 1 – SELL on retracement at Bearish OB (main scenario)
• If the price retraces to 4,308 – 4,312 and a rejection reaction appears:
strong pin bar
downward engulfing
or ChoCH decreases again on M15/M30
• Then prioritize SELL according to the correction trend.
• TP1: 4,275
• TP2: 4,247
• TP3: 4,223 (approaching OB Bullish)
• Invalidation: M30 closes above 4,318 and holds above → stop SELL idea.
Scenario 2 – BUY deep at Bullish OB (important scenario to catch a large retracement)
• If the price breaks 4,275 with a clear M30 candle and slides down to 4,223 – 4,206.
• Wait for Liquidity Sweep + reversal signal:
pin bar at OB
upward engulfing
or ChoCH increases (M15/M30)
• When confirmed, prioritize BUY.
• TP1: 4,247
• TP2: 4,275
• TP3: 4,308
• Invalidation: M30 closes below 4,198 → stay out and observe.
4. Risk Management Notes
• Do not chase SELL when the price is close to 4,275 (support zone).
• Do not BUY early before the price hits Bullish OB and confirmation is received.
• If the price reclaims strongly above the trendline + 4,312, the bias will shift to "BUY pullback" instead of "Sell retracement."

Waiting for FVG / Liquidity Pullback, Trend-Following BUY Bias1. Market Context & Structure (H1)
• Gold has completed a liquidity sweep followed by a bullish BOS, confirming that the short-term uptrend remains intact.
• After the strong impulse, price is now entering a rebalancing / technical pullback phase rather than a reversal.
• The overall structure remains Higher High – Higher Low, favoring BUY strategies aligned with the dominant trend.
2. Key Technical Zones on the Chart
• Resistance / Supply Zone 1: 4,359 – 4,360
→ A previously strong reaction zone, where short-term corrections may occur.
• Resistance / Supply Zone 2: 4,394
→ Fibonacci 0.786 extension area, prone to profit-taking or upper liquidity sweeps.
• iFVG – Pullback Zone: 4,297 – 4,300
→ Inefficiency left during the bullish impulse, prioritized for the first BUY reaction.
• Liquidity Buy Zone: 4,267
→ Resting liquidity below, where a deeper sweep may occur before trend continuation.
3. Trading Scenarios – Captain Vincent Style
🔹 Primary Scenario – BUY at iFVG / Liquidity Buy (Preferred)
• Expect price to pull back from the 4,35x area toward 4,297 – 4,300 (iFVG) or deeper into 4,267 (Liquidity Buy).
• At the BUY zone, wait for confirmation signals:
– Strong rejection wicks
– Bullish engulfing
– Bullish ChoCH on M15–H1
• Preferred BUY Zones:
– BUY 1: 4,297 – 4,300
– BUY 2 (deeper): 4,267
• Targets:
– TP1: 4,359
– TP2: 4,394
– TP3 extension: continuation if 4,394 is broken.
• Invalidation:
– H1 close below 4,255 → short-term bullish structure weakens.
🔹 Secondary Scenario – Short-Term SELL Reaction at Supply
• If price rallies directly into 4,359 – 4,394 without a clear pullback, a short-term SELL reaction may appear.
• SELLs are scalp / counter-trend only, not the primary scenario.
• SELL target: pullback toward iFVG 4,297.
4. Risk & Management Notes
• Avoid FOMO BUY at high resistance zones.
• Prioritize BUY entries at discounted areas (FVG – Liquidity).
• Main bias remains BUY on pullbacks; SELLs are only technical reactions.
• Adjust position sizing carefully as the market is in an expansion phase.

XAGUSD – Clean Rejection From Discount Zone With Upside Silver reacted perfectly from a refined discount zone after a controlled pullback. The immediate rejection and push back above micro structure levels indicate bullish absorption and renewed momentum.
This reaction aligns with the broader HTF bullish narrative, suggesting price may continue expanding toward upside inefficiencies if structure holds.
Bullish Path:
• Tap into refined discount zone
• Strong rejection wick + recovery
• LTF structure shift confirming accumulation
• Expansion toward next HTF imbalance / liquidity pocket above

XAU/USD: Buy at 4.19x, Sell Short at OB 4.24x1. Market Context (H1)
Gold is moving within a corrective structure after the previous strong rally. The current price action revolves around two main zones:
Buy Support Zone 4,197–4,200: where the price continuously reacts, with multiple BoS – ChoCH increases → indicating that buying pressure still maintains the base.
OB Zone – Sell 4.24x: confluence of Fibonacci 0.5 – 0.618 – 0.786, a zone likely to see a decline reaction before forming a larger trend.
The current structure leans towards a recovery to the OB Sell zone, after which the market may continue to adjust deeper to create liquidity before rising again.
2. Important Technical Zones
🔹 Support – Buy Zone: 4,197 – 4,200
This is a strong price base, where BoS + ChoCH continuously form.
Only when breaking below this zone → the short-term uptrend structure weakens.
🔹 OB Zone – Sell: 4,238 – 4,245
Confluence of Fibonacci retracement (0.5–0.618–0.786).
A favorable zone for the market to create a decline reaction, triggering a liquidity sweep to lower lows.
🔹 Strong Low: 4.17x
This is an important low – if the price sweeps here but does not break → expect a strong rebound to higher targets.
3. Trading Scenarios According to Structure
🔸 Scenario 1: Price recovers to OB Sell 4.24x → look for short-term SELL signals
Wait for the price to hit the OB Sell zone and appear:
Strong rejection candle
ChoCH decreases on M15 frame
Volume increases at the peak
Then expect a decline back to the Support Buy zone 4,197–4,205.
Trading idea:
Sell zone 4,238–4,245
Target: 4.20x
If breaking 4.20x deeply → extend to Strong Low 4.17x
🔸 Scenario 2 (high priority): Buy at Support to catch the rise to 4.25x – 4.27x – 4.29x
After completing the decline according to scenario 1, the price may rebound from the strong demand zone.
BUY conditions:
Price sweeps down to 4,197–4,205 or deeper to 4.17x.
Reversal pattern appears + ChoCH increases.
Recreate HL (higher low) structure.
Targets:
TP1: 4,234
TP2: 4,244
TP3: 4,258
Extended TP: 4,276 – 4,299 (Fibo 1.272 – 1.618)
4. Risk Management Notes
Do not chase Buy when the price is in the OB Sell zone – easy to get swept.
Do not Sell deeply when not reaching OB 4.24x zone – price has not entered a nice premium zone.
Always clearly define invalidation levels:
BUY invalid when price closes H1 below 4.17x.
SELL invalid when price breaks strongly above 4,245 and holds.

PAYTM (One 97 Communications Ltd.) – Technical Outlook & LevelsPAYTM is currently trading near ₹1,344 and remains in a strong upward Elliott Wave structure.
A clean breakout above ₹1,380–1,400 may trigger Wave-3 momentum toward ₹1,850–₹2,000.
Supports at ₹1,300 and ₹1,225 remain crucial for trend continuation, while ₹1,250 acts as an ideal stop-loss for swing setups. Long-term Wave-5 projections suggest a potential move toward ₹2,150–₹2,250.
🎯 Future Target Levels
🔹 Swing Trading Targets
• Target 1: ₹1,420 – ₹1,450
• Target 2: ₹1,550 – ₹1,600
🔹 Position Trading Targets
• Wave 3 Target Zone:
👉 ₹1,850 – ₹2,000 (Fib 1.618–2.0 extension)
• Wave 5 Extended Target:
👉 ₹2,150 – ₹2,250 (Post Wave-4 completion)
🛑 Key Support Levels
• Major Support: ₹1,300
• Intermediate Support: ₹1,225
• Structural Support: ₹1,100 (previous swing-low zone)
📌 Resistance Levels
• Immediate Resistance: ₹1,380
• Next Resistance: ₹1,450
• Major Resistance Zone: ₹1,550 – ₹1,600 (Breakout above this zone can accelerate the Wave-3 rally)
🔐 Stop-Loss Recommendations
Swing Trades
• SL: ₹1,250 (below trendline & previous corrective low)
Positional Trades
• SL: ₹1,180 (below Wave-2 base level)
📌 Thanks a ton for checking out my idea! Hope it sparked some value for you.
🙏 Follow for more insights
👍 Boost if you found it helpful
✍️ Drop a comment with your thoughts below!

XAU/USD: Gold Consolidates, Awaiting Pullback for Breakout📊 Market Structure (H1)
Gold is moving within a converging triangle pattern – with the bottom being pushed higher by buying pressure, while the top is continuously blocked by the H1 descending trendline.
After the previous strong decline, the market has consecutively created bullish ChoCH , indicating that capital flow is starting to return, but the pivotal supply remains at the OB Bearish 4.23x area – where the price is currently stuck.
Currently, the price is testing the upper edge of the triangle + supply area, which is primarily used for distribution and liquidity sweep. → Not an optimal area for FOMO BUY.
💎 Key Levels – Important Areas
• OB Bearish – 4.23x: confluence with descending trendline → high probability area for strong reaction or Liquidity Sweep.
• FVG – 4.21x: H1 price gap, the market tends to return to fill before continuing.
• OB Bullish – Buy Zone – 4.201: H1 demand + lower edge of current range → priority area to observe BUY according to trend.
• Liquidity Buy – 4.170: lower liquidity area → price may sweep deep before bouncing strongly if the medium-term uptrend remains effective.
• Upper Target – 4.25x: expanded target if gold successfully breaks the converging triangle.
🎯 Trading Plan – Trading Scenarios
1️⃣ Priority Scenario: Pullback to OB Bullish
If the OB Bearish 4.23x area reacts (wick rejection, reversal pattern, weakening momentum), expect the price to retreat to:
→ FVG 4.21x
→ OB Bullish 4.201
At the 4.20x area, if a bullish ChoCH / engulfing / strong pin bar appears, this will be a reasonable BUY area according to the trend.
Suggested TP:
• TP1: FVG 4.21x
• TP2: Retest OB Bearish 4.23x
• TP3 expanded: 4.25x area if price breaks the triangle
Invalidation: H1 closes below 4.195 → stay out and wait for reaction at Liquidity 4.170.
2️⃣ Alternative Scenario: Deep Sweep to Liquidity Buy
If OB Bullish 4.20x does not hold and the price breaks down strongly, do not catch the falling knife.
→ Wait for gold to reach Liquidity Buy 4.170
→ Observe reaction: long wick, selling pressure depletes, new HL formation…
Only BUY again when the signal is clear.
If the 4.170 area is broken strongly by an H1 candle → temporary uptrend structure loses effectiveness, reduce volume or stay out until the market stabilizes.
⚠️ Risk Management
This is a trading plan based on an idea – not an immediate entry signal.
Do not BUY directly at the 4.23x resistance area.
Be patient for a pullback to the discount area (4.20x – 4.17x) and always set clear risk.
“Liquidity tells the truth — structure confirms the path.” ⚜️
⏰ Timeframe: H1
✍️ Analysis by: Captain Vincent

Swing Trading and Positional Trading Profits1. Understanding Swing Trading Profits
What is Swing Trading?
Swing trading aims to capture short- to medium-term price swings, typically lasting from a few days to a few weeks. Swing traders operate within broader trends but focus on smaller price movements inside those trends.
The objective is to profit from oscillations, not entire long-term trends.
How Swing Traders Generate Profits
Swing traders earn profits by:
1️⃣ Capturing Retracements and Bounces
Markets rarely move in straight lines. Even in strong uptrends, prices pull back temporarily.
Swing traders buy dips and sell at the next bounce.
Example:
If a stock in an uptrend dips from ₹500 to ₹470 and you buy at ₹470, a bounce to ₹495–₹505 can yield quick profits.
2️⃣ Using Technical Indicators
Swing traders rely heavily on tools like:
Support and resistance zones
Trendlines
Moving Averages (20, 50, 200 EMA)
RSI, MACD, Stochastics
Fibonacci retracement
These indicators help identify high-probability reversal or breakout zones.
3️⃣ Breakout and Breakdown Profits
Swing traders also profit from:
Breakout trades (price crossing resistance)
Breakdown trades (price falling below support)
These movements often lead to rapid price expansion.
4️⃣ Utilizing Momentum
Short-term bursts of momentum—caused by news, earnings, or sector strength—give traders opportunities to capture small but repeated gains.
Profit Characteristics in Swing Trading
🔹 Moderate Profit per Trade
Typical swing trades aim for 3% to 10% per trade depending on volatility.
However, multiple trades per month allow cumulative compounding.
🔹 High Trade Frequency
Most swing traders execute 8–20 trades per month, increasing profit potential.
🔹 Risk and Stop-Loss
Swing trading does involve higher noise and volatility.
SLs are usually small (1.5%–4%), making risk manageable.
🔹 Importance of Timing
Since swings are short-lived, profits depend on:
Entering early at the reversal point
Exiting before momentum fades
A delay of 1–2 days can reduce profitability drastically.
Advantages of Swing Trading for Profit Generation
Faster capital rotation → More opportunities
Lower overnight risk than positional trading
Ideal for volatile markets
Works well with technical analysis
Smaller stop-losses increase risk–reward ratios
When Swing Trading Produces Maximum Profits
Swing trading gives the best results when:
The market is range-bound
The index is consolidating
Stocks move between support and resistance levels
Weekly volatility is strong
During choppy phases, positional trades may get stopped out, but swing traders can profit multiple times in both upward and downward moves.
2. Understanding Positional Trading Profits
What is Positional Trading?
Positional trading is a longer-term approach, where traders hold positions for:
Weeks
Months
Sometimes even a year
Positional traders focus on capturing large directional movements driven by fundamentals, macro trends, sector rotation, or long-term chart patterns.
How Positional Traders Generate Profits
1️⃣ Capturing Major Trends
Instead of small fluctuations, positional traders aim for big moves, often 20%–100% or more.
They enter after confirming a strong trend on:
Weekly charts
Monthly charts
Long-term support breaks or retests
2️⃣ Using Broad Technical and Fundamental Analysis
While swing traders usually rely almost exclusively on charts, positional traders combine:
Fundamental strength (earnings, balance sheet, order book)
Sector analysis
Macro triggers
Long-term chart patterns such as:
Cup and handle
Head and shoulders
Ascending triangles
Bullish or bearish channels
3️⃣ Riding the Trend with Patience
Profits compound over time because:
Stocks need time to form trends
Institutional accumulation happens slowly
Breakouts on weekly/monthly charts have strong follow-through
4️⃣ Limited Trading, Larger Profits
Positional traders may take only 2–6 trades per month, but each has higher profit potential.
5️⃣ Hedging to Protect Capital
Some positional traders hedge using:
Index options
Sector futures
Protective puts
This reduces risk and smoothens long-term profit curves.
Profit Characteristics in Positional Trading
🔹 Larger Profit per Trade
Returns per trade are much higher than swing trading:
20% to 200% depending on the trend
Ideal for wealth building
🔹 Lower Trade Frequency
Because trades are fewer, profits depend heavily on selecting the right stocks.
🔹 Bigger Stop-Loss Levels
Weekly charts require larger SLs—5% to 12% typically—but the reward is much bigger.
🔹 Less Stress
Since traders don’t monitor minute-to-minute fluctuations, positional trading is psychologically easier.
Advantages of Positional Trading for Profit Generation
Compounds capital significantly
Lower slippage and transaction costs
Less screen time required
Captures major market cycles
Ideal when markets are trending strongly
When Positional Trading Produces Maximum Profits
Positional trading performs best during:
Bull runs
Strong sector rotations
Clear upward or downward long-term trends
Major breakouts on weekly/monthly charts
During such phases, swing traders might book profits too early, while positional traders capture the entire move.
Swing vs Positional Trading — Profit Comparison
Feature Swing Trading Positional Trading
Trade Duration Days to weeks Weeks to months
Profit Per Trade 3%–10% 20%–200%
Frequency High Low
Risk Moderate Higher overnight risk
Stop-Loss Small Large
Best Market Condition Range-bound Trending
Capital Rotation Fast Slow
Stress Level Medium Low
Which Style Is Best for You?
Choose Swing Trading if you:
✔ Can monitor markets daily
✔ Prefer faster returns
✔ Are comfortable with technical analysis
✔ Like frequent trading opportunities
Choose Positional Trading if you:
✔ Have a full-time job or limited screen time
✔ Prefer long-term trend riding
✔ Have larger capital
✔ Value stability over frequent trades
Conclusion
Both swing trading and positional trading can be highly profitable—but only when matched with the right trader personality and market conditions. Swing trading provides rapid, repeated gains through short-term price swings, ideal for volatile or sideways markets. Positional trading, on the other hand, aims for larger, long-term profits by capturing major trends and market cycles.
A successful trader often combines both approaches: swing trading during consolidations and positional trading during strong trends. The key lies in disciplined execution, chart analysis, risk management, and adapting strategies as the market evolves.

Open Interest Analysis1. What is Open Interest?
Open Interest refers to the total number of outstanding or open contracts (futures or options) that currently exist in the market. These contracts have not been squared off, exercised, or expired. Unlike volume— which counts total traded contracts for a given session—OI tells you how many active contracts remain open at the end of the trading day.
You can think of OI as the number of "open commitments" between buyers and sellers.
If two parties create a new contract, OI increases by 1.
If they exit or square off, OI decreases by 1.
If contracts are transferred between traders (one enters, one exits), OI remains the same.
This makes OI a direct indicator of market participation and trader conviction.
2. Difference Between Volume and Open Interest
Aspect Volume Open Interest (OI)
Measures Number of contracts traded in a day Total active contracts still open
Reset Reset daily Carry forward until expiry
Shows Activity level for that session Market participation and trend strength
Use Short-term momentum Trend confirmation and sentiment
Both volume and OI together provide a powerful market outlook.
3. How Open Interest is Created and Destroyed
OI Increases When:
A new buyer and a new seller enter the market.
New long and short positions are created.
OI Decreases When:
A buyer and seller close their existing positions.
Squaring off reduces outstanding contracts.
OI Remains Unchanged When:
One trader exits and another takes over the position.
Understanding these mechanics helps traders interpret market signals accurately.
4. Interpreting Open Interest with Price Action
The true power of OI comes when you combine it with price movement. OI alone is not actionable—its interpretation depends heavily on price behavior.
Below are the four essential combinations used in OI analysis:
A. Price Up + OI Up → Fresh Long Build-up (Bullish)
This means traders are entering new long (buy) positions. It shows confidence in upward momentum.
Interpretation:
Strong bullish trend
Buyers aggressively participating
Trend likely to continue
Used for: Swing trades, trend-following trades, and breakout confirmation.
B. Price Down + OI Up → Fresh Short Build-up (Bearish)
When the price falls and OI increases, it signals new short positions being created.
Interpretation:
Strong bearish sentiment
Traders expect further price decline
Downtrend gaining strength
Used for: Short selling strategies, bearish breakouts, continuation trades.
C. Price Up + OI Down → Short Covering (Bullish but Temporary)
As shorts exit their positions, OI declines, leading to a temporary upward price move.
Interpretation:
Rally driven by short covering—not fresh longs
Trend may not sustain
Usually seen before resistance breakouts or reversals
Used for: Intraday trades, profit booking zones, cautious buying.
D. Price Down + OI Down → Long Liquidation (Bearish but Temporary)
Longs square off their positions, reducing OI and causing price to fall.
Interpretation:
Weakness in bullish sentiment
Not necessarily aggressive bearishness
Might lead to consolidation or reversal
Used for: Stop-loss resets, exit signals for long positions.
5. Open Interest in Options Trading
Options (Calls and Puts) provide even deeper insights into market psychology.
Key Concepts:
Call OI shows resistance zones.
Put OI shows support zones.
Change in OI shows if traders are adding or unwinding positions.
A. High Call OI → Resistance Zone
Large Call OI means sellers are confident that price will not exceed that level.
Example: Bank Nifty 48000 CE highest OI = strong resistance.
B. High Put OI → Support Zone
Put writers believe price will not fall below this level.
Example: Nifty 21500 PE highest OI = strong support.
C. PCR (Put–Call Ratio)
PCR = Total Put OI / Total Call OI
This helps measure market sentiment.
PCR > 1 → Bullish (more Put writing)
PCR < 1 → Bearish (more Call writing)
Extreme readings indicate reversals
6. Open Interest and Market Structure
OI acts as a backbone for understanding the structure of trends.
1. In a Strong Uptrend:
Price makes higher highs
OI increasing
More long positions accumulating
2. In a Strong Downtrend:
Price making lower lows
OI rising steadily
Shorts dominating
3. During Consolidation:
Price range-bound
OI rises (indicating buildup for breakout)
Option writers dominate (call & put both increase)
4. During Reversal Signals:
Price moves opposite of OI direction
Divergences form
Indicates weakening trend
7. Open Interest in Futures
For futures traders, OI helps identify:
Trend strength
Reversal chances
Institutional participation
Liquidity zones
Breakout reliability
Futures OI Build-up Types:
Long Build-up
Short Build-up
Long Unwinding
Short Covering
Each type gives a specific trading opportunity.
8. How Institutions Use Open Interest
Smart money (FIIs, prop desks, institutions) uses OI to:
Hedge large portfolios
Accumulate positions silently
Trap retail traders in false breakouts
Control liquidity and volatility
Institutions track OI changes to understand where retail traders are vulnerable.
Example:
If huge Call writing appears before a breakout, it may be a trap to absorb liquidity before moving higher.
9. Open Interest as a Risk Management Tool
OI not only helps predict trends but also helps manage risk:
Avoids trading in low OI contracts (illiquid)
Helps identify expiry-week volatility
Shows where stop-hunts may happen
Indicates where option sellers are positioned
High OI zones act as magnets for price due to hedging flows.
10. How to Use OI for Better Trading Decisions
Step-by-Step Approach:
Look at price trend (up/down/sideways).
Check OI change (increasing/decreasing).
Identify build-up type (long/short/unwinding/covering).
Mark support and resistance using option OI.
Check PCR for sentiment direction.
Use volume + OI + price for confirmation.
Place trades near OI cluster levels for best risk–reward.
11. Limitations of OI Analysis
While OI is powerful, it has limitations:
Does not show whether buyers or sellers are stronger
Can give false signals during low liquidity
Options OI can create misleading levels before expiry
Sudden changes may be due to hedge adjustments, not trend
News-driven markets can invalidate OI-based setups
Therefore, combine OI with price action, volume, and market structure.
12. Conclusion
Open Interest analysis is an essential tool for understanding the psychology and commitment of market participants. By combining OI with price and volume, traders can identify trend strength, potential reversals, support and resistance zones, and institutional activity. Whether analyzing futures or options, OI serves as a reliable indicator for planning trades with precision. While it has limitations, when used with proper risk management and complementary tools, OI analysis significantly enhances trading accuracy and confidence.
Thematic Trading Strategies1. What Is Thematic Trading?
Thematic trading is an approach that identifies and invests in powerful macro trends (“themes”) rather than individual stocks in isolation. These themes may include:
Artificial intelligence and automation
Clean energy and sustainability
Electric vehicles (EVs)
Digital transformation
Cybersecurity
Space exploration
Biotechnology advancements
Shifting demographics (aging populations, rising middle class)
Geopolitical realignments
Consumption trends (premiumisation, digital retail)
Instead of selecting stocks purely based on historical performance, thematic traders focus on where the world is heading, and then choose assets that are positioned to benefit from that direction.
2. Why Thematic Trading Is Growing Rapidly
Several structural reasons explain its rising popularity:
a) Long-Term Visibility
Mega trends like renewable energy adoption or AI penetration unfold over decades, providing a clearer long-term direction compared to cyclical sectors.
b) Innovation-Driven Growth
Technological disruptions create exponential opportunities. Companies aligned with these innovations often deliver outsized returns.
c) Investors Want Purpose-Driven Portfolios
Thematic portfolios allow investors to align their investments with personal beliefs—such as sustainability, robotics, or healthcare advancement.
d) Easier Access Through ETFs & Basket Products
Dozens of thematic ETFs now offer exposure to specific trends, making participation easier.
3. Core Elements of a Thematic Trading Strategy
To build a strong thematic strategy, traders analyze three dimensions: the trend, the beneficiaries, and the timing.
a) Identifying the Theme
A strong theme usually has:
Long-term structural drivers
Global policy support (like green energy subsidies)
Strong demand-side and supply-side catalysts
Early or mid-stage development (not fully priced in)
b) Theme Validation
For validation, traders study:
Growth forecasts
Industry adoption rates
Scientific or technological feasibility
Capital inflows into the sector
Market size expansion
Regulatory environment
c) Mapping the Value Chain
Once the theme is established, traders look at the value chain:
For example, in Electric Vehicles:
Battery manufacturers
Lithium/cobalt miners
EV OEMs
Charging infrastructure providers
Software and sensor companies
Understanding the value chain helps discover early movers and high-growth segments.
d) Selecting Instruments
Thematic trading can be executed using:
Individual stocks
ETFs & sector baskets
Index futures
Options (for leverage & hedging)
Commodity plays related to the theme
Global stocks or ADRs
4. Types of Thematic Trading Strategies
**1. Technological Themes
These are the most widely followed themes today, due to rapid digital transformation.
Key examples:
Artificial Intelligence
Machine Learning & Automation
Robotics
Cybersecurity
Cloud computing
FinTech & digital payments
Why attractive?
Tech themes offer exponential growth potential as adoption scales globally.
2. Sustainability & Clean Energy Themes
Driven by global climate commitments and government incentives:
Solar and wind energy
Hydrogen fuel economy
Electric vehicles
Waste management & recycling
Water purification
Green metals (lithium, copper, nickel)
Why attractive?
Clean energy is expected to dominate global energy transition, providing decades of investment opportunity.
3. Healthcare & Biotechnology Themes
These include:
mRNA technology
Genomics & DNA sequencing
Precision medicine
AI-driven medical diagnostics
Senior care & aging population industries
Why attractive?
Healthcare demand grows steadily with demographic shifts and breakthroughs.
4. Demographic Themes
These focus on changes in population structures:
Rising middle class in Asia
Aging populations in Japan, Europe
Urbanization in developing economies
Millennial and Gen Z consumption patterns
Why attractive?
Demographic shifts drive predictable long-term market behavior.
5. Geopolitical & Macro Themes
These arise due to global realignments:
Defence and aerospace sector uptrend
Commodity supercycles
Reshoring of manufacturing
Supply-chain diversification
Currency realignments
Why attractive?
These themes often have strong policy and budgetary backing.
6. Consumer Behavior Themes
Based on changing lifestyles:
Digital commerce boom
Subscription economy
Luxury consumption growth
Health & wellness industry
Travel and experiential spending
Why attractive?
Consumer preferences shape long-lasting corporate winners.
5. How To Build a Thematic Portfolio
A systematic approach ensures risk-managed exposure.
Step 1: Define the Theme
Example: "AI adoption in enterprise workflows"
Step 2: Evaluate Theme Drivers
Corporate AI spending
Cloud migration
Data infrastructure growth
Step 3: Map the Value Chain
Semiconductors
Data centers
Software & AI service providers
Hardware companies
Step 4: Select Stocks or ETFs
Choose leaders + emerging disruptors.
Step 5: Portfolio Allocation
Balance between:
High-growth stocks
Value chain diversification
Geographical spread
Step 6: Risk Management
Stop-loss
Portfolio rebalancing
Diversification across themes
6. Benefits of Thematic Trading
a) High Growth Potential
Themes like AI and clean energy can outperform traditional sectors.
b) Long-Term Visibility
Themes often remain relevant for years, reducing dependency on short-term volatility.
c) Innovation Exposure
Provides access to cutting-edge technologies before mainstream adoption.
d) Easier Diversification
ETFs offer broader exposure with fewer stock-specific risks.
7. Risks in Thematic Trading
a) Overhype Risk
Trends can become overpriced quickly due to speculative demand.
b) Technological Uncertainty
Some innovations fail to reach commercial viability.
c) Regulatory Risks
Government rule changes can impact themes like crypto or clean energy.
d) Concentration Risk
Too much focus on a single theme reduces diversification.
e) Timing Risk
Entering a theme at its peak can lead to long drawdowns.
8. Examples of Popular Thematic Trades
AI Boom (2023–2025)
Benefited:
Chipmakers
Cloud platforms
AI software companies
EV and Battery Metals Surge
Lithium and copper saw explosive demand.
Cybersecurity Uptick
Driven by ransomware growth and global cyber threats.
Green Energy Push
Solar, hydrogen, and EV charging firms gained substantial traction.
9. Best Practices for Thematic Traders
Study multi-year macro reports
Focus on value chain leaders
Avoid hype-driven buying
Diversify across multiple themes
Use ETFs when unsure about specific stocks
Regularly review theme performance
Balance high-risk innovation stocks with stable players
Conclusion
Thematic trading strategies provide a powerful framework for capturing long-term transformative trends shaping global markets. By focusing on structural changes—technological, economic, environmental, or demographic—traders can design portfolios that benefit from multi-year compounding growth. While thematic trading offers enormous potential, it also requires disciplined research, smart diversification, and timing awareness.
When done correctly, thematic trading not only provides strong returns but also aligns investments with the future direction of global progress.

Price hits FVG: Get ready for Market Maker's next move!In the current market context, the price structure is clearly showing the regulation of Smart Money as it continuously creates new liquidity zones, breaks structures, and leaves important footprints like OB – FVG – BOS. Below is a trading plan built based on the observed price zones on the chart:
🟥 1. Market Context – Role of OB Sell
Price has reacted strongly at the Order Block Sell in the 4,237 – 4,256 zone.
This is where a strong push down occurred (accompanied by a structure break – BOS), confirming this as an active supply zone.
➡️ This will be the key level to monitor all pullbacks in the coming time.
🟩 2. Current Market Structure – Market Structure
After the OB Sell is activated, the market creates a bearish BOS.
Price is moving down to approach the Liquidity Buy below in the 4,154 – 4,161 zone.
On the way, price leaves a Fair Value Gap (FVG) – a zone that can be used as a retracement point to continue selling.
➡️ Overall bias: Bearish intraday – favor sell on pullback.
🟨 3. Main Trading Plan – SELL SETUP
🎯 Area of Interest
FVG: 4,197 – 4,214
This is the ideal price zone for price to return to balance before continuing the downtrend.
📌 Entry SELL:
Preferred scenario: Price retraces to fill FVG → reacts → creates a small bearish structure (BOS M1–M5) → Sell.
🎯 Targets:
TP1: 4,170 — intermediate support zone
TP2: Liquidity Buy: 4,154 – 4,161
TP3 (extended): 4,144 if liquidity below continues to be swept
🛑 Stop Loss:
Above the FVG peak or above the nearest OB zone: 4,214 – 4,227
➡️ High probability when price fails to break 4,214–4,227 and continues to create lower highs.
🟦 4. Secondary Scenario – SHORT-TERM BUY (Countertrend)
Only activated when price hits Liquidity Buy and a clear reversal signal appears:
📌 Entry BUY:
After sweeping liquidity in the 4,154–4,161 zone
Wait for bullish BOS confirmation on a lower timeframe
🎯 Targets:
4,184
4,197
4,214 (maximum – hit FVG and exit)
➡️ This is just a retracement trade, not trend-following, so risk management is crucial.
⭐ 5. Summary View
The market is moving in line with Smart Money behavior:
Sweep liquidity above (Sell-side Liquidity) → Create OB → Push price down
Leave FVG → Attract price back → Continue distribution
Main goal: Sweep Liquidity below
👉 The main trend remains SELL until the Liquidity Buy below is hit and a strong reversal structure is created.

XAU/USD – Gold Retests Bullish OB, Preparing for a Major Recover📊 Market Structure
After the Liquidity Sweep around the 4,26x highs, Gold shifted into a short-term distribution phase and formed a series of bearish ChoCHs.
However, the entire current decline remains a corrective move, as price is now approaching the Bullish Order Block at 4,155 – 4,158 USD, which is also the primary support of the prevailing trend.
The ascending trendline has not been fully broken → buyers still have structure support.
The main scenario: price may continue sweeping deeper into the Bullish OB, or even tag the Deep OB at 4,129 – 4,130 USD, before initiating a strong bullish recovery.
💎 Key Technical Zones
Bullish OB: 4,155 – 4,158 USD → primary BUY zone
Deep OB: 4,129 – 4,130 USD → safer BUY zone (deep retest)
Bearish OB: 4,211 – 4,213 USD → short-term SELL reaction
Liquidity Above: 4,239 – 4,240 USD
🎯 Trading Plan – Two Clear Scenarios
1️⃣ BUY Setup – Trend-Following Priority
When price taps the Bullish OB 4,155 – 4,158 and prints a clear rejection candle:
Entry: 4,155 – 4,158
SL: 4,128
TP1: 4,188
TP2: 4,211
TP3: 4,239
TP4: 4,260+
→ A trend-aligned setup: low risk – high reward.
→ If price does not react at the Bullish OB, wait for a deeper BUY at the Deep OB (safer).
2️⃣ SELL Scalp – For Intraday Traders Only
If price retraces into the Bearish OB 4,211 – 4,213 and shows rejection:
Entry: 4,211 – 4,213
SL: 4,225
Short TP: 4,188 → 4,175
→ This is only a reaction play. Do NOT hold long-term since the main trend remains bullish.
🧠 Vincent’s View
Gold is likely in its final corrective phase before starting a new bullish leg.
As long as 4,129 remains intact, buyers maintain full control.
Smart money is likely accumulating around the Bullish OB before pushing price back toward 4,239 – 4,260.
⚡ “Smart money always returns to where strength began — buy where the market was born.”
⏰ Timeframe: H1
📅 Updated: 04/12/2025
✍️ Analysis by: Captain Vincent

The Modern Market Explosion: Dynamics, Drivers, and Implications1. Technological Revolution as a Catalyst
At the heart of the modern market explosion lies the technological revolution. Advancements in computing power, cloud technologies, artificial intelligence (AI), blockchain, and high-frequency trading have reshaped how markets operate. Trading that once took hours or days can now occur in milliseconds, allowing for near-instantaneous execution of orders. Automated trading algorithms can respond to micro-movements in the market, amplifying both liquidity and volatility.
The rise of fintech platforms has democratized access to markets, allowing retail investors to participate in arenas that were once dominated by institutional players. Mobile trading apps, digital wallets, and online brokerage platforms have exponentially increased the volume of participants in stock, cryptocurrency, and derivatives markets. This surge in participation has not only inflated trading volumes but has also created price swings driven by social sentiment, speculation, and viral trends—phenomena particularly visible in meme stocks and digital asset markets.
2. Globalization and Interconnected Markets
Globalization has intensified market interdependence. Modern markets are no longer isolated; a major economic event in one country reverberates across the world in real-time. Supply chain disruptions in East Asia, geopolitical conflicts in Europe, or policy shifts in the United States can instantaneously affect stock indices, commodity prices, and currency valuations across multiple continents.
Emerging markets have become key drivers of this explosive growth. Economies in Asia, Africa, and Latin America, leveraging technology and international trade, are attracting massive foreign investments. Capital flows across borders are faster and larger than ever, contributing to dynamic asset reallocation and, occasionally, market bubbles. Globalization has also intensified competition, forcing companies to innovate rapidly and adopt digital solutions to remain relevant, further energizing sectors like technology, e-commerce, and renewable energy.
3. Investor Psychology and Behavioral Shifts
The modern market explosion is heavily influenced by investor psychology. Behavioral finance has highlighted that markets are not purely rational; human emotions, herd behavior, and cognitive biases play critical roles. Social media platforms, online forums, and news aggregators amplify information and, in some cases, misinformation. Platforms like Reddit, Twitter, and Telegram have empowered collective action among retail investors, creating sudden surges in trading activity and price volatility.
This phenomenon has been vividly observed in meme stocks, cryptocurrencies, and trending tech shares. Fear of missing out (FOMO), speculative mania, and rapid shifts in sentiment contribute to market explosions, often decoupling asset prices from traditional valuation metrics. The combination of retail-driven momentum and institutional responses forms a feedback loop that accelerates price movements, creating both opportunities and risks.
4. Monetary Policies and Liquidity Surges
Central banks worldwide have played a significant role in the explosive growth of modern markets. In response to financial crises, pandemics, and recessions, central banks have implemented unprecedented monetary interventions, including near-zero interest rates, quantitative easing, and direct market support. These policies have flooded global markets with liquidity, encouraging borrowing, investment, and risk-taking.
High liquidity environments often push investors toward higher-yielding assets such as equities, real estate, and alternative investments, inflating prices. This influx of capital has amplified market bubbles, accelerated technological sector valuations, and supported the rapid rise of digital assets. However, this liquidity-driven expansion is fragile, sensitive to interest rate adjustments, inflationary pressures, and geopolitical uncertainties, making modern markets highly reactive to policy signals.
5. Sectoral Shifts and Innovation Drivers
Certain sectors have emerged as key drivers of the modern market explosion. Technology, artificial intelligence, biotechnology, renewable energy, and electric vehicles are attracting enormous capital inflows due to their disruptive potential. Startups in these sectors are achieving valuations in record times, often reaching “unicorn” status within a few years of founding.
Digital transformation across traditional industries—finance, healthcare, logistics, and manufacturing—has also created new market opportunities. Cloud computing, data analytics, Internet of Things (IoT), and AI-driven automation have increased productivity and generated investor optimism. These sectors often experience rapid price appreciation as innovation expectations sometimes outpace earnings, further contributing to market acceleration and speculative excitement.
6. Cryptocurrency and Decentralized Finance (DeFi)
Cryptocurrencies and decentralized finance platforms have added a new dimension to the modern market explosion. Blockchain technology enables digital assets to exist outside traditional banking systems, creating entirely new marketplaces for investment and exchange. Bitcoin, Ethereum, and other cryptocurrencies have experienced explosive growth, driven by both institutional adoption and retail enthusiasm.
DeFi platforms allow peer-to-peer lending, borrowing, and trading without intermediaries, challenging traditional financial systems. These innovations have increased market accessibility, liquidity, and speculative potential, creating a high-risk, high-reward environment. Cryptocurrencies also respond to global macroeconomic trends, regulatory developments, and social media-driven hype, contributing to sudden market surges and declines.
7. Risks, Volatility, and Market Sustainability
While the modern market explosion presents enormous opportunities, it is accompanied by heightened risks. Volatility has intensified, with sudden price swings becoming commonplace. The interconnected nature of global markets means that crises can propagate rapidly, as seen during events like the 2008 financial crisis and the COVID-19 pandemic.
Overvaluation of certain sectors, speculative bubbles, geopolitical tensions, cyber threats, and policy missteps are persistent risks. Investors must balance the allure of rapid gains with disciplined risk management. Market regulation, transparency, and investor education remain critical to sustaining long-term growth while mitigating systemic risks.
8. Implications for Businesses, Investors, and Society
The explosion of modern markets has broad implications beyond finance. Businesses face pressure to innovate, scale quickly, and adopt digital solutions. Investors encounter both unprecedented opportunities and challenges in portfolio diversification, risk management, and information analysis. Society, in turn, experiences economic benefits through job creation, technological advancement, and increased access to capital, but also faces risks related to inequality, market speculation, and financial instability.
Financial literacy and technological understanding have become essential for navigating the modern market. Stakeholders who leverage data analytics, AI tools, and global market intelligence gain a strategic advantage, while those who fail to adapt risk being left behind.
9. Conclusion
The modern market explosion is a multifaceted phenomenon driven by technology, globalization, investor behavior, policy interventions, and sectoral innovation. It is characterized by rapid growth, high liquidity, speculative surges, and heightened volatility. While it offers remarkable opportunities for wealth creation, entrepreneurship, and global economic integration, it also demands sophisticated risk management, regulatory oversight, and informed participation.
Understanding the interplay between technology, capital flows, investor psychology, and policy dynamics is crucial for anyone seeking to navigate these markets successfully. The modern market is not merely expanding; it is accelerating, transforming, and redefining the global economic landscape at an unprecedented pace. Investors, businesses, and policymakers must embrace agility, knowledge, and strategic foresight to harness its potential while mitigating its inherent risks.
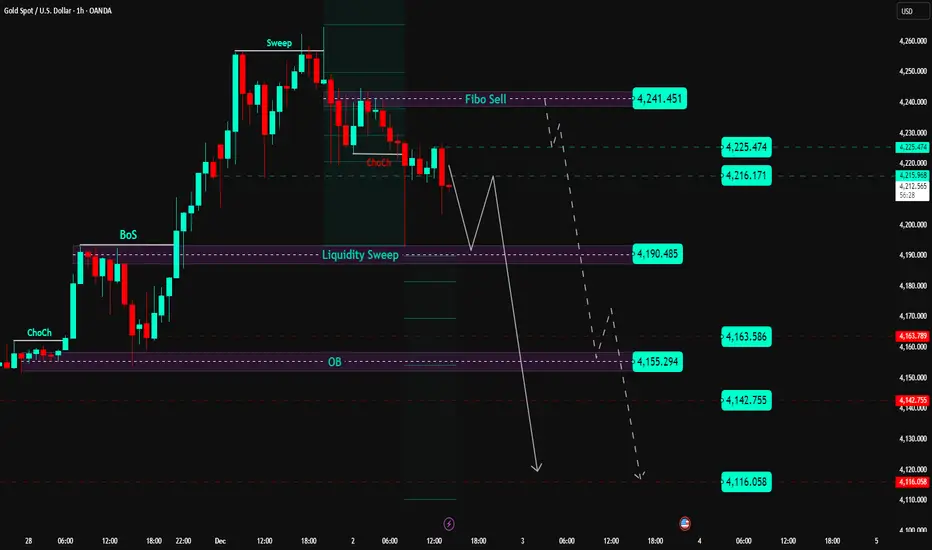
XAU/USD: Peak Sweep Done, Price Distributing in Premium📊 Market Structure
• After a strong bullish leg, Gold formed a clear Liquidity Sweep at the highs around 4,261 USD (Fibo Sell) , taking out all liquidity above that zone.
• From that high, price gradually weakened and printed a bearish ChoCH (loss of buying pressure; short-term structure no longer clean).
• Price is currently trading inside the premium zone between 4,190 – 4,241:
– 4,241 = Fibo Sell / liquidity extreme .
– 4,225 – 4,216 = lower premium zone , likely to react before retesting the highs.
– 4,190 = Liquidity Sweep + short-term support : only if price breaks below and retests from underneath will this zone flip into resistance for SELL continuation.
⇒ Current picture: short-term bearish bias , but sells should come from the premium zones (4,216–4,241) or only after a confirmed break of 4,190 — avoid chasing mid-range.
💎 Key Technical Zones
• Fibo Sell Zone: around 4,241.451 → optimal extreme for hunting SELL setups.
• Reaction Levels:
– 4,225.474
– 4,216.171
• Liquidity Sweep Support: 4,190.485 → main short-term support.
• Support / TP Zones:
– 4,163.586
– 4,155.294 (old OB)
– 4,142.755
– 4,116.058 (deeper low – extended target)
🎯 Trading Plan – SELL Priority From Premium
1️⃣ Primary SELL – Fibo Sell 4,241 & Premium 4,225–4,232
Ideal scenario: price retraces into the upper premium zone and prints a clear rejection signal (pin bar / engulfing / rejection volume).
• Entry 1: 4,225 – 4,232 (first scale-in)
• Entry 2: 4,235 – 4,241 (add if price sweeps higher)
• Stop Loss: above 4,250
• TP1: 4,190
• TP2: 4,163
• TP3: 4,155
• TP4: 4,142
• TP5: 4,116
→ Classic “sell the premium” setup: wait for price to return to the swept highs — avoid FOMO in the middle.
2️⃣ SELL Continuation – After Breaking 4,190
Only valid if we get a clear H1 close below 4,190 , confirming the Liquidity Sweep zone has been violated and flipped into resistance.
• Condition: H1 close below 4,190 → wait for a retest of 4,190–4,195 from underneath
• Entry: 4,190 – 4,195
• SL: above 4,205
• TP1: 4,163
• TP2: 4,155
• TP3: 4,142
• TP4: 4,116
→ This setup is only for traders who prefer clean continuation after a confirmed break of support.
3️⃣ Countertrend BUY – Only From Deep Zones
• Aggressive: watch for reactions at 4,163 – 4,155 . If strong rejection appears, consider a technical BUY retracement toward 4,190 – 4,216 (scalp).
• Conservative: wait for a deep test of 4,116 (stronger demand zone) before searching for BUY setups.
→ This is strictly countertrend; only take it if strong confirmation appears. Otherwise, skip and focus on SELL opportunities in premium zones.
🧠 Vincent’s View
Gold is currently “hanging” within premium after a very clean top sweep.
The safest strategy is to let price return to 4,225–4,241 before selling, or wait for a confirmed break of 4,190 to play continuation. Avoid selling directly at 4,190 while it still acts as support.
“Sell the premium, respect the levels – liquidity never lies.” ⚜️
⏰ Timeframe: 1H
📅 Updated: 02/12/2025
✍️ Analysis by: Captain Vincent