BTC/USD: Rebound from 2026 Lows – Path to $100K Re-Accumulation?Based on the detailed technical analysis: Bitcoin is showing signs of life after a sharp weekend flush that saw prices hit a fresh 2026 low near $74,500. My current analysis highlights a potential structural shift as we defend critical support levels and look to reclaim mid-range liquidity.
The Technical Setup:
Support Defense: We have successfully held the $74,000 - $75,000 zone. This level has proven pivotal, acting as a base for the current relief rally.
Immediate Resistance: The first major hurdle is the $78,500 - $79,200 supply zone (gray box). A clean breakout and retest of this level as support is essential to confirm a shift in momentum.
Secondary Target: Once above $80k, I am eyeing a move toward the $90,000 psychological barrier. This was a heavy rejection point in January and will likely act as a major profit-taking zone.
The Strategy: I am anticipating a zig-zag recovery pattern. The goal is to see a series of higher highs and higher lows:
A push through $79k, followed by a shallow retracement to confirm the floor.
A secondary impulsive leg toward $90k.
Consolidation before a final push toward the $100,000 target by late Q1/early Q2.
Risk Management: While the "whale" accumulation at these discounts is encouraging, the overall trend remains heavy. A daily close below $74,000 would invalidate this bullish path and likely lead to a deeper correction toward the $72k liquidity pool.
Note: This is for educational purposes only. Market conditions are highly volatile; always manage your risk and stick to your plan.
Tradingstrategy

Difference btw Beginner, Pro and Full time Traders ( Mtfa view )In this Big 20 minutes video, I will try to explain the most beautfull conept of Multi time frame analysis from the perspective of 4 different types of trader .
Charts used are older than 3 months

Trading view, Mountains, Back testing strategy & New yearHappy new year to the Trading view Family, Wishing everyone a strong Year Ahead and in green .
Keep back testing and learning .

Mastering Breakouts, Patterns, Fair Value Gaps and Risk RatiosLearn how to spot breakout patterns, leverage fair value gaps, and enter trades with smart risk management for consistent swing trading success
Charts used are older than 3 months

Order Blocks Simplified — How Institutions Control Price🔥 Order Blocks Simplified — How Institutions Control Price
Order Blocks are one of the most important concepts in modern trading — because they show where institutions place REAL positions, not where retail traders guess. 🏦📊
When you understand Order Blocks, you stop chasing random candles and start reading the footprints of smart money. Let’s simplify it. 👇✨
📌 What Is an Order Block? 🧱💰
An Order Block (OB) is a price zone where big institutions (banks, hedge funds, market makers) place massive orders.
These zones often appear before strong market moves — because that’s where smart money builds positions.
Think of an Order Block as:
🔹 The origin of a powerful move
🔹 A zone where price reacts repeatedly
🔹 A region that creates imbalance and momentum
🔹 A point where institutional orders remain unfilled
Once price returns to that zone, institutions fill the rest of their orders, causing another strong reaction. ⚡📈📉
📌 Why Do Order Blocks Matter? 🧠🔥
Because institutions control 80%+ of market volume — not retail.
So when they accumulate or distribute positions:
📈 Trends are born
📉 Reversals appear
🌊 Momentum shifts
💥 Big candles print
Order Blocks give you insight into:
✔️ Where big players enter
✔️ Where real support/resistance exists
✔️ Why price reverses at specific zones
✔️ Where high-probability trades form
It’s the closest thing to tracking the “big money blueprint.”
📌 How Order Blocks Form 🛠️📊
Order Blocks are created during periods of:
🔸 Accumulation (smart money buys quietly)
🔸 Distribution (smart money sells quietly)
Then price explodes away from that zone, showing that a major order cluster was executed.
This explosive move creates:
🔥 Imbalance (FVG)
🔥 Break of structure (BOS)
🔥 A directional trend
These are all signs of institutional activity.
📌 Types of Order Blocks 🟥🟩
🟥 Bearish Order Block (B-OB)
The last bullish candle before a strong bearish move.
It marks institutional selling.
🟩 Bullish Order Block (B-OB)
The last bearish candle before a strong bullish move.
It marks institutional buying.
Both act as high-probability reaction zones.
📌 How Institutions Use Order Blocks 🎯🏦
Institutions don’t enter all at once — their orders are too large.
So they:
1️⃣ Place part of their order
2️⃣ Push price away
3️⃣ Wait for retracement
4️⃣ Fill the rest at the same zone
That zone = the Order Block.
Price returning to an OB is not random — it’s smart money completing their business. 💼✨
📌 How You Trade Order Blocks 🧘♂️📈
✔️ Identify the strong move
Big displacement = institutional interest. 🚀
✔️ Mark the Order Block candle
The last opposite candle before the move. 🔍
✔️ Wait for price to return
Smart money loves to rebalance orders. 🔁
✔️ Enter with confirmation
Candles + structure + reaction = high probability. 🎯
Order Blocks are not predictions — they are reaction zones with a smart-money edge.
📌 Why Order Blocks Work So Well 🌟
Because they are built on:
💧 Liquidity
🧠 Smart Money Behavior
📊 Market Structure
⚡ Supply & Demand
🔥 Institutional Order Flow
This is why OBs outperform classic support/resistance.
They show institutional reality, not retail imagination.
✨ Final Thoughts: The Power of Order Blocks 🚀
Once you learn Order Blocks, everything becomes clearer:
✔️ You know where big money enters
✔️ You know where to wait for price
✔️ You stop chasing bad trades
✔️ You trade WITH smart money
✔️ You catch cleaner, stronger moves
Order Blocks are the foundation of modern price action — simple, powerful, and deeply effective. 🔥📈
Emotional Discipline and Risk Control in Trading🧠 1. Why Emotional Discipline Matters
Emotional discipline means sticking to your plan regardless of fear or greed.
Markets are designed to test your patience, confidence, and decision-making. Every losing trade tempts you to change your system — but consistency wins.
✅ Key habits of emotionally disciplined traders:
They accept losses without revenge trading.
They follow rules, not impulses.
They manage expectations — no trade will make them rich overnight.
💰 2. Risk Control — Protect Before You Profit
Your risk management defines your survival. Successful traders think in probabilities, not certainties. They never risk too much on one idea.
📏 Golden Rules of Risk Control:
Risk 1–2% of your capital per trade.
Always use a stop-loss, never a “mental” one.
Define your R:R ratio (minimum 1:2 or better).
Never add to a losing position — only to confirmed winners.
Risk control is not about avoiding losses — it’s about limiting damage and staying consistent over time.
🧩 3. How to Strengthen Emotional Discipline
Like a muscle, discipline grows with routine. Try this daily:
Pre-trade routine – review your plan before every session.
Post-trade journal – log your emotions, not just results.
Take breaks – emotional fatigue leads to poor judgment.
Detach from outcomes – focus on process, not profit.
💡 Tip: When you reduce emotional pressure, your clarity and accuracy both improve.
⚙️ 4. Professional Mindset Shift
Amateurs chase profit; professionals protect capital.
Each trade is just one data point — not a reflection of your worth. Once you start thinking like a risk manager first, your results change naturally.
🗣️ “Discipline is choosing what you want most over what you want now.”
📊 Conclusion
To grow as a trader, focus on controlling yourself before controlling the market.
Emotional stability + strict risk control = long-term success.
Be the trader who executes with logic, not emotion. 🧘♂️
Nifty Bulls Cooling Off Before Next Surge?Eyeing a Strategic Entry on Pullback!
Nifty continues to ride the bullish wave 🌊, but signs point to a short-term pullback by Friday’s close — a healthy dip before the next leg up. 📉➡️📈
🎯 Trade Setup:
🔹 Buy: 25850 CE (28th Oct Expiry)
🔹 Entry: ₹165
🔹 Stop Loss: ₹135
🔹 Target: ₹225
📌 Risk-Reward is solid, with smart positioning ahead of next week’s move.
🧠 Stay patient — let the price come to you. Great setups don’t chase, they wait and strike. 🐅
Your feedback drives our content and keeps everyone trading smarter. Let’s make those pips together! 🚀
Happy Trading,
– The InvestPro Team

Beginner to Pro: Master Any Trade with This Step‑By‑Step PlanI make educational content videos for swing / positional trading .
Charts used in the video are 3 months old for explanation using Bar replay feature of Trading view.

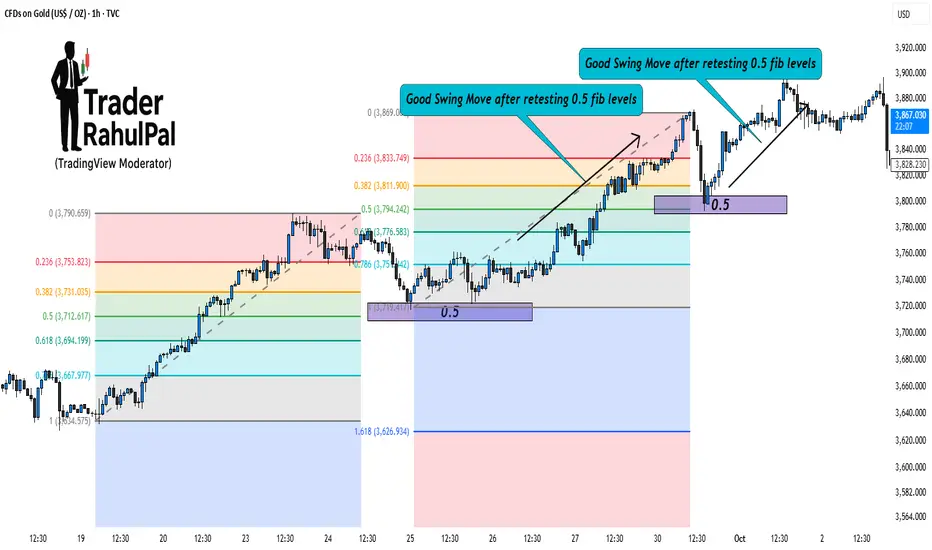
1 of the best Gold Swing Trading Strategy with Fibonacci Levels!Hello Traders!
Gold (XAU/USD) is a perfect instrument for swing trading because of its clean technical reactions.
One of the most reliable tools to trade gold swings is the Fibonacci retracement .
When used correctly, it helps you catch pullbacks and ride the next wave in the trend. Let’s break it down step by step.
1. Identify the Swing Move
First, find a strong impulse move on gold, either bullish or bearish.
This becomes your “anchor move” for drawing Fibonacci levels.
The idea is to wait for price to retrace part of this move before continuing in the main direction.
2. Draw Fibonacci Levels
Take the swing low to swing high (for bullish) or swing high to swing low (for bearish).
Mark key retracement levels: 38.2%, 50%, and 61.8% .
These levels often act as strong support or resistance zones for gold.
3. Look for Confirmation
Don’t trade blindly at a Fib level. Wait for confirmation like reversal candlesticks (pin bars, engulfing) or RSI divergence.
Volume spikes near Fibonacci zones also confirm institutional buying/selling.
4. Entry & Risk Management
Enter trades near 38.2%, 50%, or 61.8% retracements when confirmation appears.
Place stop loss just beyond the next Fibonacci level.
Set targets at previous swing highs/lows or Fibonacci extension levels like 127% and 161.8%.
5. Why It Works Well on Gold
Gold respects technical levels strongly due to high liquidity.
Institutions also use Fibonacci retracements to scale in and out of positions.
This makes Fibonacci one of the most effective tools for swing traders in gold.
Rahul’s Tip:
Always combine Fibonacci with structure. If a Fib level aligns with a key support/resistance, that zone becomes even stronger.
Conclusion:
Swing trading gold with Fibonacci retracements is simple yet powerful.
By focusing on impulse moves, waiting for retracements, and confirming with price action, you can trade gold with more confidence and less guesswork.
If this post gave you a clear strategy, like it, share your thoughts in comments, and follow for more practical gold trading setups!
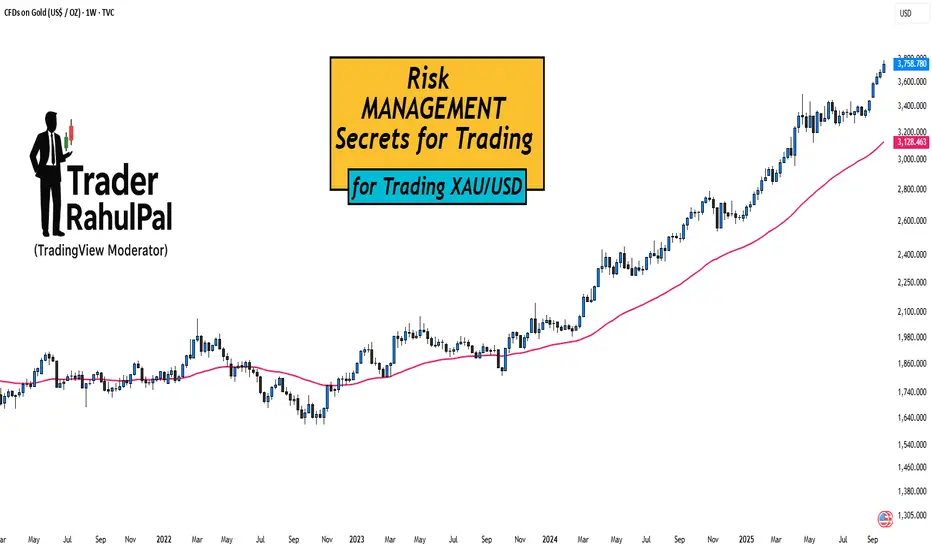
Risk Management Secrets for Trading XAU/USD!Hello Traders!
Gold (XAU/USD) is one of the most rewarding instruments, but also one of the most dangerous if you don’t manage risk properly.
Many traders lose not because their strategy is bad, but because they fail to protect their capital.
Here are some key risk management secrets every gold trader must know.
1. Position Sizing is Everything
Gold moves fast, a $5 move can wipe out accounts if the lot size is too big.
Always calculate position size based on risk per trade (ideally 1–2% of your account).
This way, even if you hit multiple stop losses, your account survives.
2. Wider Stops, Smaller Lots
Gold often spikes and hunts tight stop losses.
Use slightly wider stops, but reduce lot size to balance the risk.
This gives your trade room to breathe without increasing overall risk.
3. Never Trade News Without a Plan
During events like NFP, CPI, or Fed speeches, XAU/USD becomes extremely volatile.
If you’re not experienced, it’s better to stay out.
If you do trade, cut position size and expect slippage.
4. Daily Loss Limit
Decide in advance how much you can lose in one day (for example, 3% of account).
If that limit is hit, stop trading for the day.
This prevents emotional revenge trading, which is the biggest killer in gold trading.
5. Use Partial Profits
Gold reverses quickly, so book partial profits when the trade moves in your favor.
This locks in gains and reduces pressure.
Move stop loss to break-even once part profits are secured.
Rahul’s Tip:
Your job as a trader is not to catch every move, but to stay in the game .
Risk management may feel boring, but it’s the only reason why professional traders survive while retail traders blow up.
Conclusion:
In XAU/USD trading, strategy decides entries, but risk management decides survival.
By controlling lot size, stops, and emotions, you can make gold work for you instead of against you.
If this post helped you see risk management in a new light, like it, drop your thoughts in comments, and follow for more trading wisdom!
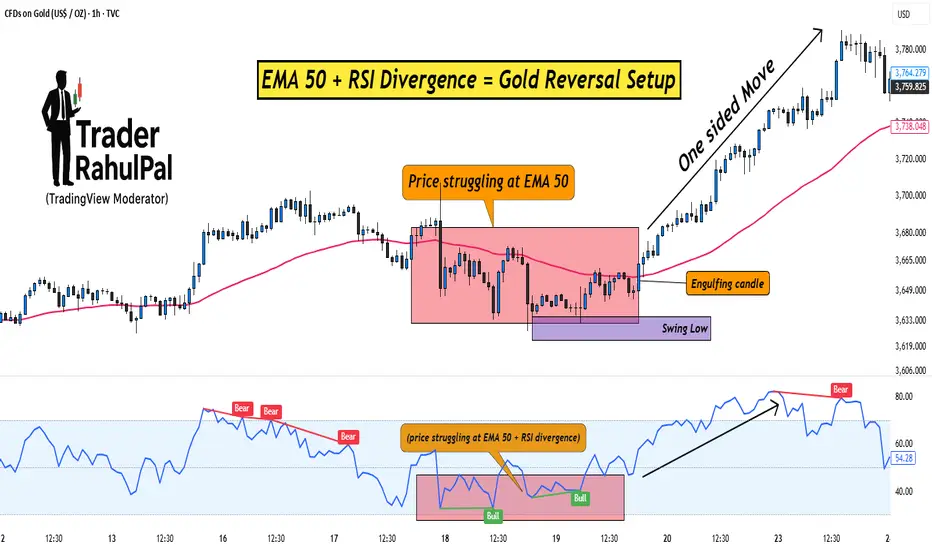
EMA 50 + RSI Divergence = Gold Reversal Setup!Hello Traders!
Gold often makes sharp one-sided moves, trapping traders who enter too late. But if you know how to combine a simple moving average with a momentum indicator, you can spot high-probability reversal setups.
One such method is using the EMA 50 together with RSI Divergence . Let’s break down how it works.
1. Why EMA 50?
The 50-period EMA acts as a dynamic trend filter.
When gold trades above it, the short-term trend is bullish; below it, bearish.
Price often retests the EMA 50 during pullbacks, making it a key level to watch for reversals.
2. What is RSI Divergence?
Divergence happens when price makes a new high/low, but RSI doesn’t confirm it.
Example: Price makes a higher high, but RSI makes a lower high → bearish divergence.
This signals that momentum is weakening, even if price is still moving strongly.
3. Combining EMA 50 with RSI Divergence
First, check where price is relative to EMA 50.
Next, look for divergence on RSI near that zone.
If both align (price struggling at EMA 50 + RSI divergence), chances of a reversal increase sharply.
4. Entry & Risk Management
Wait for a confirmation candle near EMA 50 (like engulfing or pin bar).
Place stop loss just above recent swing high/low.
Target the next support/resistance zone for exits.
Rahul’s Tip:
Don’t use divergence alone, combine it with EMA 50 for structure and you’ll filter out most false signals. This setup works best on higher timeframes like 1H or 4H for gold.
Conclusion:
EMA 50 gives you the trend filter, and RSI divergence reveals momentum weakness.
Together, they form a reliable reversal setup that helps you enter gold trades at the right time instead of chasing moves.
This Educational Idea By @TraderRahulPal (TradingView Moderator) | More analysis & educational content on my profile
If this post gave you a new setup idea, like it, share your thoughts in comments, and follow for more practical trading strategies!
Part 6 Learn Institutional Trading 1. Introduction to Options Trading
Options trading is one of the most versatile and complex areas of financial markets. It offers traders and investors the ability to hedge, speculate, or generate income. Unlike stocks, which represent ownership in a company, options are financial contracts giving the buyer the right, but not the obligation, to buy or sell an underlying asset at a predetermined price within a specified time frame.
Options are derivatives, meaning their value derives from an underlying asset such as equities, indices, commodities, or currencies. They are widely used by institutional traders, retail investors, and hedgers to manage risk and leverage positions efficiently.
2. Types of Options
There are two primary types of options:
Call Options
Gives the holder the right to buy an underlying asset at a specified price (strike price) before or on the expiry date.
Used by traders who expect the price of the asset to rise.
Put Options
Gives the holder the right to sell an underlying asset at a specified price before or on expiry.
Used by traders who expect the price of the asset to fall.
Key Terms in Options Trading
Strike Price (Exercise Price): The predetermined price at which the asset can be bought or sold.
Expiry Date: The date by which the option must be exercised.
Premium: The cost of buying the option.
Intrinsic Value: The actual value if exercised immediately (difference between market price and strike price).
Time Value: Extra value reflecting the possibility of future price movement before expiry.
3. How Options Work
Options can be exercised in two styles:
American Style Options: Can be exercised anytime before expiry.
European Style Options: Can only be exercised on the expiry date.
Example:
You buy a call option for stock XYZ with a strike price of ₹1,000, expiring in 1 month.
Current market price is ₹1,050, and the premium paid is ₹50.
If the stock rises to ₹1,200, you can exercise the option and make a profit:
Profit = (Stock Price − Strike Price − Premium) = 1,200 − 1,000 − 50 = ₹150 per share.

XAU/USD – Captain Vincent Weekly Plan🔎 Captain’s Log – Context
📈 Main Trend : Strong uptrend after BoS.
📊 Price moving sideways within the rising channel, staying below Weak High 3674 .
📌 EMA 50 > EMA 200 → bullish trend remains solid.
🎯 Captain’s Map – Trading Scenarios
1️⃣ Golden Harbor (BUY – Main Priority)
🎯 Entry:
FVG Dock: 3602 – 3593
FVG Deep: 3567 – 3560
OB Harbor: 3535 – 3540
⛔ SL: below 3520
✅ TP1: 3674 (sweep Weak High)
✅ TP2: 3720 – 3740
2️⃣ Quick Boarding (Short-term SELL – Counter-trend)
Condition: If price breaks 3674 first → watch for false break.
🎯 Entry: 3670 – 3680
✅ TP: back to 3602 – 3567
⚠️ Note : scalp only, don’t hold long.
3️⃣ Storm Breaker Alert (Bearish Scenario)
If 3535 breaks → short-term uptrend invalidated.
🎯 Bearish target: 3480 – 3500
Captain’s Note ⚓
“The golden sail still catches the wind after BoS, leading the captain and crew on the bullish tide. Golden Harbor 🏝️ (3593 – 3560 – 3535) remains the preferred docking point to load cargo and continue the voyage. Quick Boarding 🚤 at Storm Breaker 🌊 (3670 – 3680) is only a short ride when the ship sweeps liquidity at Weak High 3674 . Should 3535 break, the ship might be dragged toward 3480 – 3500, but as long as it anchors at Golden Harbor, the grand journey still heads north toward 3720+.”

XAUUSD | FED leaning toward 50bps cut? | Buy strategy at support🟡 XAU/USD – 12/09 | Captain Vincent ⚓
🔎 Captain’s Log – Market Context
The probability of a FED -50bps cut next week has risen to 10.9% (from 8%), while a -25bps scenario is almost certain.
US jobless claims rose sharply → reflecting a weakening labor market, reinforcing expectations of FED easing.
Tonight (21:00): release of Consumer Sentiment & 1Y–5Y Inflation Outlook (University of Michigan) – data that could further impact the Dollar.
⏩ Captain’s Summary: Dollar weakness + falling bond yields = Gold remains supported to rise. However, short-term pullbacks may appear before breaking higher levels.
📈 Captain’s Chart – Technical Analysis
Storm Breaker (Resistance / Sell Zone):
Weak High: 3675 – 3677 (psychological barrier)
Peak Zone: 3676 – 3680 (high test, short-term reversal risk)
Golden Harbor (Support / Buy Zone):
FVG: 3603 – 3601
Deep Harbor: 3621 – 3623
Price Structure:
On H1, Gold has repeatedly formed BoS and Equal High (EqH) around 3645 – 3650.
An FVG appears → sign that price may need to fill the liquidity gap before continuing.
Priority scenario: Pullback to 3636 or deeper 3621, then rebound towards 3675 – 3680.
If 3680 breaks successfully → opens the way for new ATH above 3700.
🎯 Captain’s Map – Trading Plan
✅ Buy (trend-follow priority)
Buy FVG: 3601 – 3603 | SL: 3591 | TP: 3605 – 3610 – 3615 – 3620 – 36xx
Buy Zone: 3621 – 3623 | SL: 3612 | TP: 3640 – 3655 – 3665 – 3675 – 368x
⚡ Sell (short-term scalp at resistance)
Sell Zone: 3675 – 3680 | SL: 3684 | TP: 3665 – 3655 – 3645 – 36xx
⚓ Captain’s Note
“The dovish wind from the FED continues to push the golden sails forward. Golden Harbor 🏝️ (3636 – 3621) is the safe docking zone for sailors to gather strength before the new voyage. Storm Breaker 🌊 (3675 – 3680) may create big waves for short Quick Boarding 🚤 , but the main course is still heading North. If the 3680 wave breaks, the golden ship will extend its journey to new peaks above 3700.”

Caution ahead of US PPI report | Priority on Sell setups🟡 XAU/USD – 10/09 | Captain Vincent ⚓
🔎 Captain’s Log – Market Context
US 10-year bond yields rebound, signaling the market is awaiting key inflation data.
At 07:30, US PPI report will be released – a crucial figure that could strongly influence FED rate expectations.
Investors are also eyeing US CPI in the coming days to assess the inflation outlook.
The US Supreme Court accepted Trump’s appeal, but this news has not yet had a notable impact on Gold.
⏩ Captain’s Summary: Ahead of inflation data, Gold often tends to correct lower due to cautious sentiment.
📈 Captain’s Chart – Technical Analysis
Storm Breaker (Key Resistance):
Bearish OB: 3654 – 3660 (short-term upper cap)
ATH Watchtower: 3700 – 3702 (Sell Zone – possible new ATH test)
Golden Harbor (Strong Support):
Buy Zone: 3601 – 3602
OB Dock: 3582 – 3585
Currently, price is around 3640 – 3645, after a technical rebound from support. High probability that Gold will retest nearby resistance before a downward correction.
🎯 Captain’s Map – Trade Scenarios
⚡ Quick Boarding (SELL – Daily Priority)
Entry 1: 3654 – 3660
SL: 3668
TP: 3654 → 3650 → 3618 → 3610
Entry 2 – ATH Test: 3701 – 3703
SL: 3711
TP: 3688 → 3675 → 3665 → 365x
✅ Golden Harbor (BUY – Only at deep support)
Buy Zone: 3601 – 3603
SL: 3592
TP: 3610 → 3620 → 3630
⚓ Captain’s Note
“The golden ship faces turbulent seas today as it sails near Storm Breaker 🌊 (3654 – 3660) . Before the fierce winds called US PPI , sailors should prioritize dropping anchor with short-term SELL positions at resistance. Golden Harbor 🏝️ (3601 – 3603) remains a safe haven below, but only when the ship corrects deeply should it dock. On this voyage, Quick Boarding 🚤 is for scalp maneuvers, while the main current is still steered by the stormy waves of inflation.”

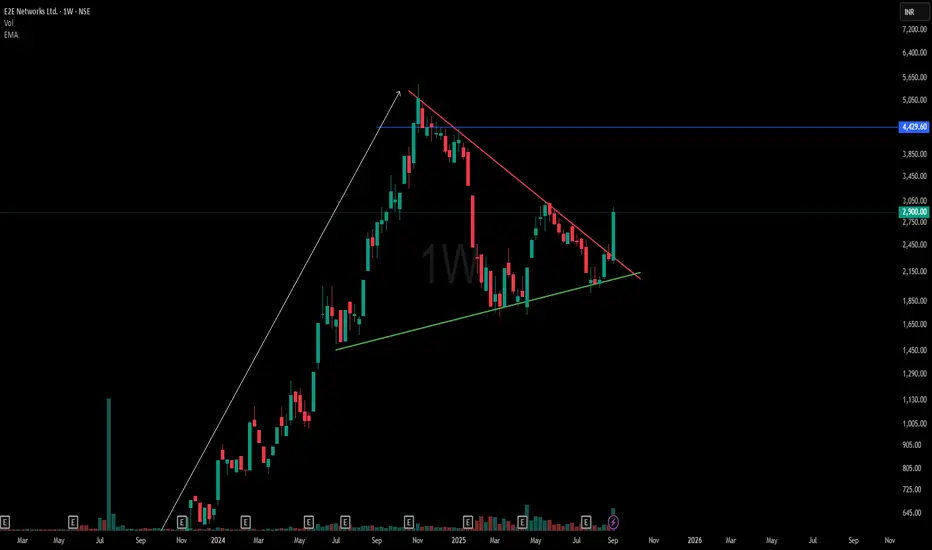
Perfect Symmetrical Triangle Chart Pattern💡 Chart Pattern Education
Symmetrical triangles are powerful continuation patterns that form when buyers and sellers reach equilibrium. The converging trendlines create a coiling effect, building pressure for the next major directional move. Studies show 68-75% success rate when traded with proper volume confirmation.
⚡ Matching the Chart shown and the above definition
✅ Higher lows trend intact on support trendline
✅ Lower highs forming clean resistance line
✅ Consolidation phase showing market indecision
✅ Volume declining as expected in triangle patterns
✅ Multiple timeframe confirmation visible
Disclaimer:
This analysis is for educational and informational purposes only and does not constitute financial advice or a recommendation to buy or sell any security. Trading involves risk, and past performance is not indicative of future results. Traders should conduct their own due diligence and consider their risk tolerance before making any trading decisions
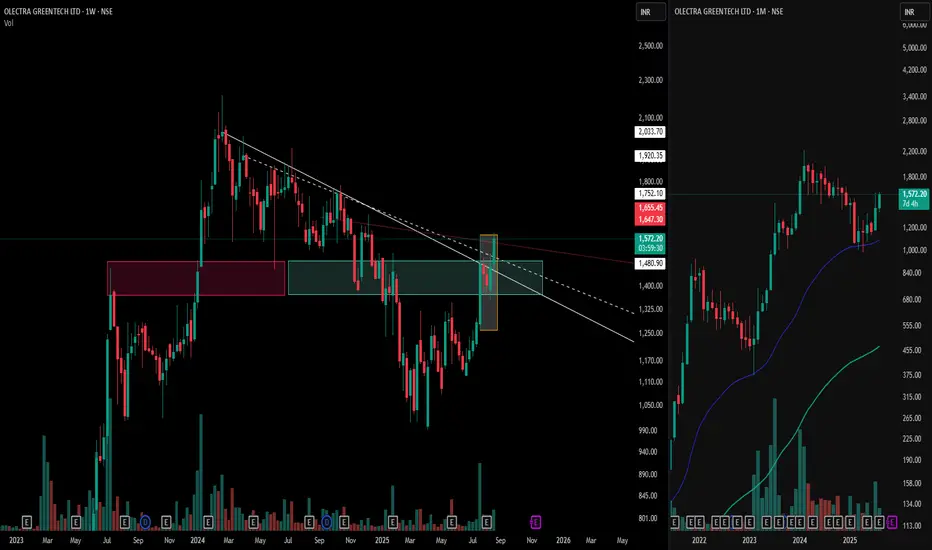
Olectra Greentech: Power of the Mother Candle & Zone Flip📊 White trendlines mark the crucial control trend and resistance levels.
🕯️ The bold Mother Candle (highlighted in the orange box) is marked .
💗 Notice the Pink Zone — formerly a tough resistance area — now flipped into strong support after the breakout, a classic supply-to-demand flip!
💎 The Cyan Box highlights an emerging demand zone, where buying interest gathers
⚡ Right side is a Representation of Market structure on the Biggest Time frame ( Monthly time frame ) showcasing a Higher high and Higher low formation and respecting the EMA plotted .
This is a stellar example of price structure and supply-demand dynamics in action—perfect study material for keen market observers.
⚠️ Disclaimer: This post is for educational and research purposes only. It does not constitute financial advice or a forecast. Always do your own analysis before making trading decisions.
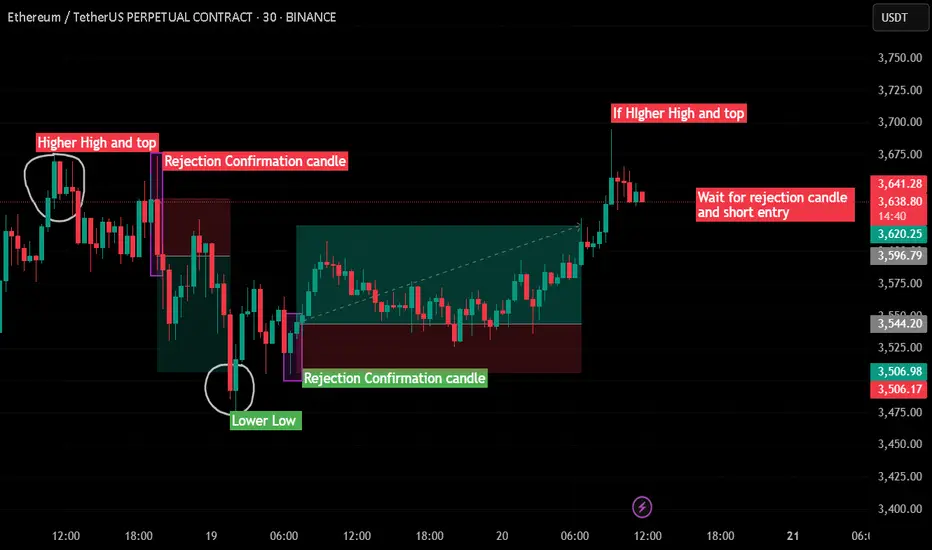
Trend Reversal Rejection Strategy | Higher High + Candle Confirm🔍 Idea Summary:
This strategy focuses on identifying trend reversal zones using classic Higher High (HH) and Lower Low (LL) structures followed by rejection confirmation candles.
🔻 Short Setup:
Price forms a Higher High.
Wait for a rejection candle (long wick, body closes inside previous range).
Confirm structure break and take short entry on confirmation.
✅ Example: On the left side of the chart, price printed a HH, followed by a strong rejection candle. That led to a clean move downward.
🔺 Long Setup:
Price forms a Lower Low.
Watch for a rejection candle near key support.
Enter long trade after confirmation.
✅ Example: Mid-chart shows price breaking to LL, then instantly rejecting with a strong bullish candle. Followed by a sustained move up.
🔴 Current Price Action:
Price is testing a potential new Higher High.
📌 Strategy suggests: Wait for a bearish rejection candle before shorting!
📈 Strategy Benefits:
Avoids impulsive entries
Combines structure with candle logic
Great for reversal traders and range scalpers
🔥 Like & follow for more real-time trading ideas!
💬 Drop your thoughts or questions below – let’s grow together, traders! 💪
#ETHUSDT #PriceAction #RejectionCandle #TrendReversal #SupportResistance #Scalping #TradingStrategy #Crypto #ChartPatterns #TechnicalAnalysis
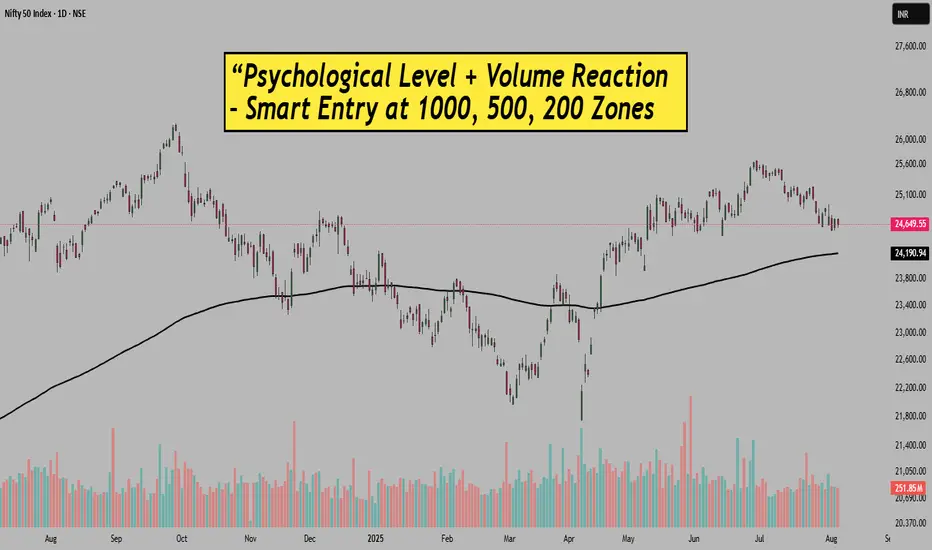
Psychological Level+Volume Reaction–Smart Entry at 1000-500 ZoneHello Traders!
Ever noticed how the market behaves around round numbers like 1000, 200, 500 levels?
There’s something powerful about these zones, not just technically, but psychologically too.
These are the levels where large participants often step in… and smart traders take entry.
Today’s post will help you understand how psychological price levels work — and how to combine them with volume confirmation for better intraday or swing setups.
Why Psychological Levels Matter
Round numbers attract attention:
Levels like 24500, 25000, 25500 in Nifty or BankNifty act as magnets. Institutions, algos, and even retail traders tend to place orders around these levels.
Buyers or sellers take control at these points:
Price often pauses or reverses here, as it becomes a battleground of supply and demand. Especially if this level is also a previous support/resistance zone.
Self-fulfilling behavior of traders:
Because everyone expects a reaction near these zones, price actually reacts. This creates great opportunities if you can enter with the right confirmation.
Volume Confirmation Makes It Powerful
Look for unusual volume near these zones:
Let’s say Nifty hits 24600 and suddenly you see a volume spike on a bullish candle — that’s not coincidence. That’s your cue.
Price rejection with volume is key:
Wick-based candles, engulfing patterns, or inside bars rejecting psychological levels with volume boost often lead to clean intraday moves.
Consolidation + Breakout works best:
If price consolidates near these psychological zones with low volume and breaks out with high volume, it often creates strong directional moves.
Rahul’s Tip:
Instead of randomly entering trades, mark round levels like 24500/24750 on your charts.
Then wait patiently, combine volume + price action and let the trade come to you.
Most false moves get filtered out when you use this setup with discipline.
Conclusion:
These psychological levels are used by big players to trap retail traders, but if you learn to read reactions at these levels, you can trade smarter.
No need to chase. Just observe, react, and manage risk.
What’s your experience with psychological levels? Have they helped your trades?
Share your thoughts in comments.
If this post helped, do like, follow and share with your trader friends.
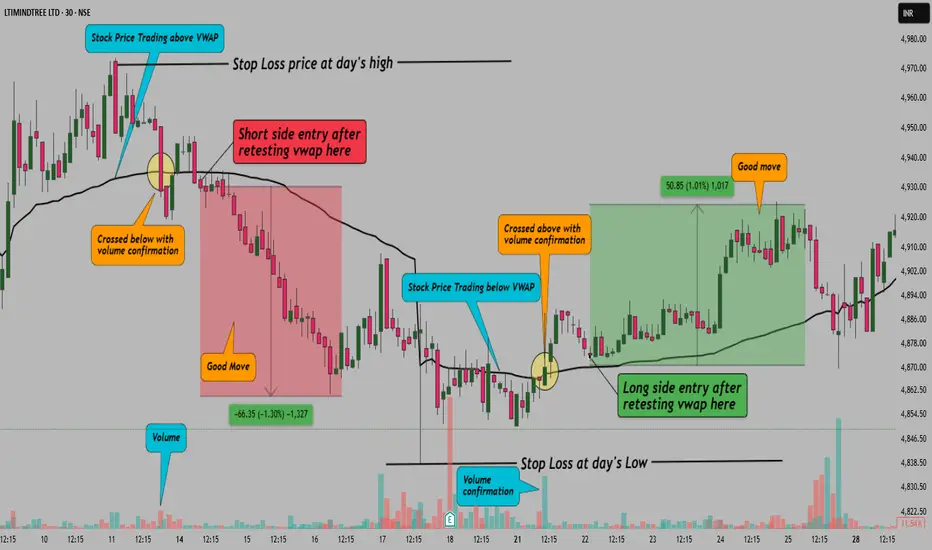
VWAP Flip Strategy–Most Accurate Setup for Intraday Trend Shift!Hello Traders!
One of the cleanest signs of intraday trend shift happens right at the VWAP — the volume-weighted average price. Most traders use VWAP as a trend guide, but they miss one powerful signal called the VWAP Flip .
When price flips from staying below VWAP to breaking above and holding — or vice versa — it often marks the start of a fresh trend. And if volume supports the move, the accuracy becomes even stronger.
What is the VWAP Flip?
It’s when price has been consistently staying on one side of VWAP, and then crosses over with conviction and starts respecting the other side.
For example, if price was trading below VWAP all morning and then breaks above with a solid candle, retests, and holds — that’s a bullish VWAP flip.
Why This Strategy Works
VWAP reflects average trader sentiment: When price flips above, it shows buyers are gaining strength
It filters false breakouts: Flip + retest helps avoid fake moves during sideways markets
Volume confirms conviction: A flip with increasing volume shows strong intent behind the shift
How to Trade the VWAP Flip
Step 1: Identify whether price is respecting VWAP from one side
Step 2: Wait for price to flip — clean break and candle close on opposite side
Step 3: Look for a retest of VWAP. Entry should be near VWAP with small stop loss
Step 4: Exit at previous day’s high/low or next support/resistance zone
Entry + SL + Target (Example Setup):
Entry: On candle close and retest above VWAP
Stop Loss: Below retest candle low
Targets: 1:2 RR minimum or trail till trend continues
Note:
This setup has been identified using the 5-minute timeframe, as it offers better intraday structure for the VWAP Flip strategy. However, since TradingView does not allow drawings below 15-minute timeframe for sharing or publishing, I initially marked the levels and structure on the 5-minute chart, took a screenshot, and then placed it over the 30-minute chart for visual representation.
Rahul Tip:
Use VWAP Flip only in trending environments. Avoid it in flat days. Combine it with 5 EMA or volume spikes for extra confirmation. Also, mark high-impact news times to avoid random flips.
Conclusion:
VWAP Flip is one of the cleanest, low-risk, high-reward intraday setups when used with proper structure and confirmation. Practice spotting it in real time — and it might become your new favorite setup.
Have you used VWAP Flip before? Let me know your win rate or drop a chart example in comments.
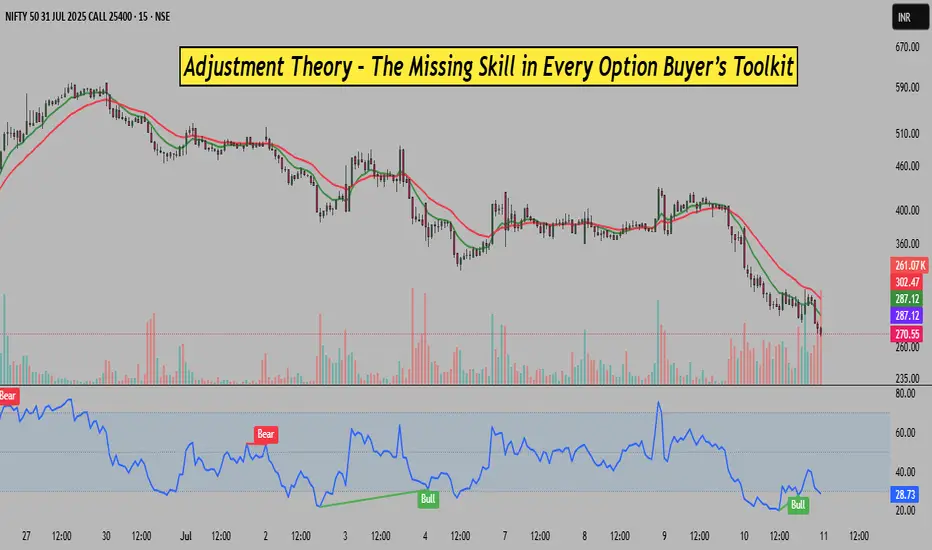
Adjustment Theory-Missing Skill in Every Option Buyer’s Toolkit!Hello Traders!
Most option buyers enter trades with just one mindset — “It will either hit target or stop-loss.” But in real trading, markets are dynamic, not binary. That’s where Adjustment Theory comes into play. It’s the art of reshaping your trade when things go wrong , rather than simply accepting a loss. Mastering this one skill can separate a consistent trader from a frustrated gambler.
Why Option Buyers Need Adjustment Skills
Premium Erodes Quickly: Options lose value fast when markets go sideways. Without adjustments, buyers bleed time decay (theta) daily.
Direction May Be Right, But Timing Wrong: You could be right eventually — but wrong now. Adjusting gives your view more breathing room.
Avoid Full Stop-Losses: Instead of letting a position die, adjustments help you salvage or even reverse the trade.
It Adds Flexibility: You don’t need to exit immediately on red — you can reshape the trade to improve risk-reward.
Simple Adjustments Option Buyers Can Use
Roll to Next Expiry: If your option is OTM and nearing expiry, roll to next week/month to buy more time for your view to play out.
Switch to Spreads: Convert naked calls or puts into debit spreads to reduce cost and hedge delta.
Add Hedge or Contra Position: If the move goes strongly against you, consider a hedge trade — like buying a put when holding a call.
Exit Partially & Re-enter Better: Book partial loss, wait for price improvement or signal re-entry — smarter than holding blindly.
Rahul’s Tip
Think like a strategist, not just a trader. The market won’t always go your way — but if you adapt instead of panic, you’ll stay in the game much longer.
Conclusion
Adjustment Theory is like oxygen for option buyers. It gives you control, extends your edge, and prevents one bad entry from becoming a big loss. Learn to adjust with logic and patience — and watch your consistency grow.
Do you use adjustments in your option trades? Let’s discuss some real-world situations in the comments below!
NEducation
Bearish divergence in MFSL after new ATHThe monthly chart signals a possible pullback in the MFSL price this month. Already a new all-time high is made, 1666.90
Immediate support to invalidate the fall will be 1579.50 to 1564.85 range, which also makes st target for the fall.
The other levels' downside are 1511, 1470 and 1376.50
If price bounces from the support range and closes above 1648, the bullish trend will continue for new higher highs.

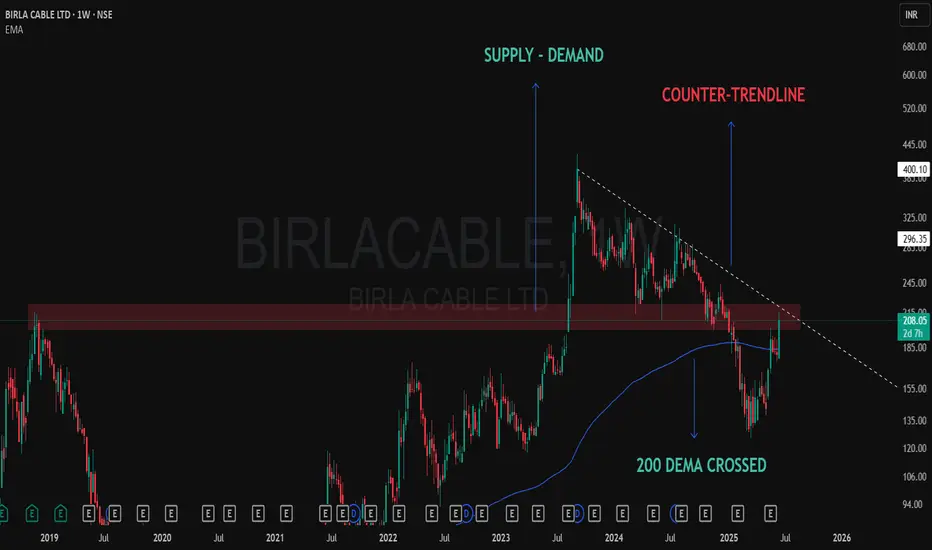
Technical Development on Weekly Chart – Birla Cable📈 BIRLA CABLE – Chart Talking Loud Now!
✅ 200 DEMA crossed
200 Dema was providing solid resistance and now taken out marked with blue line.
❌ At Counter-Trendline
Solid CT thrown from the top of the pattern, dotted white line shows that.
✅ Demand Zone Holding Strong
Clearly shown a solid supply zone which got converted into a Demand only after the Breakout some months back.
After months of consolidation and rejection from the same supply zone… price is now attacking with volume 🔥
🧠 “When structure aligns with emotionless patience, conviction follows.”