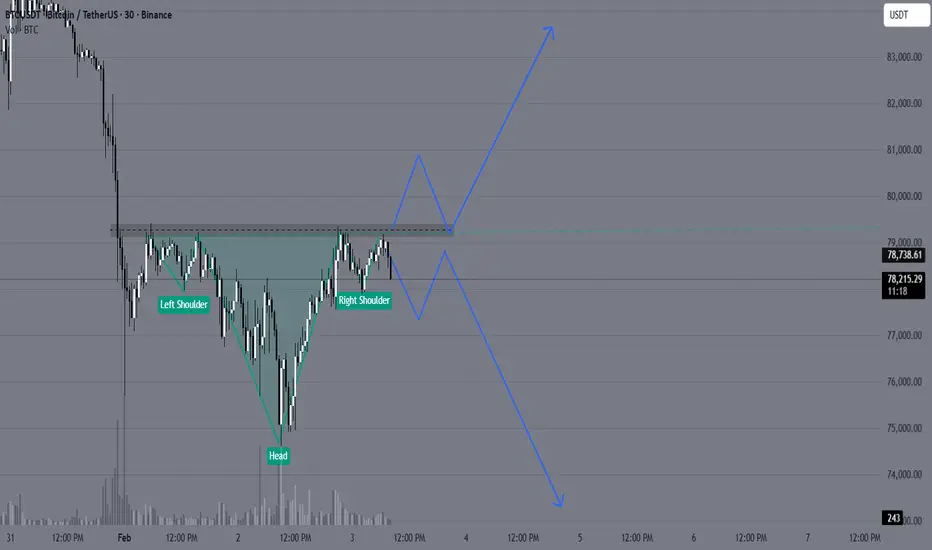
BTCUSD might give Structure Shift Now✅ Pattern: Potential Inverse Head & Shoulders
Look closely:
Left dip → around 76.8k
Deep dip (Head) → around 75k
Right dip → higher low near 76.5k
Now price is pushing back up
This is a classic reversal structure.
✅ Important Level: Neckline Resistance
The dotted zone you marked around:
79,000–79,200
That is the neckline / supply cap.
Price is repeatedly testing it.
📌 Until this breaks, structure is still “building.”
✅ Structure Type: Higher Low Creation
This is the most important:
Previous low = 75k
New low = ~76.2k
That means:
Higher Low → Early Bullish Shift
This is how reversals begin.
🚦What’s Needed for Confirmation?
Bullish Confirmation = Break + Close Above 79.2k
If BTC closes above that zone:
✅ Structure break
✅ Trend reversal likely
✅ Next targets:
80.5k
82k
84.4k (major resistance)
⚠️ Bearish Risk
If price rejects again and breaks below:
76.5k support
Then structure fails and BTC can revisit:
75k
73.8k
📌 Conclusion
BTC is creating a structure:
✅ Base + Range
✅ Higher Low
✅ Possible Inverse H&S
⏳ Waiting for neckline breakout
Trend Analysis
ETHUSD at a crucial support Forming Head and shoulder pattern✅ Pattern Forming: Inverse Head & Shoulders (Early Stage)
Look closely:
Left Shoulder → ~2300
Head (lowest point) → ~2180–2200
Right Shoulder → ~2250–2270
Price now pushing upward again
This is a classic bullish reversal structure.
✅ Key Resistance / Neckline Zone
Marked level around:
2380–2400
Price is currently struggling below this.
That is the neckline / supply barrier.
✅ Bullish Structure Confirmation
Breakout Confirmation = 1H Close Above 2400
If ETH closes above 2400 with volume:
✅ Structure break
✅ Trend shift begins
✅ Upside continuation likely
🎯 Targets After Breakout
Once breakout happens, next targets:
Target Level
Target 1 2494
Target 2 2600
Target 3 2700
🛑 Invalidation / Stop Loss Area
If ETH drops below:
2250 support
Then structure fails and price can revisit:
2200
2100 zone

NIFTY Levels for Today
Here are the NIFTY's Levels for intraday (in the image below) today. Based on market movement, these levels can act as support, resistance or both.
Please consider these levels only if there is movement in index and 15m candle sustains at the given levels. The SL (Stop loss) for each BUY trade should be the previous RED candle below the given level. Similarly, the SL (Stop loss) for each SELL trade should be the previous GREEN candle above the given level.
Note: This idea and these levels are only for learning and educational purpose.
Your likes and boosts gives us motivation for continued learning and support.

BANKNIFTY Levels for Today
Here are the BANKNIFTY’s Levels for intraday (in the image below) today. Based on market movement, these levels can act as support, resistance or both.
Please consider these levels only if there is movement in index and 15m candle sustains at the given levels. The SL (Stop loss) for each BUY trade should be the previous RED candle below the given level. Similarly, the SL (Stop loss) for each SELL trade should be the previous GREEN candle above the given level.
Note: This idea and these levels are only for learning and educational purpose.
Your likes and boosts gives us motivation for continued learning and support.

USA reduced TARIFF to 18%! Recovery for NIFTY!?Following the global cues, we can see SGX rose over 3 percent following the statement that USA has reduced tariff to 18 percent which will give temporary push to NIFTY but yet our supply zones will act as important zones hence we will trade based on rejection on your demand and supply zone so plan your trades accordingly and keep watching everyone.

NIFTY50 Targets 50% upside in next 24-30 months Possibility.NIFTY50 Targets 50% upside in next 18-24 months Possibility.
With the US Trade deal in favor of INDIA & Also Europe Trade deal recently done ... it shows the Foreign partners confidence in INDIA.
We have protected 24600 on low side & going to retrace by 1000 point in matter of just 3 days. Nifty is now on path of Recovery & soon we may see new peak on Nifty by March End.
Post March we can see Nifty breaking out of H&S Pattern rising Nifty to 31000+ Levels in next 1 Year & 38000+ in another 1 Year.
LTP - 25088
Targets - 38000+ ... 51% upside.
Timeframe - 24-30 months
Happy Investing.

NTPC LtdSymmetrical Triangle as the primary pattern, the price action is currently forming lower highs
and higher lows, indicating a triangle structure and significant volatility contraction ahead of an expected breakout move, buy above 362 with a target at 390

Automotive Axles - ATH Breakout - Investment Ideas#Automotive Axles Limited - Technical Analysis
Current Price: 1,790.80
#Breakout & Retest = Opportunity
#Technical Setup
Strategy: Swing to Short Term Trade
✅ **ATH Breakout + Retest** - Successfully retested breakout zone
✅ **Higher High Formation** - Clear uptrend structure
✅ **EMAs Sorted** - Bullish alignment confirmed
✅ **Trendline Breakout** - Long-term resistance conquered
#Key Levels
Support: 1,520 (Tight SL) | 1,504 (Major support)
Swing Targets:
- T1: 2,078
- T2: 2,189
- T3: 2,284
Short-Term Targets:
- T1: 2,546
- T2: 2,800
- T3: 2,933
- Grand T4: 3,125
#tradesetup
Entry: Current levels (1,790 - 1,800)
Stop Loss: 1,520 (daily closing basis)
Risk-Reward: 1:3+ (excellent)
Timeframe: 2-6 months
Disclaimer: For educational purposes only. Not investment advice. Trading involves substantial risk. Consult a SEBI-registered financial advisor before making investment decisions. Past performance doesn't guarantee future results.
#AutomotiveAxles #SwingTrading #BreakoutTrading #TechnicalAnalysis #NSE #AutoStocks #ShortTermTrading #StockMarket #ATHBreakout #IndianStocks

NIFTY Positional Level Analysis for 03/02/2026+ USA Rate CutNIFTY Positional Level Analysis for 03rd Feb 2026+
❇️ IMPACT of USA Tariff Cut Announcement
on February 2, 2026 Published NEW Levels
👇🏼Screenshot of NIFTY Spot All-day(02nd FEB 2026 at 1.23 AM) in 15 min TF.
On February 2, 2026, US President Donald Trump announced a significant trade deal with India, reducing tariffs on Indian goods from 25% to 18% effective immediately, following a phone call with Indian Prime Minister Narendra Modi. This move also includes dropping a separate 25% tariff imposed in August 2025 on Indian imports due to India's purchases of Russian oil, in exchange for India's commitment to cease those imports. The effective tariff rate on Indian exports to the US will now stand at 18%, down from a combined 50% in some interpretations.
❇️ Key Deal Elements
Tariff Reductions: US reciprocal tariffs on Indian goods reduced to 18% from 25%, with the additional 25% "fentanyl-related" tariff (linked to Russian oil) fully removed. India agreed to reduce its tariffs and non-tariff barriers on US goods to zero in reciprocation.
Russian Oil Pledge: India committed to halting purchases of Russian-origin oil, uranium, natural gas, and related products, addressing US concerns over sanctions evasion. This aligns with potential US legislation like the Sanctioning Russia Act of 2025.
US Purchases from India: As part of the deal, the US agreed to purchase $500 billion worth of Indian energy, technology, agriculture, coal, and other products.
Litigation Context: The announcement follows ongoing US court challenges to Trump's tariff authority, including a Federal Circuit ruling in September 2025 that partially invalidated similar "fentanyl" and reciprocal tariffs, though stayed pending Supreme Court appeal (oral arguments heard November 2025).
❇️ Background and Strategic Implications
Tariff History: The initial 25% reciprocal tariff was imposed in August 2025, escalating to 50% with an additional levy tied to India's Russian oil imports amid the Ukraine conflict. This deal defuses tensions, especially post-Trump's reelection and focus on global trade imbalances.
For India: Significant relief for exporters (e.g., textiles, pharma, IT services), potentially boosting bilateral trade from $200+ billion annually. It also aligns with India's diversification from Russian energy amid global pressures.
Market Reaction: I ndian stocks / Index future (e.g., GIFTNIFTY) rallied 4+% on the news, with export-oriented sectors like auto and textiles gaining. Rupee strengthened slightly against USD. However, some criticism on social media views it as a "surrender" to US pressure, reducing India's leverage.
🚀Follow & Compare NIFTY spot Post for Taking Trade
🚀Follow GIFTNIFTY Post for NF levels
━━━━━━━━━₹₹₹₹₹₹₹₹₹₹₹₹━━━━━━━━
💥Level Interpretation / description:
L#1: If the candle crossed & stays above the “Buy Gen”, it is treated / considered as Bullish bias.
L#2: Possibility / Probability of REVERSAL near RLB#1 & UBTgt
L#3: If the candle stays above “Sell Gen” but below “Buy Gen”, it is treated / considered as Sidewise. Aggressive Traders can take Long position near “Sell Gen” either retesting or crossed from Below & vice-versa i.e. can take Short position near “Buy Gen” either retesting or crossed downward from Above.
L#4: If the candle crossed & stays below the “Sell Gen”, it is treated / considered a Bearish bias.
L#5: Possibility / Probability of REVERSAL near RLS#1 & USTgt
HZB (Buy side) & HZS (Sell side) => Hurdle Zone,
*** Specialty of “HZB#1, HZB#2 HZS#1 & HZS#2” is Sidewise (behaviour in Nature)
Rest Plotted and Mentioned on Chart
Color code Used:
Green =. Positive bias.
Red =. Negative bias.
RED in Between Green means Trend Finder / Momentum Change
/ CYCLE Change and Vice Versa.
Notice One thing: HOW LEVELS are Working.
Use any Momentum Indicator / Oscillator or as you "USED to" to Take entry.
━━━━━━━━━━━━━━━━━━━━━━━━━━━━━━━━━━━━━━━━━━━
⚠️ DISCLAIMER:
The information, views, and ideas shared here are purely for educational and informational purposes only. They are not intended as investment advice or a recommendation to buy, sell, or hold any financial instruments. I am not a SEBI-registered financial adviser.
Trading and investing in the stock market involves risk, and you should do your own research and analysis. You are solely responsible for any decisions made based on this research.
"As HARD EARNED MONEY IS YOUR's, So DECISION SHOULD HAVE TO BE YOUR's".
━━━━━━━━━━━━━━━━━━━━━━━━━━━━━━━━━
❇️ Follow notification about periodical View
💥 Do Comment for Stock WEEKLY Level Analysis.🚀
📊 Do you agree with this view?
✈️ HIT THE PLANE ICON if this technical observation resonates with you. It will Motivate me.
━━━━━━━━━━━━━━━━━━━━━━━━━━━━━━━━━
💡 If You LOOKING any CHART & want for Level and ANALYZE?
Share your desired stock names in the comments below! I will try to analyze the chart Levels, patterns and share my technical view (so far my Knowledge).
If Viewers think It can identify meaningful setups. Looking forward to hearing from all of you — let's keep this discussion going and help each other make better trading decisions.

(XAUUSD) – Bearish Continuation From Major Supply Zone (45m)
Market Structure
Clear trend reversal from the highs → strong impulsive sell-off.
The curved marking shows a distribution/top formation, followed by aggressive downside momentum.
Overall structure is lower highs & lower lows → bears in control.
Key Zones
Resistance / Supply Zone (~4,700–4,750)
Previous support flipped into resistance.
Price has retested this zone multiple times and failed to break above → strong seller presence.
Target / Demand Zone (~4,350)
Prior demand area and liquidity pool.
Logical downside objective if resistance continues to hold.
Entry Logic (as drawn)
Short entry after rejection inside the resistance zone.
Confirmation comes from:
Weak bullish candles
Long upper wicks
Failure to reclaim the zone
Price Action Read
The small bounces are corrective pullbacks, not reversals.
Each push up is being sold → classic bearish continuation / pullback-to-supply setup.
Bias & Expectation
Bias: Bearish
Expectation:
Rejection from resistance → continuation toward 4,350 target
Invalidation if price accepts and closes above the resistance zone
Summary
This chart shows a textbook support-to-resistance flip after a strong sell-off. As long as price remains below the highlighted resistance, the path of least resistance is down, targeting the lower demand zone.

BANKNIFTY : Trading levels and Plan for 03-Feb-2026📘 BANKNIFTY Trading Plan – 3 Feb 2026
(Timeframe: 15-Min | Instrument: BANKNIFTY | Educational Purpose Only)
🔑 Key Intraday Levels (From Chart)
🟢 60,367 – Higher Timeframe Resistance
🟢 59,574 – Last Intraday Resistance
🟠 58,922 – Opening Support / Resistance (Decision Level)
🟢 58,232 – Opening Support (Gap-Down Case)
🟢 57,973 – Last Intraday Support
🧠 Market Structure & Price Psychology
BANKNIFTY witnessed a sharp sell-off followed by a recovery bounce, indicating short covering from lower levels.
However, price is still trading below major resistance, so trend reversal is not confirmed yet.
👉 Tomorrow’s direction will depend on acceptance or rejection at opening levels, not assumptions.
🚀 Scenario 1: GAP UP Opening (200+ Points)
(Opening near / above 58,900)
🧠 Psychology
A big gap up after a fall usually signals short covering, but higher zones still carry institutional selling pressure.
🟢 Bullish Plan
🔵 If price sustains above 58,922 on a 15-min closing basis
🔵 Expect move towards 59,574
🔵 Break & acceptance above 59,574 can open path towards 60,367
🔴 Rejection Plan
🔴 Failure to sustain above 58,922
🔴 Expect pullback or consolidation towards 58,232
📌 Why this works
Only acceptance above resistance confirms fresh buying, not emotional gap-up trades.
➖ Scenario 2: FLAT Opening
(Opening between 58,500 – 58,800)
🧠 Psychology
Flat opens indicate balance between buyers and sellers. Market often expands after testing key levels.
🟢 Upside Plan
🔵 Acceptance above 58,922
🔵 Targets: 59,574 → 60,367
🔴 Downside Plan
🔴 Failure to cross 58,922
🔴 Drift towards 58,232
📌 Key Note
🟠 Expect range-bound movement until breakout or breakdown confirmation.
🔻 Scenario 3: GAP DOWN Opening (200+ Points)
(Opening near / below 58,232)
🧠 Psychology
Gap down reflects renewed fear & panic selling. Strong supports decide whether bounce or continuation happens.
🟢 Bounce Setup
🔵 If 58,232 holds on a 15-min basis
🔵 Expect short-covering bounce towards 58,922
🔴 Breakdown Setup
🔴 Clean break below 57,973
🔴 Downside momentum may accelerate sharply
📌 Why this works
Strong supports either give fast bounces or aggressive breakdowns—confirmation is key.
🛡️ Risk Management Tips (Options Traders)
🟢 Trade only after first 15-min candle confirmation
🟢 Prefer defined-risk option spreads in volatile moves
🟢 Avoid aggressive buying during gap-up opens ❌
🟢 Risk maximum 1–2% of total capital per trade
🟢 Book partial profits at pre-defined resistance/support
🟢 Discipline > Prediction 📌
🧾 Summary & Conclusion
📌 BANKNIFTY remains volatile and reactive
📌 58,922 & 58,232 are the most important intraday decision levels
📌 Break above 59,574 needed for bullish continuation
📌 Trade price reaction, not market noise 📈
⚠️ Disclaimer
This analysis is strictly for educational purposes only.
I am not a SEBI registered analyst.
Please consult your financial advisor before taking any trades.
Market investments are subject to risk.

Gold Analysis & Trading Strategy | February 2-3✅ From the 4-hour timeframe, after forming a trend reversal at the 5596 high, gold has established a clear bearish alignment in the moving average system. Price consecutively broke below the Bollinger middle and lower bands, forming an accelerated downward structure. After finding its first clear stabilization near 4402, the market has entered a phase of technical recovery after an oversold condition. However, MA10 and MA20 remain sharply pressing downward, indicating that this rebound is more of a correction within the trend, rather than a true reversal.
✅ On the 1-hour timeframe, after bottoming at 4402, price formed a step-like rebound. However, the rebound has consistently been capped by moving averages, with multiple rejections near MA20, forming a weak consolidation rebound structure. The Bollinger Bands have begun to contract, suggesting that bearish momentum has eased into a consolidation phase, but there is still no clear sign of bullish control.
✅ Combining both timeframes, the market is currently in an oversold corrective consolidation within a broader bearish trend. As long as price fails to reclaim and hold above 5000, the overall structure remains defined as a post-top corrective cycle. The current movement appears more like preparation for the next directional move rather than a trend reversal.
🔴 Resistance: 4880–4950
🟢 Support: 4520–4580
✅ Trading Strategy Reference:
At this stage, the primary approach is to sell on rebounds, with light long positions considered only near lower support zones. Patience is required while waiting for key resistance levels.
🔰 Short Strategy (Sell on Rebound)
👉 Entry Zone: 4880–4920, scale into short positions
🎯 Target 1: 4700
🎯 Target 2: 4550
🎯 Extended Target: 4400
📍 Logic:
This area is a confluence resistance zone formed by the 4-hour moving averages and previous structural breakdown levels. Rebounds into this region are likely to face renewed selling pressure.
🔰 Long Strategy (Oversold Rebound)
👉 Entry Zone: 4520–4580, light long positions only
🎯 Target 1: 4700
🎯 Target 2: 4850
🎯 Extended Target: 4950
📍 Logic:
This zone aligns with previous lows and the lower Bollinger Band, creating a technical support confluence suitable for a rebound — but only as a corrective move.
✅ Risk Control Reminders
👉 Do not chase rebounds; patiently wait for resistance levels
👉 Long positions are for corrective rebounds only and should be light in size
👉 Short positions align with the broader trend and offer better potential
👉 In extreme volatility, strict stop-loss discipline is essential.

NIFTY : Trading levels and plan for 03-Feb-2026📘 NIFTY Trading Plan – 3 Feb 2026
(Timeframe: 15-Min | Instrument: NIFTY 50 | Educational Use Only)
🔑 Key Intraday Levels (From Chart)
🟢 25,985 – Higher Timeframe Resistance
🟢 25,569 – 25,696 – Last Intraday Resistance / Consolidation Zone
🟢 25,266 – Opening Resistance (Flat Opening Case)
🟢 24,901 – Opening Support (Gap-Down Opening Case)
🟢 25,081 – Current Reference Price Area
🧠 Market Structure & Price Psychology
NIFTY witnessed a sharp intraday breakdown followed by a recovery bounce, indicating short-covering from lower levels.
However, price is still trading below major resistance zones, meaning trend reversal is not confirmed yet.
👉 Tomorrow’s direction depends on acceptance or rejection near opening levels, not assumptions.
🚀 Scenario 1: GAP UP Opening (100+ Points)
(Opening near / above 25,180–25,220)
🧠 Psychology
A gap up after a sharp fall is usually driven by short covering, but higher zones still carry strong selling pressure.
🟢 Bullish Plan
🔵 If price sustains above 25,266 on a 15-min closing basis
🔵 Expect upside towards 25,569 – 25,696
🔵 Break & acceptance above this zone can open path towards 25,985
🔴 Rejection Plan
🔴 Failure near 25,569 – 25,696
🔴 Expect consolidation or pullback towards 25,266
📌 Why this works
Only acceptance above resistance confirms fresh buying, not emotional gap-up trades.
➖ Scenario 2: FLAT Opening
(Opening between 25,050 – 25,150)
🧠 Psychology
Flat openings indicate balance between buyers and sellers. Market usually expands after testing resistance.
🟢 Upside Plan
🔵 Hold above 25,266
🔵 Targets: 25,569 → 25,696
🔴 Downside Plan
🔴 Failure to cross 25,266
🔴 Price may retest 24,901
📌 Key Note
🟠 Expect range-bound moves until breakout confirmation.
🔻 Scenario 3: GAP DOWN Opening (100+ Points)
(Opening near / below 24,901)
🧠 Psychology
Gap down reflects renewed fear, but strong supports often trigger short covering rallies.
🟢 Bounce Setup
🔵 If 24,901 holds on 15-min basis
🔵 Expect pullback towards 25,081 → 25,266
🔴 Breakdown Setup
🔴 Clean break below 24,901
🔴 Downside momentum can extend rapidly (no nearby support)
📌 Why this works
Supports either produce fast bounces or accelerated breakdowns—confirmation is critical.
🛡️ Risk Management Tips (Options Traders)
🟢 Trade only after first 15-min candle confirmation
🟢 Prefer option spreads near resistance zones
🟢 Avoid aggressive buying in gap-up opens ❌
🟢 Risk maximum 1–2% of capital per trade
🟢 Book partial profits at pre-defined levels
🟢 Discipline > Prediction 📌
🧾 Summary & Conclusion
📌 Market remains volatile and reactive
📌 25,266 & 24,901 are the most important intraday levels
📌 Break above 25,696 needed for bullish continuation
📌 Trade price reaction, not market noise 📈
⚠️ Disclaimer
This analysis is strictly for educational purposes only.
I am not a SEBI registered analyst.
Please consult your financial advisor before taking any trades.
Market investments are subject to risk.

UPL: The Post-Budget Recovery Play!UPL is currently in a high momentum phase. Following a volatile Budget Day where the broader market crashed, UPL staged a powerful recovery on February 2, surging over 5-6% to hit an intraday high of ₹706.90.
This rally was fueled by Q3 FY26 results that beat street estimates, featuring 12% revenue growth (₹12,269 Cr) and a massive ₹2,553 Cr reduction in net debt. This fundamental strength provides the "fuel" for the technical breakout you've identified.
The stock is now testing the CRITICAL DECISIVE ZONE: ₹699 - ₹708.50.
Historically, this is the "Battleground Zone" where the trend decides its next big move and price spent most of its time.
✅ SENTIMENT LEVEL: ₹705 is the psychological line in the sand. Buyers are fighting hard to hold this territory.
🚀 BULLISH TRIGGER: A strong trade above ₹708.50 clears the path for a target of ₹735+.
⚠️ BEARISH TRIGGER: If it fails to hold and breaks below ₹695, we might see a slide toward ₹671.
Why the hype? Fresh Q3 results beat estimates + Debt reduction = Strong fundamental backing for this technical move. Keep it on your radar! 📈

Continuation of the Liquidity Grab concept I make educational content videos for trading, this will be a continuation of what happens after a liquidity grab in the markets
No Bias - No predications - only telling concepts and information on general trends of index

ABCapital -> A Clear opportunity.Currently playing larger wave 3.
Played all earlier sub waves perfectly.
Currently playing sub wave C of 4 of 5 of 3.
Well aligned with fib ratio's.
Also clear divergence in RSI.
Minimum target of 335/-(Around 5%) is very much possible in short term.

upcoming movesBTC is very perfect blend of manmade moves...
I can see the chart patterns repeat in itself and hence i have predicted the move like this..
in BTC also wave 5 is extended like in metals ..
get ready for 63000/52000 before a long halt

Symmetrical Triangle Masterpiece : Multi-Layout W,DtfStep into this dynamic multi-layout window opened right in front of you—a split-screen showcase of pure price action artistry.
Left Side: Weekly Timeframe
Here, a symmetrical triangle (a classic continuation or reversal pattern formed by two converging trendlines of equal slope) takes center stage. Framing it are a green uptrend line (connecting higher lows for bullish structure) and a red downtrend line (linking lower highs for bearish pressure), creating a tightening coil of market indecision. A subtle white counter-trend line (acting as dynamic support/resistance opposing the main trend) adds layers of geometric elegance, hinting at its heightened significance when viewed on lower timeframes.
Right Side: Daily Timeframe
Flipping to the daily chart reveals how this white line shines as a pivotal counter-trend barrier, interacting seamlessly with intraday swings. Multi-timeframe analysis (comparing higher timeframe structure with lower timeframe details for confluence) illustrates the fractal beauty......how weekly patterns cascade perfectly into daily price action without a single forecast or bias.
This is markets at their most poetic: old-school chart patterns and trendlines weaving symmetry across scales. No predictions, just appreciation for the elegance.
Disclaimer: This post is for educational and illustrative purposes only, highlighting historical price action and chart patterns. It does not constitute financial advice, trading recommendations, or predictions of future market movement. Always conduct your own research and consult a professional advisor

Sharda Cropchem - Need to sustainSharda Cropchem :
Need to close above 1200 levels for a decisive breakout (earlier rejections)
Currently retested and bounced from previous support

RSI OVER SOLDHi
Looking good for
Rain over sold and stock already discounted on cigarette tax news
Target of 384 in 3 months time frame
Target of 435 in 6 months time frame
Target of 482 in 15 months time frame
Tax on cigarette will pass to consumer, no impact on profit

Sundaram Finance - Breakout PossibilitySundaram Finance :
Possibility of resistance breakout
Need to close above 5500 strongly, previous rejections around this range.

Repeated Kumo Breakdowns on NIFTY – 2H LTFThe budget-day price action has resulted in yet another Kumo breakdown on the NIFTY 2H timeframe.
Does this add more weight to the already active bears ?
Or is this an opportunity for bulls to attempt base formation near potential bearish exhaustion?
Let’s evaluate the structure.
What would materially improve the odds for Bulls?
- A decisive 2H close above the 0.786 Fibonacci retracement of the budget-day fall.
This would open up the possibility of price action retesting the Kumo bottom.
- A decisive 2H close above the Kumo break candle, indicating improving bullish strength and the ability to penetrate deeper into the cloud.
- A decisive 2H close above the Kumo top, which would signal structural negation of the current Kumo breakdown.
What would materially improve the odds for Bears?
- A decisive 2H close below the 0.618–0.786 Fibonacci zone, preferably with upper wicks, indicating rejection from resistance.
- A decisive 2H close below both Tenkan and Kijun, which are already positioned below the Kumo bottom.
- A decisive 2H close below the recent 2H swing low, confirming continuation beyond equilibrium.
Price action is once again at an important decision-making zone.
Let’s wait and watch how the structure resolves.
This is an educational market-structure analysis and not trading advice.

CAMPUS Activewear – Major Trend Reversal & Structural Breakout🚀 CAMPUS Activewear – Major Trend Reversal & Structural Breakout
By Ayushi Shrivastava | NISM Qualified Research Analyst
After a prolonged consolidation phase, CAMPUS Activewear is showing signs of a high-quality trend reversal supported by strong price structure and volume expansion.
📈 Price Action & Structure
Multi-Month Trendline Breakout:
Price has decisively broken above a long-term descending trendline that acted as resistance since 2022. This signals a potential change in market character.
Higher High Formation:
The breakout candle structure suggests fresh demand entering after accumulation.
Above Key Price Zones:
Price is sustaining above important reference levels, indicating buyers are in control.
🔊 Volume Confirmation
Volume expansion is significantly higher than recent averages, confirming that the breakout is participation-driven, not a low-liquidity move.
Such volume behavior often aligns with institutional positioning rather than retail noise.
📊 Fundamental Context (Supportive, Not a Trigger)
TTM EPS Growth: +27.06% YoY, reflecting operational strength.
Valuation Note:
Stock trades at a premium valuation versus sector averages, so price discipline and risk management are essential.
🎯 Key Levels to Track
Immediate Resistance: ₹307
Strong Support Zone: ₹245 – ₹250
As long as price holds above the breakout zone, the bullish bias remains intact.
🧠 Personal View
The structure and volume combination make this a technically strong setup, but due to valuation premium, this is best approached with a planned trade and strict stop-loss, not blind chasing.
⚠️ Educational post only. Not a buy/sell recommendation. Markets involve risk—trade responsibly.
