EURUSD 1W T/F ANALYSIS-----
eurusd 1w t/f analysis----- center portion is a arc and it`s breakout so arc of previous marked demand can measure still demand are remaning so we can go with demand on lower t/f ok /
larger t/f are a direction and lower t/f become for entery purpose
Trend Analysis

What next on nifty ?NSE:NIFTY As per price action concept, context is bearish there is no doubt....
60% chances is market will resume it trend and 40% is it will reverse,
if it remians sideways probablity goes 50-50 for both bull and bears

inverser head and shoulder stock is showing inver head and sholder
prise closed above vwap
rsi is crosing 20 ema good position

Maruti Suzuki - A Solid OpportunityMaruti Suzuki has entered into short term bearish mode.
It is down nearly 7% from the top in last 2 weeks, confirming a strong downside momentum.
Structure: Playing Wave C, of 4 in short term.
Trend: Bearish
Also a clear divergence in RSI indicator at the top
Trade Setup: Short
Target: 15270/-
StopLoss: 16500/-
Notes
This is a classic Elliot wave pattern. Wave C generally moves fast.
⚠️ Disclaimer: Not financial advice. Manage risk properly.

Paytm - Is a Bearish Barrier Triangle Signaling a Deeper CorrectLooking at the 4H chart for One 97 Communications Ltd. (Paytm), Am seeing a classic consolidation pattern following a strong impulsive move. After completing what appears to be a 5-wave sequence (blue labels), the price action is now squeezing into a Barrier Triangle structure—a specific Elliott Wave pattern that often precedes a sharp "thrust" in the direction of the larger trend.
Wave B did an exactly 0.786 retracement.
Below 1260, its gonna be a straight fall to 1100 odd.
RSI already indicating a clear breakdown.

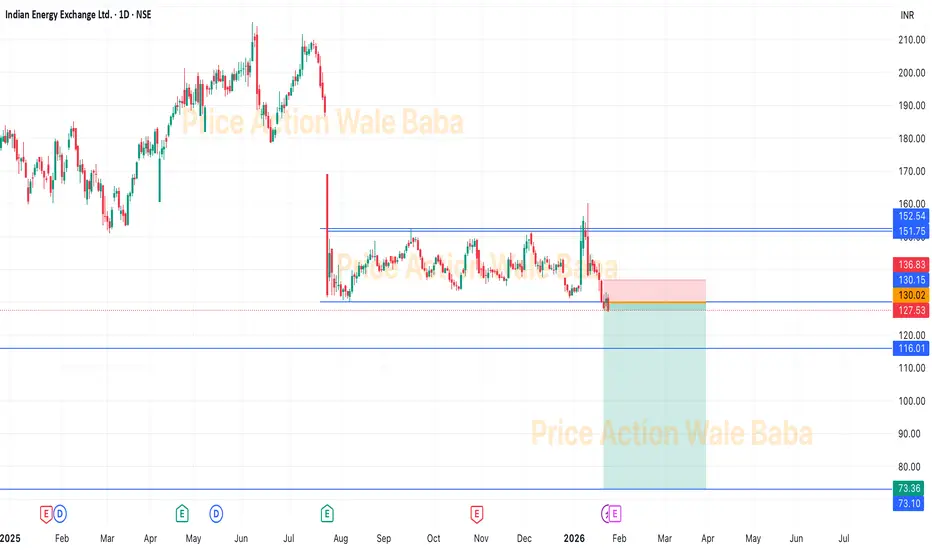
IEX - Box BreakoutIEX was consolidating in the box from the long time and now it's out of the box.
It is good to short IEX and hold for the target of 115-110
Although, you can keep in the hold for the target of 80-75 as we know government policy are comes against IEX's monopoly.
short trade📊 Market Read (NIFTY Futures – 5 min)
Strong bearish impulse earlier → confirms bearish market structure
Current price is pulling back slowly (weak bullish candles)
Price is below EMA ribbon / MAs → trend still down
This is a pullback → continuation setup, not a reversal
Bias: SELL (short) ✅
🔴 Best SELL Entry Zones (High Probability)
Primary Sell Zone (Preferred)
25,500 – 25,515
Reason:
Pullback into EMA ribbon
Previous minor support → now resistance
Liquidity resting above small equal highs
➡️ Wait for:
Bearish rejection candle
OR small bullish → strong bearish engulf
Aggressive Sell
25,490 – 25,495
Only if:
Weak pullback
Immediate bearish continuation
⚠️ Risky, reduce quantity
❌ Invalidation / Stop Loss
SL above 25,535
Clear break + close above EMA ribbon = bearish idea invalid
🎯 Targets (As marked on your chart)
TP 1
25,437
Partial booking (50–60%)
TP 2
25,411
Full exit / trail aggressively

Head & shoulder patternLast week Qpower formed h&s pattern on weekly time frame and breaks the neck line with good volumes.
These views are only for educational purposes.

V2 Retail - Multibagger Stock not to miss for 5x ROIV2 Retail - Multibagger Stock not to miss for 5x ROI in coming 7-8 Years.
Fundamentals:
Company has delivered good profit growth of 84% CAGR over last 5 years
Company has delivered good profit growth of 40% CAGR over last 10 years
Median sales growth is 33.3% of last 10 years
Technical:
Stock has recently broken from Monthly CUP Pattern. Stock is in continuous uptrend.
LTP - 1826
Targets - 9000+
Timeframe - 7-8 Years
Happy Investing.

ETH long term chartETHUSD – Weekly Structure
• Pattern: Long-term range / re-accumulation (Wyckoff-style)
• Trend bias: Bullish (higher lows since 2023)
• Volatility compression → expansion coming
Key Levels
• Resistance: $3,800–4,100
• Support: $1,400–1,600
Bullish Breakout
• Trigger: Weekly close above $4,100 + volume
• Measured move target:
– $5,500–6,000
– $7,200–7,800
– Extension: $9,500–10,000
Bearish Invalidation
• Weekly close below $1,400
• Downside support: $900–1,100
Summary
• ETH is coiling inside a macro range
• Break above range likely leads to strong multi-year expansion

Canara Bank daily chartThe chart pattern Upward Parallel channel is seen .
Price is hovering around 20 and 50 EMA. Near term (next few days): Expect consolidation around 150–156.
A breakout above 156.80 could target 160–162, while a drop below 150 might lead to testing 148.
Key levels:
Support: 150 / 148.
Resistance: 156.80 / 160.
The View: If Price keeps hovering around moving avgs. consolidation is expected .More than average buying must be seen for price to move above in parallel channel.

Nifty - Weekly review Jan 27 to Jan 30.Last week, the price broke the very important support at 25300, and now it is testing 25000, which is another crucial level. Further weakness in the price can lead to testing the next important level at 24460 - 24520. As per the daily chart, the price is bearish.
in.tradingview.com
Buy above 25040 with the stop loss of 24980 for the targets 25080, 25140, 25200 and 25260.
Sell below 24880 with the stop loss of 24940 for the targets 24840, 24760, 24720, 24660 and 24600.
Always do your analysis before taking any trade.

NIFTY- Intraday Levels - 27th Jan 2026Monthly expiry and also trade deal news may impact on market movements so I think market can become volatile
If NIFTY sustain above 25053/95 above this bullish then 25488/501 then 25175/81/97 strong level above this more bullish then 25224/30/245/56 very very strong level above this wait more levels marked on chart
If NIFTY sustain below 25996/89 strong level below this bearis then around 25915 then 25857/41 then25806/744 very very strong level below this more bearish below this wait more levels marked on chart
My view :-
"My viewpoint, offered purely for analytical consideration, The trading thesis is: Nifty (bearish tactical approach: sell on rise)
However don't have a clear view due to trade deal news this may impact the movement of market.
This analysis is highly speculative and is not guaranteed to be accurate; therefore, the implementation of stringent risk controls is non-negotiable for mitigating trade risk."
Consider some buffer points in above levels.
Please do your due diligence before trading or investment.
**Disclaimer -
I am not a SEBI registered analyst or advisor. I does not represent or endorse the accuracy or reliability of any information, conversation, or content. Stock trading is inherently risky and the users agree to assume complete and full responsibility for the outcomes of all trading decisions that they make, including but not limited to loss of capital. None of these communications should be construed as an offer to buy or sell securities, nor advice to do so. The users understands and acknowledges that there is a very high risk involved in trading securities. By using this information, the user agrees that use of this information is entirely at their own risk.
Thank you.

Minda Corp | Post-Rally Consolidation | Caution ZoneMinda Corp has delivered a massive long-term uptrend, but price is now showing loss of momentum near the highs, forming a contracting / volatile structure.
This phase typically indicates distribution or extended consolidation, not fresh trend initiation.
🔍 Technical Read:
• Strong multi-year rally already played out
• Price struggling near overhead supply zone
• Lower highs forming inside a volatile range
• Increased volatility → risk expanding
📈 What This Means:
• Not an ideal fresh long zone
• Suitable for partial / full profit booking
• Fresh entries only after clear range breakout with volume
• Breakdown may lead to deeper mean reversion
📌 Status: ⚠️ Extended & Deciding Zone
👉 Protect profits. Wait for clarity.
⚠️ Educational view only. Not a recommendation.
#MindaCorp #ProfitBooking #DistributionPhase #StockMarketIndia #TechnicalAnalysis #SwingTrading #RiskManagement #PriceAction

BEL | Range-Bound Structure | Deciding ZoneBharat Electronics is currently trading inside a rising consolidation pattern, with price respecting both ascending trendline support and overhead supply zone.
Momentum has cooled after the prior rally, indicating a pause phase rather than trend reversal.
🔍 Technical Observations:
• Higher-low structure intact
• Price compressing between trendline support & declining resistance
• Volatility contraction → expansion likely next
• Volume neutral – waiting for trigger
📈 What to Watch:
• Break & close above range → Trend continuation
• Break below trendline → Deeper pullback / retest zone
📌 Current Status: ⚖️ Deciding Zone
👉 Patience > Prediction
⚠️ Educational view only. Not a buy/sell recommendation.
#BEL #BharatElectronics #DecidingZone #RangeBound #StockMarketIndia #TechnicalAnalysis #PriceAction #SwingTrading

Next week: Will gold listen to the Fed… or the White House?🔎 Context
Next week could be highly volatile as monetary policy and geopolitics converge.
Donald Trump signaled a potential 100% tariff on Canadian goods if Canada moves closer to trade deals with China—raising trade-war risks.
At the same time, military assets are being deployed en masse around Iran, heightening concerns that tensions could escalate.
👉 Safe-haven flows may return, with gold potentially opening the week gap-up and early buying.
🧠 Quick take
Primary trend: Bullish
At elevated prices: a short, sharp shakeout is possible to absorb liquidity
No top/bottom calls—watch price reactions at key zones
📌 Key levels to watch
🟢 Supports: 4920–4900 | 4890–4882 | 4850–4830 | 4660–4640
🔴 Observation resistances: 5006–5030–5090 | 5110–5115 | Current ATH
🎭 Weekly scenarios (reference only)
Early week: Gap-up / early push
Pre-FOMC: Chop & liquidity sweep
Then: Deep shakeout or base-building and continuation
👉 Distribution at the top—or just a pause before the next leg higher?

USDJPY 4HR T/F ANALYSIS -----
usdjpy 4hr t/f ----- breakdown of curve support which name is black mind curve after breakdown we can measure previous pattern now current scenario previous supply can measure so we can go with trend into down side until supply will not complete /
after supply complete we can see any positive candle on retesting area then we can see demand on retesting then we can go with trend _ remember trend are over all bullish ok ----

Home First Finance: When the Hero Starts Losing StrengthOnce upon a time, this stock was a market hero.
Strong rallies, higher highs, and buyers ready to step in on every dip.
But every hero goes through a phase…
when the energy fades and the story changes.
That phase seems to have arrived for Home First Finance.
📉 The Plot Twist:
After a powerful rally, the stock entered a distribution phase.
Buyers started getting exhausted.
Sellers slowly took control.
Then the structure flipped.
Lower highs. Lower lows.
And a clean falling trendline confirmed who’s in charge now.
— Ayushi Shrivastava
NISM-Certified Research Analyst
⚠️ Disclaimer:
This analysis is for educational and informational purposes only and should not be considered as investment advice or a recommendation to buy or sell any security.
Market investments are subject to risk. Past performance is not indicative of future results.
Please consult your financial advisor before taking any trading or investment decisions.
The bounce we’re seeing today?
It doesn’t look like a comeback.
It looks more like a pause to catch its breath.
📍 Current Scene:
Price has taken temporary support near the 1030–1050 zone
A small relief bounce has emerged from this area
But the falling trendline is still pressing from above

Cummins India cmp 3930.40 by Daily Chart viewCummins India cmp 3930.40 by Daily Chart view
- Support Zone 3885 to 3965 Price Band
- Resistance Zone 4165 to 4250 Price Band
- Support Zone reversal observed for stock price
- Volumes need to increase to push price on upside trend
- Price consolidation seen within 3885 to 4110 since mid Jan 2026

Gold's Pathway to $8000/oz by Q4 FY2027Many of us may not have realized it, but Gold ( TVC:GOLD ) has been in a bull market ever since it bottomed out at the end of 2015. This implies that, if we were to believe the historical bull market for Gold runs for 144 months (12 years), the current run might end in Q4 (Oct-Dec) of 2027.
And that may come with Gold climbing to the price of $8000/oz before cooling off. And, as always, it will be a blow-off top with significant volatility.

Dhampur Bio Organics cmp 95.76 by Daily Chart viewDhampur Bio Organics cmp 95.76 by Daily Chart view
- Support Zone 75 to 85 Price Band
- Resistance Zone 95 to 105 Price Band
- Resistance Zone holding strong since a year from January 2025
- Head & Shoulders around Support Zone and last Rounding Bottom
- Heavy Volumes surge seen last week Friday by demand based buying
- Bullish Rounding Bottoms with good consolidation around Support Zone
- Falling Resistance Trendlines Breakout with Rising Support Trendline been respected

GBPJPY Weekly Outlook: Short Retest Before Bullish Push to 216.0GBPJPY shows strong bullish momentum after recent highs around 213.92, but expect a minor short recovery first. Market likely retests support at 210.44 or deeper to 208.00 before resuming uptrend targeting 216.00 next week. Chart highlights key levels with recent price action from ~210.84 lows.
Key Levels
Support: 210.44 (immediate), 208.00 (stronger retest zone)
Resistance: Recent high ~214, then 216.00 target
Bullish Bias: Above 210.63 for rally continuation
Trade Setup (Next Week)
Wait for dip to 210.44-208.00 on pullback.
Buy on bullish reversal (e.g., hammer candle, RSI oversold).
Targets: 214 → 216. Stop below 208.
Risk: Break under 208 shifts bearish to 205.

MACD Pullback Entry Framework📈 MACD Pullback Continuation & Momentum Reset Framework
This chart demonstrates how MACD can be used effectively within a strong trend by focusing on pullback entries, not late breakouts or tops.
Unlike using MACD as a standalone buy/sell signal, this framework combines:
Trend direction
Price structure
Momentum reset below the zero line
This approach is designed to trade with the trend, not predict reversals.
⸻⸻⸻⸻⸻⸻⸻⸻⸻⸻
📊 Key Observations
1️⃣ Higher-Timeframe Trend Filter (Directional Bias)
A valid bullish environment is defined by:
Price trading above the 200 EMA
Structure holding above key support zones
This confirms higher-timeframe bullish control.
Only long setups are considered in this phase.
2️⃣ Pullback Phase (Momentum Reset)
During an uptrend:
Price pulls back into a support zone
MACD moves below the zero line
⚠️ Important:
MACD moving below zero does NOT mean trend reversal in this context.
It represents a momentum reset within a bullish trend.
This phase often shakes out weak longs and prepares the market for continuation.
3️⃣ Entry Trigger (Bullish Momentum Shift)
The entry signal appears when:
Price reacts positively from support
MACD forms a bullish crossover
Crossover occurs below or near the zero line
This indicates:
Selling pressure has weakened
Bullish momentum is re-entering
Trend continuation probability increases
4️⃣ Why MACD Below Zero Works Better
In strong uptrends:
MACD crossovers above zero often occur late
MACD crossovers below zero align with pullback completion
This improves:
Risk-to-reward
Entry timing
Trade durability
MACD here acts as a timing tool, not a trend signal.
5️⃣ Trend Continuation Logic
The strongest continuation setups follow this sequence:
Price above 200 EMA
Pullback into support
MACD below zero (reset)
Bullish MACD crossover (trigger)
This allows traders to:
Avoid chasing highs
Enter during controlled pullbacks
Stay aligned with dominant trend pressure
6️⃣ What Invalidates the Setup?
The framework weakens when:
Price closes below the 200 EMA
Support structure breaks decisively
MACD remains weak despite price bounce
Only structure failure, not a single MACD signal, invalidates the bias.
⸻⸻⸻⸻⸻⸻⸻⸻⸻⸻
📊 Chart Explanation
Symbol → NSE:NESTLEIND
Timeframe → 2H
This chart highlights:
Bullish trend confirmed above 200 EMA
Controlled pullback into support
MACD dipping below zero (momentum reset)
Bullish MACD crossover triggering continuation
Expected Sequence:
Trend → Pullback → Momentum Reset → Trigger → Continuation
MACD excels at timing entries, not defining trend direction.
⸻⸻⸻⸻⸻⸻⸻⸻⸻⸻
📘 How to Use MACD Effectively
🔹 Trend-Following Use
Trade only in the direction of the higher-timeframe trend
Prefer MACD signals below zero in uptrends
Ignore MACD crossovers against the trend
🔹 Risk Management Tip
Use price structure or support zones for stop placement
MACD provides confirmation, not risk levels
🔹 Common Mistake
❌ Using MACD crossovers without trend context
✅ Using MACD as a pullback timing tool
⸻⸻⸻⸻⸻⸻⸻⸻⸻⸻
⚠️ Disclaimer
📘 For educational purposes only
🙅 Not SEBI registered
❌ Not financial or investment advice
