Symphoney at 10 years supportSymphony is retesting long-term support at the ₹750–₹800 zone, a key area that has held multiple times over the past decade. The stock has bounced, forming a strong bullish green candle on the weekly chart.
Trend Analysis

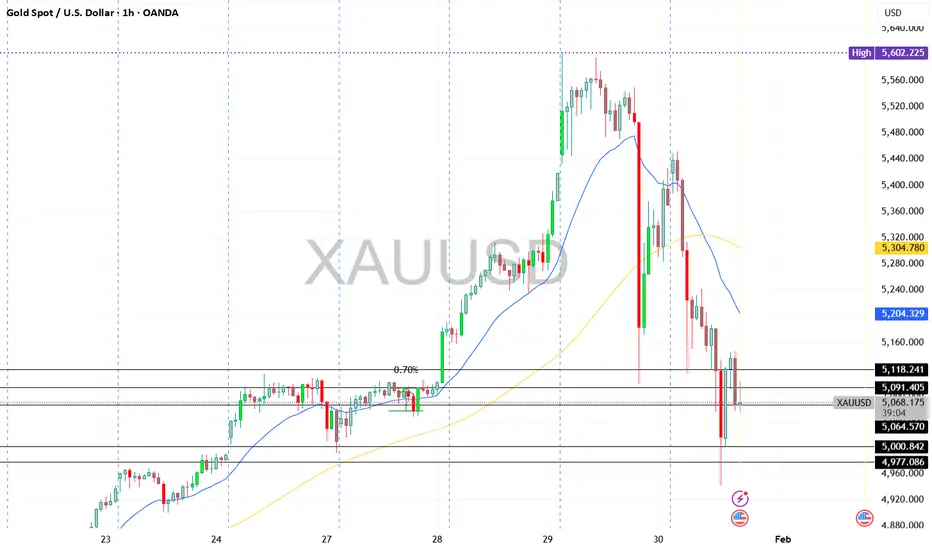
XAUUSD (Gold) – Bullish ViewGold is showing a bullish reaction from the Fibonacci demand zone (0.786 area). Price respected support and is attempting a reversal. Momentum looks favorable for an upside move.
📌 Buy Zone: 5,000 – 5,020
🎯 Target: 5,240 – 5,250
🛑 Stop Loss: 4,940
📊 Logic:
• Strong support near 0.786 Fibonacci
• Rejection from lower levels
• Risk–reward setup is favorable
⚠️ Trade with proper risk management.
📉 Not financial advice – for educational purposes only

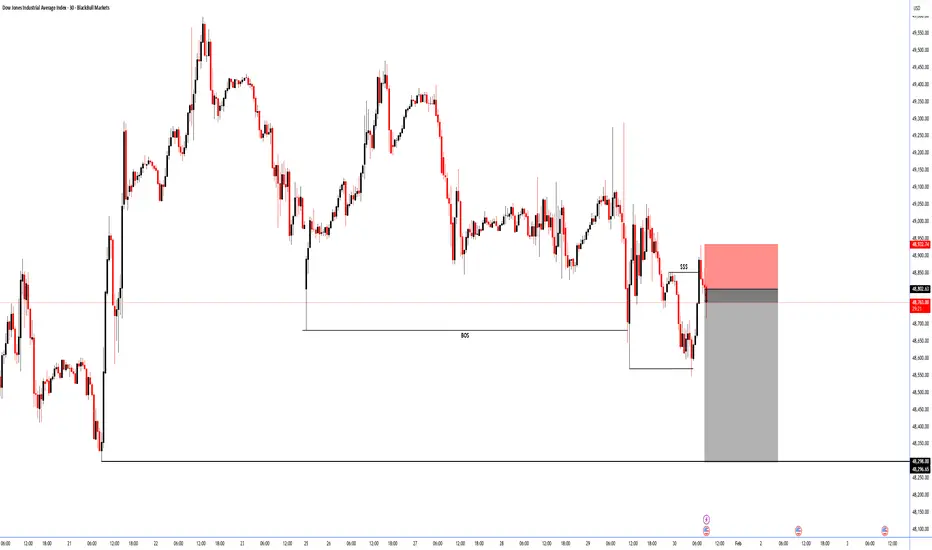
US30Greetings!
Welcome traders.
By choosing to "Follow", you can stay updated with the latest information promptly. Kindly consider clicking "Boost" as well.
Wishing you a pleasant day.
🎯Risk 1% per trade
🎯Risk management is the key to be successful in this game
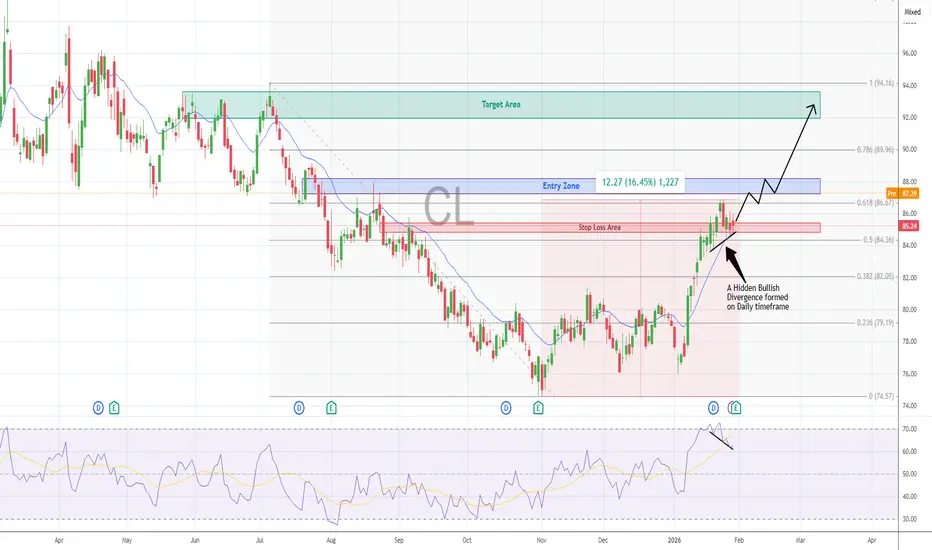
Colgate Palmolive Analysis* The primary trend of the stock is bullish, although prices witnessed a bearish retracement for over a year (Sep 2024 - Oct 2025)
* Since strong Q3 earnings (Oct 2025), a bullish pull-back could be seen, and prices rose more than 16.5% in over +3 months
* Recently prices tested fib level 0.618 (86.67) and started consolidating between fib level 0.618 & 0.50.
* Today's strong earnings results of the company for Q4 might drive the stock prices higher.
* The stock is expected to open with a gap-up near the Entry zone, and rise higher towards the Target area
Technical Indicators
- The prices are existing at the support of the 21 EMA
- A hidden bullish divergence is also visible, driving prices higher
Q4 & Annual Earnings
- Colgate-Palmolive beat estimated earnings by 4.0%, reporting an EPS of $0.95 versus an estimate of $0.91.
- Revenue was up $286.00 million from the same period last year.
- EPS, although beat estimates, but fell 106% from the previous quarter, and turned negative for the quarter
- EPS for the financial year also fell 25% to $2.63 from $3.51
GOLD MARKET VOLATILITY - REALITY CHECK Noise is high around XAUUSD with headlines like “trillions wiped out” and “gold crashing”.
Let’s keep it factual.
Gold is volatile due to profit-booking after a historic rally, geo-political uncertainty, and US policy expectations.
This is correction + consolidation, not a confirmed crash.
💡 “Trillions wiped out” = notional intraday value swings, not permanent losses.
Key Levels to Watch (XAUUSD)
Resistance: 5250 – 5300
Support: 5080 – 5000 (major demand zone)
Below 5000: Only if volatility expands with strong volume
Key Takeaway for Traders 🎯
High volatility ≠ clear direction
Avoid revenge or blind trades
Let price settle → trade with risk control
🛑 Staying out is also a strategy
📊 Focus on Forex / Crypto / Indices if Gold is unstable
Risk management > FOMO
XAUUSDGreetings!
Welcome traders.
By choosing to "Follow", you can stay updated with the latest information promptly. Kindly consider clicking "Boost" as well.
Wishing you a pleasant day.

FORTIS Near Strong Support – Bounce PossibleFortis has corrected from the top and moved down into a strong support area.
This trendline has acted as support before, and once again price is reacting positively from here.
Selling pressure is slowing down and buyers are starting to step in.
As long as this support holds, a bounce towards the upper resistance zone looks possible.
If support breaks, then further downside can happen.
For now, this is an important level to watch.

Nestlé India – Strong Uptrend with Healthy ConsolidationNestlé India continues to respect a well-defined rising channel, showing clear strength in its overall structure. After a strong upward move, the stock has entered a brief consolidation phase, forming a tight range while holding above key support levels.
This kind of price behavior usually reflects healthy profit booking rather than weakness. Buyers are still in control as long as the price stays within the channel and above the recent support zone.
If the structure remains intact, the trend favors further upside in the coming sessions, with higher levels likely to be tested gradually.
Overall, the stock is showing stability, strength, and controlled pullbacks — all signs of a strong trending market.

BANK NIFTY 15m – Liquidity Levels in FocusThe marked levels are derived from prior session liquidity and repeated price reactions.
Price has continued to respect these zones, confirming them as important reference areas.
For the next session, price behavior around these levels will be key.
Acceptance above or rejection below will help define intraday bias and potential continuation or retracement scenarios.

XAUUSD (Gold) – 4H Chart Analysis (Short & Clear)XAUUSD (Gold) – 4H Chart Analysis (Short & Clear)
Market Structure
Overall strong uptrend intact (higher high–higher low).
Recent move shows sharp rally → profit booking / pullback.
Current price ~5127, bounced from below 5000 area.
Key Levels
Resistance:
5250–5280 (minor)
5450–5600 (major supply zone / previous top)
Support:
5050–5000 (important demand zone)
4850–4800 (strong swing support)
Price Action Insight
Big red candles after top = healthy correction, not trend reversal yet.
Last candle shows rejection from lows → buyers still active.
As long as 5000 holds, bias remains bullish.
Buy-side View
Buy on dip near 5050–5000 with confirmation.
Safer buy if market reclaims & holds above 5200.
Targets (short-term): 5250 → 5400
Targets (swing): 5500–5600
Bearish Scenario (Only if)
Clean 4H close below 4950 → deeper correction possible
Downside then: 4850 → 4700
Conclusion
📈 Trend = Bullish
🔁 Phase = Pullback / consolidation
🧠 Best strategy = Buy dips, avoid panic selling

Part 1 Intraday Institutional Trading Types of Option Traders Use
1. In-the-Money (ITM) Options
High intrinsic value, costlier, but more stable.
2. At-the-Money (ATM) Options
Strike price closest to spot price; very popular for intraday.
3. Out-of-the-Money (OTM) Options
Cheap but time-decay heavy. High risk, high reward.

silver trendline Although silver is just not dependent on price action but lot more of geo political tensions and unknowns,there is achance that silver bounces back from here

Part 5 Advance Option Trading Strategies Risks in Option Trading
Options offer high rewards, but also involve risks if not used carefully.
1. For Option Buyers
High time decay (theta loss daily)
Need strong, fast movement
2. For Option Sellers
Unlimited risk (if naked selling)
High margin requirement
Volatility spikes kill profits
3. Liquidity Risk
Wide bid-ask spreads reduce profit potential.
4. Event Risk
News announcements can cause unpredictable moves.

STAR Price Action1. Set up - Breakout
2. Trend - Bullish
3. Entry is late by a day, but missed this chart yesterday, so RR is reduced with todays gain
4. Probable rounding pattern formation

BUY TODAY SELL TOMORROW for 5% - BTST STOCK OPTIONyesterday
DON’T HAVE TIME TO MANAGE YOUR TRADES?
- Take BTST Stock Option trades at 3:25 pm every day
- Try to exit by taking 4-7% profit of each trade
-Resistance Breakout in ABB
BUY TODAY, SELL TOMORROW for 5%

BUY TODAY SELL TOMORROW for 5% - BTST STOCK OPTIONDON’T HAVE TIME TO MANAGE YOUR TRADES?
- Take BTST Stock Option trades at 3:25 pm every day
- Try to exit by taking 4-7% profit of each trade
-Cup and Handle Breakout in NESTLEIND
BUY TODAY, SELL TOMORROW for 5%

BUY TODAY SELL TOMORROW for 5%DON’T HAVE TIME TO MANAGE YOUR TRADES?
- Take BTST trades at 3:25 pm every day
- Try to exit by taking 4-7% profit of each trade
- SL can also be maintained as closing below the low of the breakout candle
Now, why do I prefer BTST over swing trades? The primary reason is that I have observed that 90% of the stocks give most of the movement in just 1-2 days and the rest of the time they either consolidate or fall
Resistance Breakout in MTARTECH
BUY TODAY SELL TOMORROW for 5%

XAUUSD – H2 Technical AnalysisXAUUSD – H2 Technical Outlook: Short-Term Sell Pressure as Liquidity Gets Cleared | Lana ✨
Gold is showing signs of short-term weakness after an aggressive upside expansion. Price action suggests the market may continue to move lower in the near term, not as a trend reversal, but as a liquidity-driven correction within a broader bullish structure.
At this stage, the focus shifts from continuation to how price behaves while liquidity is being taken below structure.
📈 Market Structure & Price Behavior
The recent vertical rally has left the market overextended, making a corrective phase technically healthy.
Price has broken below short-term support and is now trading under a descending corrective trendline, signaling short-term bearish pressure.
This type of structure often develops when the market needs to clean buy-side positions before rebuilding for the next leg.
While the higher-timeframe trend remains bullish, the intraday bias has shifted to corrective / bearish until liquidity objectives are met.
🔍 Key Liquidity Zones on the Chart
Short-term sell zone: the descending trendline near current price As long as price reacts below this trendline, rallies are more likely to be sold.
Scalping buy liquidity: around 5050–5070 This area may generate temporary bounces, but reactions here should be treated as short-term only.
Key bullish order block: 4825 – 4830 A critical zone where stronger buyer participation may appear if the sell-off extends.
Major swing liquidity zone: 4613 – 4625 This is a high-confidence liquidity pocket where the market could complete a deeper correction and reset the broader bullish structure.
🎯 Trading Scenarios
Primary scenario – Continuation of the pullback: As long as price remains below the descending trendline, gold may continue to move lower to sweep liquidity below recent lows. This favors sell-on-rallies rather than buying strength.
Secondary scenario – Temporary reaction: Short-term bounces may occur around the 5050–5070 area, but without structural reclaim, these moves are more likely corrective than trend-changing.
Structural defense scenario: If price reaches the 4825–4830 or 4613–4625 zones, watch closely for signs of stabilization and absorption, which would signal that the liquidity objective has been completed.
🧠 Lana’s View
This move lower is best seen as liquidity cleanup, not panic selling. Lana stays patient during corrective phases, avoiding early longs and waiting for price to reach clear liquidity zones before reassessing bullish continuation.
✨ Let the market take what it needs, then look for structure to rebuild.


Gold 4900/4hJust like silver, i see gold coming down to check 5000 levels or maybe 4900. Logic is simple too bullish too soon, without forming base. 8 continuous green candles on 1D, now finally a red doji and today broke that doji. So there might be some fake bullishness.
Be vigilant but remember everything is possible.
#All this is my view not a financial advise.

Silver Down to 90/4hAlthough we saw a good correction here, around -10% today. Somewhat somewhere i see silver moving further down to 90 levels (might come to check the old channel).
Well we could also see some buying here as it is bottom of its yellow channel(current), just to trap people in fomo bullishness.
My long term view is, I am still bullish, year end 200$+. But right now dont go all in, keep risk management and money management tight. Remember, Anything can happen.
#My views not a financial advice.

INDIANB 1 Month Time Frame 📌 Current Price Context (as of latest trading)
Indian Bank is trading near ₹910–₹920 levels on NSE.
📈 1‑Month Key Resistance Levels (Upside)
These are the levels where price may face selling pressure or reversal if bulls weaken:
R1 — ₹918–₹920 — immediate resistance area just above current trade.
R2 — ₹927–₹930 — secondary resistance zone.
R3 — ₹935–₹940 — further upside resistance zone for continuation moves.
Summary: Immediate upside capped around ~₹918–₹930. Break and close above this band can signal stronger bullish continuation.
📉 1‑Month Key Support Levels (Downside)
Important levels that can act as rebound zones on pullbacks:
S1 — ~₹880–₹885 — first meaningful support near recent swing lows.
S2 — ~₹860–₹865 — secondary support from broader short‑term structure.
S3 — ~₹830–₹835 — major zone where bigger trend buyers may step in.
Summary: Minor supports start ~₹880, stronger support cluster around ~₹860‑₹835.
📊 Pivot / Neutral Reference
Pivot around ~₹907–₹910 — current central reference area.
Price above pivot suggests bullish bias, below could tilt neutral to bearish within the month.
📌 Interpretation For 1‑Month View
Bullish scenario:
Holds above ₹900–₹910 pivot → targeting ₹927–₹940 zone.
Neutral / consolidation:
Trading between ₹880–₹910.
Bearish risk:
Break below ₹860–₹845 could open deeper correction toward ₹830.

Trump speaks tonight — Gold at decision point.Market Context (H1–H4)
Gold remains in a broader bullish structure, but short-term price action has shifted into a decision phase after rejecting ATH. The sharp drop created a displacement leg, followed by a corrective bounce — typical post-event behavior.
Structurally:
HTF trend is still upward (ascending channel intact)
No confirmed HTF bearish reversal yet
Current move looks like rebalancing, not trend failure
Fundamental Context
Trump’s speech tonight is the key volatility trigger
Any geopolitical / USD-impacting rhetoric can cause:
A liquidity sweep before direction
Or a direct continuation if risk-off sentiment returns
Market is likely positioning → expect fake moves before clarity
Technical Breakdown
ATH: recent distribution, not yet reclaimed
FVG (upper): potential reaction zone for sellers if price rallies
Mid Zone (~5090–5120): short-term decision / balance area
Strong Demand (~4980–5000): HTF buy zone, aligns with trendline & prior BOS base
Trading Scenarios (If–Then)
If price holds above 5090–5120 → look for continuation into FVG, then ATH test
If price sweeps below 5090 but reclaims → classic liquidity grab → BUY continuation
If price breaks and holds below 5000 (H1 close) → deeper pullback, bullish bias pauses (not flips yet)
Key Takeaway
This is not the place to chase.
Trade reactions, not headlines.
Let Trump speak → let liquidity show → then follow structure.
Bias: Bullish continuation unless strong demand fails.
