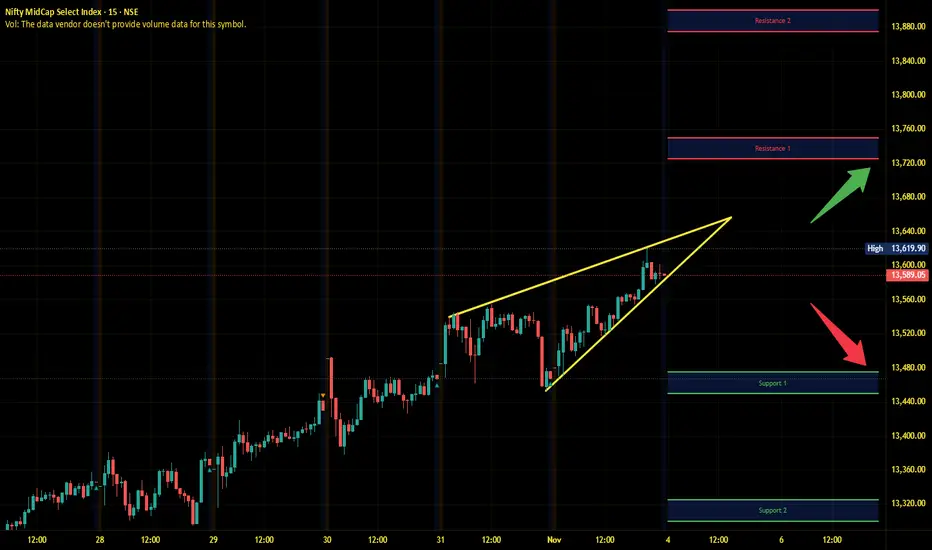
Midnifty Intraday Analysis for 04th November 2025NSE:NIFTY_MID_SELECT
Index has immediate resistance near 13725 – 13750 range and if index crosses and sustains above this level then may reach 13875 – 13900 range.
Midnifty has immediate support near 13475 – 13450 range and if this support is broken then index may tank near 13325 – 13200 range.
Trend Lines
Part 12 Trading Master Class With Experts Risks in Option Trading
While options can enhance profits, they also carry risks:
Time Decay (Theta Risk) – Options lose value as they near expiration.
Volatility Risk – Sudden drops in volatility can erode option premiums.
Liquidity Risk – Illiquid options may have wide bid-ask spreads, leading to slippage.
Unlimited Loss Potential for Sellers – Writing naked options can result in huge losses.
Complexity – Understanding the interplay of Greeks and pricing models requires skill and experience.

Part 11 Trading Master Class With Experts Popular Option Trading Strategies
Covered Call – Holding the underlying stock while selling a Call option to earn premium income.
Protective Put – Buying a Put option as insurance against a potential fall in a stock you own.
Straddle – Buying both a Call and Put option at the same strike price and expiry to profit from big price movements in either direction.
Strangle – Similar to a straddle, but using different strike prices to reduce cost.
Iron Condor – Selling a combination of Call and Put spreads to profit from low volatility.
Bull Call Spread – Buying a Call at a lower strike and selling one at a higher strike to reduce premium cost in bullish markets.
Bear Put Spread – Buying a Put at a higher strike and selling another Put at a lower strike to profit from bearish moves.
These strategies allow traders to balance risk and reward based on market outlook.

GOLD – TRIANGLE COMPRESSION ON H4 ✨ GOLD – TRIANGLE COMPRESSION ON H4, AWAITING A STRONG BREAKOUT IN WAVE 5 ✨
💬 Gold is accumulating in a compression triangle – when silence lasts too long, the market is about to speak.
Hi everyone 💖, Kristina is back with today's perspective on gold. I hope this analysis will help you – whether you're a new trader or have been trading gold for years – gain a clearer view to prepare for the upcoming breakout.
📉 Technical Analysis:
Currently, gold is moving within a triangle pattern on the H4 frame, indicating that market energy is being compressed. When the price breaks out of this area, the movement range could reach several tens of points.
Important support zone: 3960–3980
Strong resistance zone: 4035–4045
👉 When the price breaks one of these zones, the trend will be clearly confirmed.
According to Elliott Wave, Kristina is observing two scenarios:
1️⃣ Long-term: Wave (5) could be a downward wave, heading towards 3820.
2️⃣ Medium-term: Wave (5) can still rise if the price holds the 4000 zone, targeting around 4110–4130.
💎 Trading zone according to ICT:
Order Block around 4040 is a potential supply zone – a reversal signal is likely to appear.
The area around 4000 is a notable support point – it can create a bounce reaction if the price retests.
🎯 Reference trading scenarios:
Sell around 4040 when there is a reversal signal, SL 10 points, TP 4020–4000.
Buy around 4000 after the price retests the OB, SL 10 points, TP 4110.
If the price breaks 3970, wait to Sell around 3980, SL 10 points, TP 3820.
🕊️ Currently, gold is in a waiting phase – observe, don't rush, to act with the trend when the market "speaks."
🌷 The analysis reflects Kristina's personal perspective, not an investment recommendation.
If you share the same viewpoint or have a different perspective, please leave a comment below 💬💕

Part 9 Trading Master Class With ExpertsTypes of Options
Options can be classified in different ways:
Based on Style:
European Options – can only be exercised on the expiry date.
American Options – can be exercised any time before expiry.
Based on Underlying Asset:
Stock Options – based on shares of companies.
Index Options – based on market indices like Nifty or Bank Nifty.
Commodity Options – based on commodities like gold or crude oil.
Currency Options – based on currency pairs like USD/INR.

Part 8 Trading Master Class With ExpertsHow Option Premium Is Determined
The option premium is influenced by several factors, collectively known as the “Greeks.” These include:
Intrinsic Value – The actual value if exercised immediately (difference between market price and strike price).
Time Value – Extra premium paid for the time left before expiration.
Volatility (Vega) – The higher the market volatility, the higher the option premium.
Delta – Measures how much the option’s price changes with a change in the underlying price.
Theta – Indicates how much the option’s value erodes as time passes (time decay).
Rho – Measures sensitivity to interest rate changes.
For example, an option closer to expiry loses time value faster due to Theta decay.

Part 7 Trading Master Class With Experts How Options Work
Let’s take an example:
Suppose you buy a Call Option on Reliance Industries with a strike price of ₹2,500 and pay a premium of ₹50 per share.
If the stock rises to ₹2,600, you can exercise your right to buy at ₹2,500, making ₹100 profit per share (₹2,600 – ₹2,500), minus the premium (₹50). Net profit = ₹50.
If the stock falls below ₹2,500, you will not exercise the option. You lose only the premium of ₹50.
Similarly, a Put Option works the opposite way:
If you buy a Put Option with a strike price of ₹2,500 and the stock falls to ₹2,400, you can sell it at ₹2,500 and make a profit of ₹100 per share minus the premium.
This flexibility makes options a powerful tool for speculation and risk management.

Part 6 Learn Institutional Trading Key Terminology in Option Trading
Before trading options, understanding the terminology is crucial:
Underlying Asset: The financial asset (e.g., Nifty 50 index, stock, commodity) on which the option is based.
Strike Price: The fixed price at which the option holder can buy or sell the underlying asset.
Premium: The price paid by the buyer to the seller for obtaining the rights of the option.
Expiration Date: The date on which the option contract expires.
In-the-Money (ITM): When exercising the option would be profitable.
Out-of-the-Money (OTM): When exercising the option would not be profitable.
At-the-Money (ATM): When the market price equals the strike price.

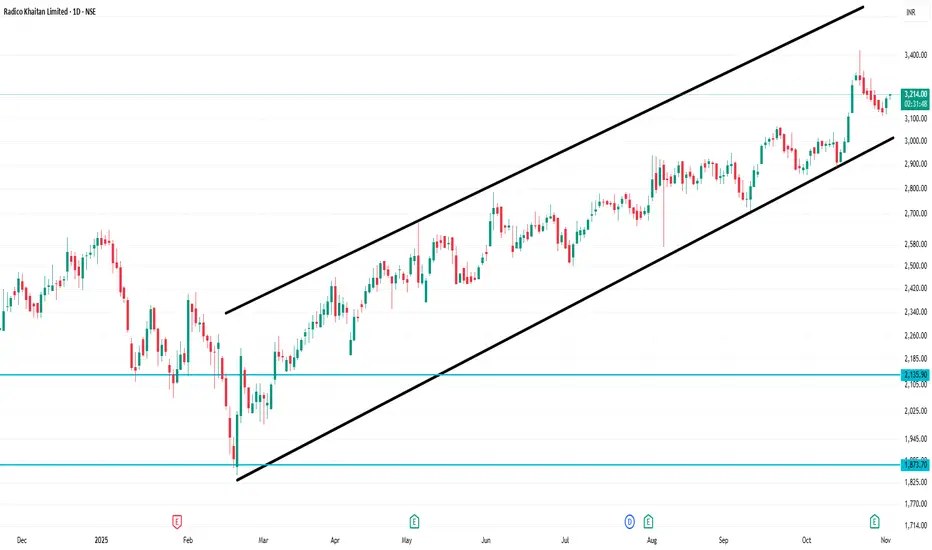
RADICO 1 Day Time Frame 🔍 Current price snapshot
Recent price: ~ ₹3,220 on the NSE.
The stock has its 52-week high around ~ ₹3,423 and 52-week low around ~ ₹1,845.
📈 Key technical levels (1-day frame)
Based on available pivot / support/resistance data:
Pivot (daily): ~ ₹2,831.17.
Immediate supports: ~ ₹2,777.77 (S2) and ~ ₹2,800.93 (S1).
Immediate resistances: ~ ₹2,884.57 (R2) and ~ ₹2,907.73 (R3).
Using another source: Support ~ ₹3,143.31 and ~ ₹3,125.26; Resistance ~ ~₹3,219.81 & ~₹3,249.03.
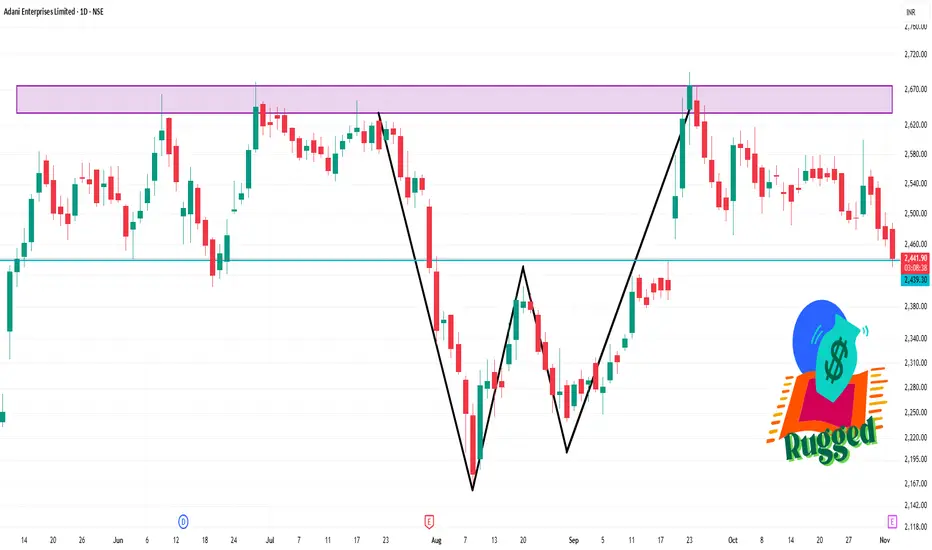
ADANIENT 1 Day Time Frame ✅ Important Levels
From the pivot-point and support/resistance calculations:
Pivot (Classic) ≈ ₹ 2,448.43
Resistance levels: ≈ ₹ 2,466.16 (R1) / ₹ 2,493.93 (R2)
Support levels: ≈ ₹ 2,420.66 (S1) / ₹ 2,402.93 (S2)
🧭 What to watch in the near term
a) If price breaks above ₹2,466-2,493 and holds above, that could shift bias upward and open a test of higher resistance levels.
b) If price slips below ₹2,420-2,402, further downside risk is likely, and next support zones would become relevant.
c) Given the bearish MA structure and weak momentum, the path of least resistance right now appears downward (unless strong buying emerges).
Crypto and Digital Asset Regulations in India (Post-2025)1. Early Phase: From Uncertainty to Recognition
The Indian crypto journey began with skepticism. In 2013, the Reserve Bank of India (RBI) first issued warnings about virtual currencies like Bitcoin, citing risks of volatility, fraud, and lack of legal backing. Between 2017 and 2018, crypto trading volumes surged across Indian exchanges such as ZebPay and CoinDCX, prompting the RBI to impose a banking ban in April 2018. This prohibited regulated entities from providing services to crypto businesses, effectively stalling industry growth.
However, in March 2020, the Supreme Court of India overturned the RBI ban, ruling that it was unconstitutional. This verdict reopened doors for the crypto sector, allowing exchanges to restart operations. This was a landmark judgment that recognized crypto assets as a legitimate digital commodity, though not yet as legal tender.
2. Post-2021 Developments: Regulatory Consolidation
From 2021 onwards, the Indian government and financial regulators started formulating frameworks to oversee the growing digital asset ecosystem. The focus was on taxation, registration, and consumer protection, rather than outright prohibition.
In Budget 2022, the Finance Ministry took a crucial step by introducing a 30% tax on income from Virtual Digital Assets (VDAs). This was a clear signal that the government acknowledged the existence of digital assets but wanted to regulate them stringently. Additionally, a 1% TDS (Tax Deducted at Source) was applied to crypto transactions exceeding ₹10,000, aimed at tracking transactions and ensuring compliance.
While this tax structure made day trading less attractive, it marked a shift from banning to monitoring. The move was followed by exchanges being required to comply with Know Your Customer (KYC) and Anti-Money Laundering (AML) norms, integrating with India’s Financial Intelligence Unit (FIU-IND).
3. The Digital India Context: Blockchain Beyond Crypto
India’s broader Digital India initiative has greatly influenced crypto policy. The government recognizes that blockchain technology — which underpins cryptocurrencies — can revolutionize financial inclusion, supply chain management, and public records.
Projects such as the Central Bank Digital Currency (CBDC), launched by the RBI as the Digital Rupee (e₹) in 2023, have demonstrated India’s willingness to explore regulated digital currencies. The CBDC aims to provide the benefits of digital transactions while maintaining state control over monetary policy.
However, private cryptocurrencies like Bitcoin or Ethereum remain outside the legal tender framework — they can be traded, but not used as official currency.
4. Current Regulatory Structure (Post-2025)
As of post-2025, India’s crypto and digital asset framework revolves around four key pillars:
a) Legal Recognition & Definitions
The Virtual Digital Asset (VDA) category covers cryptocurrencies, NFTs (Non-Fungible Tokens), and certain tokenized assets. They are recognized as digital commodities or property, not as money. The term “crypto currency” is deliberately avoided in official documents to emphasize that these are assets for investment, not currency substitutes.
b) Taxation Framework
30% flat tax on profits from digital asset transfers.
1% TDS on each transaction for monitoring purposes.
No offset of losses between different digital assets or against other income.
Gifts in digital assets are also taxable under existing income tax rules.
This framework discourages speculative trading but supports transparency and record-keeping.
c) Regulatory Bodies
RBI (Reserve Bank of India) – Oversees monetary implications and CBDC operations.
SEBI (Securities and Exchange Board of India) – May regulate tokenized securities or investment contracts.
FIU-IND – Monitors compliance with AML and KYC norms.
Finance Ministry – Leads policy formation and taxation oversight.
d) Exchange & Custody Regulations
Crypto exchanges are now required to:
Register under FIU-IND as “reporting entities.”
Maintain complete transaction and user data for audit purposes.
Ensure compliance with international FATF (Financial Action Task Force) standards.
Implement cold wallet storage and cybersecurity frameworks for asset safety.
5. Investor Protection and Market Discipline
Post-2025, investor protection remains a top priority. Regulators aim to protect retail investors from frauds, Ponzi schemes, and misleading promotions. Exchanges must provide disclosures on risk, volatility, and regulatory uncertainty.
Educational campaigns are being promoted through both government and industry initiatives to help investors differentiate between legitimate projects and scams. The industry also follows self-regulatory codes, inspired by SEBI norms for mutual funds and brokers.
6. India’s Stance on Global Coordination
India has been actively engaging in G20 and FATF discussions to establish global crypto standards. As G20 president in 2023, India pushed for a global regulatory framework to avoid cross-border arbitrage.
In 2025, India’s policies align with the G20-endorsed framework that calls for:
Uniform tax reporting standards (similar to the OECD’s “Crypto-Asset Reporting Framework”).
Common KYC and anti-terrorism financing standards.
Information sharing between nations on suspicious crypto transactions.
This international collaboration helps prevent misuse of crypto for money laundering or terror financing while enabling legitimate innovation.
7. Central Bank Digital Currency (CBDC) – The Digital Rupee
The Digital Rupee (e₹) represents India’s official foray into state-backed digital assets. Issued by the RBI, it functions like a virtual version of the Indian Rupee, ensuring transparency, traceability, and low-cost transfers.
Key features include:
Pilot use in wholesale and retail segments.
Interoperability with UPI and bank apps.
Programmable transactions for specific purposes (like subsidies or government payments).
The CBDC complements rather than competes with private crypto assets — providing a regulated digital payment option backed by sovereign authority.
8. Emerging Trends: Tokenization and DeFi
India’s next wave of digital asset regulation focuses on tokenized real-world assets (RWA) and Decentralized Finance (DeFi). Tokenization allows physical assets such as real estate, art, or bonds to be represented digitally, creating liquidity and transparency.
However, regulators are cautious about DeFi projects due to the anonymity involved. The focus remains on regulated innovation, where blockchain is used under frameworks ensuring identity verification and financial stability.
9. Challenges Ahead
Despite progress, India faces several challenges:
Tax Burden: The 30% tax and 1% TDS discourage active participation.
Lack of Clear Legal Status: Crypto is not illegal, but not officially legal either.
Banking Hesitancy: Some banks remain cautious in offering services to exchanges.
Regulatory Fragmentation: Multiple agencies overlap in jurisdiction, slowing innovation.
Still, the policy direction is moving toward clarity, control, and co-existence.
10. The Road Ahead
Looking beyond 2025, India aims to establish a Comprehensive Digital Asset Regulation Bill that classifies different asset types (utility tokens, security tokens, stablecoins) and provides guidelines for their issuance, trading, and taxation.
The focus will be on:
Integrating blockchain in public infrastructure.
Encouraging innovation in Web3 and fintech startups.
Aligning with global best practices to make India a regulated digital asset hub.
With its young tech-driven population and strong fintech ecosystem, India has the potential to lead in responsible crypto innovation while maintaining financial sovereignty.
Conclusion
Post-2025, India’s crypto and digital asset regulations reflect a measured and pragmatic approach — not anti-crypto, but pro-regulation. The government acknowledges the transformative power of blockchain while safeguarding against financial risks. Through structured taxation, compliance requirements, and global coordination, India is building the foundation for a transparent, secure, and innovation-friendly digital asset ecosystem.
As policies mature, the country’s focus will likely shift from control to collaboration — enabling India to play a leading role in shaping the future of global digital finance.
Fundamental Analysis for Long-Term Investors1. Understanding the Concept of Fundamental Analysis
At its core, fundamental analysis (FA) seeks to answer one key question: What is the true value of this company?
By comparing the intrinsic value (calculated through analysis) with the current market price, investors can decide whether to buy, hold, or sell a stock.
If Intrinsic Value > Market Price, the stock is undervalued — a potential buying opportunity.
If Intrinsic Value < Market Price, the stock is overvalued — a signal to avoid or sell.
This method assumes that, in the long run, the market will correct any mispricing and reflect the company’s actual worth.
2. Components of Fundamental Analysis
Fundamental analysis can be divided into two main parts:
a) Qualitative Analysis
This part deals with the non-numerical aspects of a company, such as:
Business Model – How the company earns revenue and its sustainability.
Management Quality – Leadership capability and corporate governance.
Competitive Advantage (Moat) – Unique strengths like brand value, patents, or cost advantages.
Industry Outlook – Growth potential, regulatory environment, and barriers to entry.
Economic Factors – Interest rates, inflation, fiscal policy, and global market trends.
b) Quantitative Analysis
This involves examining measurable data like financial statements, ratios, and cash flows to determine a company’s financial health.
3. Key Financial Statements in Fundamental Analysis
A company’s financial statements form the backbone of fundamental analysis. Long-term investors should focus on three primary statements:
a) Income Statement
It shows the company’s profitability over a period, detailing revenue, expenses, and net income.
Key metrics:
Revenue Growth – Indicates whether the company’s sales are increasing consistently.
Operating Margin – Reflects operational efficiency.
Net Profit Margin – Shows how much profit remains after all expenses.
b) Balance Sheet
This statement provides a snapshot of the company’s financial position — assets, liabilities, and shareholders’ equity.
Important metrics include:
Debt-to-Equity Ratio (D/E) – Measures financial leverage; lower ratios imply less risk.
Current Ratio – Indicates liquidity; a ratio above 1 shows good short-term financial health.
Book Value per Share – Helps assess whether the stock is trading above or below its book value.
c) Cash Flow Statement
This shows the actual cash generated or used by the company.
Focus areas:
Operating Cash Flow (OCF) – Cash generated from core business operations.
Free Cash Flow (FCF) – Cash left after capital expenditures; indicates ability to reinvest or reward shareholders.
4. Key Financial Ratios for Long-Term Investors
Ratios simplify the evaluation of a company’s performance. Some of the most important ones are:
a) Valuation Ratios
Price-to-Earnings (P/E) Ratio – Indicates how much investors are willing to pay for each rupee of earnings. A lower P/E could suggest undervaluation.
Price-to-Book (P/B) Ratio – Compares market value to book value; useful for asset-heavy industries.
Price-to-Sales (P/S) Ratio – Ideal for companies with negative earnings but growing sales.
b) Profitability Ratios
Return on Equity (ROE) – Measures how efficiently equity is used to generate profit.
Return on Assets (ROA) – Shows how effectively the company uses its assets.
Gross and Net Margins – Indicate profitability at different stages of the income statement.
c) Liquidity and Solvency Ratios
Current Ratio & Quick Ratio – Assess short-term liquidity.
Interest Coverage Ratio – Measures ability to pay interest on debt.
d) Growth Ratios
Earnings Per Share (EPS) Growth – Consistent EPS growth indicates strong performance.
Revenue Growth Rate – Reflects expansion potential and demand.
5. Intrinsic Value and Valuation Methods
The goal of fundamental analysis is to determine intrinsic value — an estimate of what a company is truly worth. Some popular valuation methods include:
a) Discounted Cash Flow (DCF) Model
This method projects the company’s future cash flows and discounts them to present value using a required rate of return.
It’s one of the most reliable methods for estimating intrinsic value, though it requires accurate assumptions.
b) Dividend Discount Model (DDM)
Used for dividend-paying companies; it values a stock based on future dividend payments discounted to the present.
c) Relative Valuation
Compares the company’s valuation ratios (like P/E or EV/EBITDA) with peers or industry averages to assess whether it’s under or overvalued.
6. Economic and Industry Analysis
Fundamental analysis is not limited to company-level study. A top-down approach starts with understanding the broader economy and narrows down to sectors and companies.
a) Economic Analysis
Factors like GDP growth, interest rates, inflation, and fiscal policy impact company earnings and valuations. For example:
Rising interest rates can hurt highly leveraged firms.
Inflation affects input costs and consumer demand.
b) Industry Analysis
Identifying industries with favorable long-term prospects (such as renewable energy, technology, or healthcare) can improve investment success. Tools like Porter’s Five Forces help analyze industry competitiveness and profitability.
7. Qualitative Factors and Management Assessment
A company’s management team plays a vital role in long-term success. Investors should assess:
Leadership Track Record – Vision, integrity, and experience of the management team.
Corporate Governance – Transparency, accountability, and alignment with shareholder interests.
Innovation Capability – Ability to adapt to changing technology or consumer behavior.
Brand Reputation – Strength of brand loyalty and market position.
8. The Margin of Safety Principle
Coined by Benjamin Graham, the margin of safety is the difference between a stock’s intrinsic value and its market price.
For example, if a stock’s intrinsic value is ₹500 and it’s trading at ₹350, the 30% gap is the margin of safety — a cushion against analytical errors or unforeseen events.
This principle ensures that even if some assumptions go wrong, the investment remains relatively safe for the long term.
9. Long-Term Perspective and Patience
Fundamental analysis rewards patience. Stock prices can remain undervalued or overvalued for extended periods due to market sentiment or short-term volatility. However, over time, prices tend to align with intrinsic value.
Long-term investors must focus on business fundamentals, not market noise.
Compounding works best when investments are held for years in fundamentally strong companies with consistent growth, low debt, and sustainable advantages.
10. Limitations of Fundamental Analysis
While powerful, FA has its challenges:
Time-Consuming – Requires deep research and analysis.
Subjectivity – Valuation depends on assumptions that may not always be accurate.
Market Irrationality – Prices can deviate from fundamentals for long periods.
Changing Macroeconomics – Economic shocks can alter intrinsic value projections.
Thus, blending FA with periodic reviews and awareness of market cycles enhances decision-making.
Conclusion
Fundamental analysis is the foundation of successful long-term investing. It equips investors with the knowledge to differentiate between temporary market noise and genuine value. By analyzing a company’s financial health, competitive position, management quality, and future prospects, investors can make informed decisions that compound wealth over time.

Currency Trading in India (USD/INR, EUR/INR, GBP/INR, JPY/INR)1. Overview of the Indian Currency Market
The Indian currency market is regulated by the Reserve Bank of India (RBI) and the Securities and Exchange Board of India (SEBI). Unlike global forex markets that operate 24 hours a day, the Indian forex trading market follows specific timings—from 9:00 AM to 5:00 PM IST, Monday to Friday.
Currency trading in India takes place on recognized exchanges such as:
National Stock Exchange (NSE)
Bombay Stock Exchange (BSE)
Multi Commodity Exchange (MCX-SX, now known as MSEI)
Trading is done in currency futures and options contracts rather than spot markets. This allows traders to speculate on future currency movements, hedge foreign exchange exposure, and manage import-export risks.
2. Importance of Currency Trading
Currency trading in India serves several crucial purposes:
Hedging against exchange rate risk: Importers, exporters, and multinational companies use currency derivatives to protect their profits from adverse currency movements.
Speculative opportunities: Traders and investors speculate on price changes to make profits from small fluctuations in currency rates.
Diversification: For retail and institutional investors, the forex market provides an alternative asset class beyond equities, commodities, and bonds.
Global exposure: Currency trading connects the Indian economy to global capital flows and helps stabilize balance of payments.
3. Major Currency Pairs Traded in India
Let’s look closely at the four major INR-based currency pairs:
a) USD/INR – The Most Active Pair
The USD/INR pair is the most traded and liquid currency pair in India. It represents how many Indian Rupees are required to purchase one US Dollar. The exchange rate is influenced by various factors such as:
RBI’s monetary policy
India’s trade deficit with the US
Interest rate differentials between India and the US
Global crude oil prices (since India imports most of its oil in USD)
Foreign portfolio investment inflows/outflows
USD/INR is widely used by corporates for hedging and by traders for speculation. The Rupee’s value against the Dollar is also a key indicator of India’s economic strength.
b) EUR/INR – The Euro-Rupee Pair
The EUR/INR pair reflects the exchange rate between the Euro and the Indian Rupee. It is the second-most traded currency pair in India. Europe is one of India’s major trading partners, and fluctuations in the Euro impact sectors like pharmaceuticals, engineering goods, and textiles.
Factors affecting EUR/INR include:
Eurozone’s economic data (GDP, inflation, trade balance)
European Central Bank (ECB) policies
Crude oil prices and global demand
Cross-currency movements between Euro and Dollar
The EUR/INR pair often exhibits higher volatility than USD/INR, providing good trading opportunities for short-term traders.
c) GBP/INR – The British Pound-Rupee Pair
The GBP/INR pair tracks the value of the British Pound in terms of the Indian Rupee. The Pound is known for its high volatility, making it attractive for experienced traders.
Key drivers of GBP/INR include:
Bank of England’s monetary policy
Political developments in the UK (like Brexit or elections)
Trade and investment flows between India and the UK
Global risk sentiment and capital movement
Because of its volatility, GBP/INR can generate both higher profits and higher risks, so traders often apply strict stop-loss strategies.
d) JPY/INR – The Japanese Yen-Rupee Pair
The JPY/INR pair represents how many Rupees are needed for 100 Japanese Yen. The Yen is often considered a safe-haven currency, meaning it tends to strengthen during global economic uncertainty.
Important factors influencing JPY/INR include:
Japan’s interest rate policy and inflation trends
Global risk appetite (Yen rises in risk-off scenarios)
India-Japan trade and investment relations
JPY/INR tends to move slower than GBP/INR or EUR/INR, making it suitable for conservative traders seeking stable movements.
4. How Currency Trading Works in India
In India, you cannot trade global forex pairs like EUR/USD or GBP/USD directly due to RBI restrictions. Instead, you can trade INR-based pairs and cross-currency pairs such as EUR/USD, GBP/USD, and USD/JPY introduced later by SEBI.
Each currency futures contract on NSE or BSE has:
Lot size: Typically 1,000 units for USD/INR, EUR/INR, and GBP/INR; 100,000 units for JPY/INR.
Tick size: 0.0025 or 0.25 paise.
Expiry: Monthly contracts expiring two working days before the last business day of the month.
Margin requirement: Around 3–5% of the contract value.
Trading is done through a registered broker, similar to equity trading, and all trades are settled in cash—no physical delivery of currencies.
5. Factors Influencing Currency Movements
Several global and domestic factors influence INR-based currency pairs:
Interest Rate Differentials: Higher interest rates in one country attract foreign capital, strengthening its currency.
Inflation Rates: Lower inflation tends to appreciate the currency’s value.
Trade Deficits: A high trade deficit leads to currency depreciation due to higher demand for foreign currencies.
Foreign Investment Flows: FII and FDI inflows support the Rupee, while outflows weaken it.
Crude Oil Prices: Rising oil prices increase India’s import bill, pressuring the Rupee.
Geopolitical Events: Global tensions, wars, and trade sanctions create volatility in currency markets.
RBI Intervention: The RBI regularly buys or sells dollars to maintain stability in the forex market.
6. Advantages of Currency Trading in India
Low Capital Requirement: Currency futures require smaller margins than equity derivatives, making it affordable for retail traders.
High Liquidity: Especially in USD/INR, which ensures easy entry and exit.
Leverage: Traders can control large positions with relatively small capital.
Diversification: Adds a new dimension to a trader’s portfolio beyond stocks and commodities.
Regulated Environment: Trading through NSE/BSE ensures transparency and security for participants.
7. Risks Involved in Currency Trading
While lucrative, forex trading also carries risks:
High Volatility: Currency pairs can move sharply in reaction to global news.
Leverage Risk: Leverage amplifies both profits and losses.
Political and Economic Events: Sudden government decisions or geopolitical crises can cause unpredictable movements.
Interest Rate Announcements: Central bank decisions can lead to overnight gaps and stop-loss hits.
Traders must therefore manage risk carefully using stop losses, position sizing, and diversified strategies.
8. Future of Currency Trading in India
India’s currency trading market is expanding rapidly due to growing globalization, digital platforms, and increased awareness among retail investors. The introduction of cross-currency pairs and potential expansion into 24-hour trading could further align India’s forex market with global standards.
Technological advancements, algorithmic trading, and integration with platforms like GIFT City (Gujarat International Finance Tec-City) are also paving the way for offshore rupee trading to return to Indian shores.
Conclusion
Currency trading in India offers a dynamic avenue for both hedgers and speculators. The four key INR pairs—USD/INR, EUR/INR, GBP/INR, and JPY/INR—reflect the nation’s integration with the global economy. Backed by SEBI and RBI regulation, the Indian forex market is evolving into a sophisticated and secure ecosystem.
For traders, mastering the fundamentals of global economics, risk management, and technical analysis is essential to succeed in currency trading. With discipline, knowledge, and proper strategy, the forex market can serve as a rewarding segment of India’s financial landscape.

Commodity Trading: Gold, Silver, Crude Oil, Natural Gas on MCX1. Overview of MCX and Commodity Trading
The Multi Commodity Exchange (MCX) was established in 2003 and operates under the regulatory framework of the Securities and Exchange Board of India (SEBI). It provides a transparent and standardized platform for trading in commodity derivatives, allowing market participants to hedge against price volatility or take speculative positions based on their market outlook.
Commodity trading on MCX includes bullion (gold, silver), energy (crude oil, natural gas), and base metals (copper, zinc, aluminum) among others. Prices are largely influenced by international benchmarks — for example, COMEX for gold and silver, and NYMEX for crude oil and natural gas — since commodities are globally traded and denominated in U.S. dollars.
2. Gold Trading on MCX
a. Importance of Gold
Gold is considered both a precious metal and a safe-haven asset. It acts as a hedge against inflation, currency depreciation, and economic uncertainty. In India, gold also holds immense cultural and investment value, making it one of the most traded commodities.
b. MCX Gold Contracts
MCX offers multiple gold contracts to cater to different categories of traders:
Gold (1 kg)
Gold Mini (100 grams)
Gold Guinea (8 grams)
Gold Petal (1 gram)
Gold Petal (New Delhi)
Each contract differs in lot size and margin requirements, allowing both retail and institutional traders to participate. The price quote is in Rupees per 10 grams, and the underlying is standard gold of 995 purity.
c. Factors Influencing Gold Prices
Global economic data (especially U.S. inflation, employment, and GDP)
US Dollar movement – Gold has an inverse relationship with the USD.
Interest rate changes by the U.S. Federal Reserve.
Geopolitical tensions or crises that boost safe-haven demand.
Jewelry demand and central bank reserves.
d. Trading Strategy
Gold trading often combines technical analysis (using trendlines, moving averages, and RSI) with macro fundamentals (like Fed announcements). Traders also track the COMEX gold price and the rupee-dollar exchange rate for near-term movement cues on MCX.
3. Silver Trading on MCX
a. Role of Silver
Silver, often referred to as the “poor man’s gold,” has both precious and industrial uses. It’s widely used in electronics, solar panels, and medical instruments. This dual nature makes silver more volatile than gold.
b. MCX Silver Contracts
MCX offers several contracts:
Silver (30 kg)
Silver Mini (5 kg)
Silver Micro (1 kg)
Silver 1000 (30 kg, 999 purity)
The price quote is in Rupees per kilogram. Silver contracts are physically settled, ensuring price integrity and alignment with physical market demand.
c. Price Influencers
Industrial demand in electronics and solar sectors.
Gold price movement (since silver tends to follow gold trends).
US Dollar and bond yields.
Global supply-demand balances from major producers like Mexico and Peru.
d. Trading Insights
Silver’s high volatility appeals to short-term traders. It responds strongly to global macro news and industrial growth data. Many traders use gold-silver ratio analysis — when the ratio widens, it may suggest silver is undervalued relative to gold, and vice versa.
4. Crude Oil Trading on MCX
a. Significance of Crude Oil
Crude oil is the lifeblood of the global economy — influencing transport, manufacturing, and inflation. As one of the most liquid commodities, it offers dynamic trading opportunities. MCX crude oil prices track NYMEX WTI Crude, adjusted for the INR/USD rate.
b. MCX Crude Oil Contracts
MCX offers:
Crude Oil (100 barrels)
Crude Oil Mini (10 barrels)
Prices are quoted in Rupees per barrel. Contract expiries are aligned with global oil futures.
c. Key Factors Affecting Prices
Global demand-supply balance led by OPEC decisions.
U.S. crude inventory data from the Energy Information Administration (EIA).
Geopolitical tensions in the Middle East.
Dollar strength and global growth outlook.
Production levels in the U.S. shale industry.
d. Trading Strategies
Crude oil traders closely track weekly U.S. inventory reports, OPEC meetings, and economic indicators like global PMI data. Technical tools like Bollinger Bands and MACD help spot momentum reversals. Traders also hedge exposure against energy price swings using MCX crude futures.
5. Natural Gas Trading on MCX
a. Overview
Natural gas is a crucial energy source used for power generation, heating, and industrial processes. With the rise in clean energy demand, gas trading volumes have been rising sharply on MCX.
b. Contract Specifications
MCX offers Natural Gas (1250 mmBtu) contracts, quoted in Rupees per mmBtu (million British thermal units). Prices track NYMEX Natural Gas futures, with adjustments for INR movements.
c. Price Influences
Weather conditions – cold winters or hot summers drive higher consumption.
Inventory levels in U.S. gas storage.
Production trends from shale fields.
Transition toward clean energy and LNG demand.
Global geopolitical events affecting gas supply routes.
d. Trading Approach
Natural gas prices are highly seasonal and volatile. Traders use weather forecasts, EIA inventory data, and technical tools like support-resistance zones to time entries. Given its volatility, proper risk management and position sizing are essential.
6. Trading Mechanism and Settlement
All commodities on MCX are traded electronically, ensuring transparency. Contracts are margined, meaning traders need only deposit a fraction of the total value (typically 5–10%) as margin.
Settlement can be of two types:
Cash settlement, based on final settlement price.
Physical delivery, for bullion and select metals.
Traders should be aware of expiry dates, daily price limits, and margin requirements to manage positions effectively.
7. Risk Management and Hedging
Commodity derivatives are vital tools for hedgers (like jewelers or oil companies) to protect against adverse price movements. For instance:
A jeweler may short gold futures to hedge inventory.
An airline may buy crude oil futures to fix fuel costs.
Speculators and arbitrageurs add liquidity, but they must apply strict stop losses, technical discipline, and volatility tracking to avoid large losses.
8. Conclusion
Commodity trading on the MCX — particularly in Gold, Silver, Crude Oil, and Natural Gas — offers immense opportunities for profit and portfolio diversification. These commodities are deeply connected to global macroeconomic events, geopolitical developments, and currency movements.
Success in this market requires a blend of technical analysis, fundamental understanding, and emotional discipline. For retail traders, starting with mini or micro contracts and focusing on risk control is key. As India’s participation in the global commodity market expands, MCX remains a vital gateway for investors to tap into the pulse of international trade and energy trends.

Trading Psychology and Emotional Discipline1. Understanding Trading Psychology
Trading psychology refers to the mental and emotional aspects that influence trading decisions. Every trade triggers a mix of emotions — fear, greed, hope, frustration, or excitement. These emotions can cloud judgment, making traders deviate from their plans.
Even the most skilled analysts can fail if they cannot manage their reactions to profit and loss.
In simple terms, trading psychology is about how a trader’s mindset affects their actions — when to enter, hold, or exit a trade. It shapes how traders respond to risk, uncertainty, and outcomes.
2. The Role of Emotions in Trading
The two most dominant emotions in trading are fear and greed, and both can significantly distort rational thinking.
Fear:
Fear makes traders avoid taking trades even when the setup is perfect. It can also make them close profitable trades too early to “lock in” small gains, fearing the market might reverse. In other cases, fear of loss leads to hesitation and missed opportunities.
Greed:
Greed drives traders to chase trades even after a big rally or to overtrade in hopes of bigger profits. It makes them ignore risk management rules and hold onto winning positions for too long, waiting for unrealistic targets.
Hope and Regret:
Hope often keeps traders stuck in losing positions, expecting the market to turn around. Regret, on the other hand, can paralyze decision-making, as traders fear repeating past mistakes.
Understanding these emotional triggers is the first step toward controlling them.
3. Importance of Emotional Discipline
Emotional discipline is the ability to stick to your trading plan regardless of emotional highs or lows. It is what separates consistent traders from impulsive ones.
Discipline helps traders:
Follow their strategy without deviation.
Accept losses calmly and move on.
Avoid revenge trading after a losing streak.
Take profits as planned without overextending trades.
Maintain patience to wait for high-probability setups.
Without discipline, even the best system can fail. With it, an average strategy can yield consistent returns.
4. Common Psychological Mistakes Traders Make
Overconfidence:
After a few profitable trades, traders may start believing they can’t go wrong. Overconfidence leads to oversized positions and ignoring stop-losses — often ending in big losses.
Revenge Trading:
When a trader tries to “get back” at the market after a loss, they act emotionally rather than logically. Revenge trades are impulsive and usually result in further damage.
Confirmation Bias:
Traders tend to seek information that supports their existing view, ignoring contrary evidence. This bias prevents them from seeing warning signs.
Loss Aversion:
The pain of losing is psychologically stronger than the pleasure of gaining. Many traders avoid taking small losses, turning them into larger ones.
Herd Mentality:
Following others blindly — whether social media, news, or trading groups — causes traders to abandon their analysis and act out of fear of missing out (FOMO).
Lack of Patience:
Impatient traders force trades just to “stay active.” However, successful trading often requires waiting — sometimes for days — for the right setup.
5. Building a Strong Trading Mindset
Developing the right mindset takes practice and self-awareness. Here are some key principles:
Accept Uncertainty:
Every trade has an element of uncertainty. You can control your risk, but not the outcome. Accepting this truth reduces emotional stress.
Focus on Process, Not Profits:
Professionals concentrate on executing their plan correctly rather than obsessing over results. Consistency in following the process naturally leads to consistent profits.
Detach Emotionally from Money:
Traders should see capital as “trading inventory,” not as personal wealth. Emotional attachment to money causes hesitation and poor decision-making.
Maintain Realistic Expectations:
Trading is not a get-rich-quick game. Expecting overnight success creates pressure and forces impulsive trades.
Stay Present and Mindful:
Be fully aware during trading hours — not daydreaming about profits or losses. Mindfulness improves focus and reduces emotional reactions.
6. Practical Ways to Strengthen Emotional Discipline
Create and Follow a Trading Plan:
Define your entry, exit, stop-loss, and risk parameters before every trade. Once the plan is in place, follow it strictly. This removes guesswork and emotion from decisions.
Use Stop-Loss and Position Sizing:
Always use a stop-loss to protect capital. Limit each trade’s risk to a small percentage (usually 1–2% of total capital). This prevents emotional panic when trades go wrong.
Keep a Trading Journal:
Record every trade along with the reason for entry and exit, as well as your emotional state. Reviewing your journal regularly helps identify emotional patterns and mistakes.
Take Breaks After Losses:
If you experience multiple losing trades, step away. Emotional recovery is vital before returning to the market.
Meditation and Mental Training:
Many successful traders practice meditation, visualization, or breathing exercises to stay calm and focused.
Avoid Overtrading:
More trades don’t always mean more profit. Stick to quality setups that fit your trading edge.
Set Daily Profit and Loss Limits:
Predetermine a maximum loss or gain for the day. Once reached, stop trading. This prevents emotional spiral trading.
Review and Reflect Regularly:
Analyze your performance weekly or monthly to understand what works and what doesn’t — both technically and psychologically.
7. The Role of Confidence and Patience
Confidence and patience go hand in hand in trading psychology.
Confidence comes from preparation, back-testing, and knowing your system works. Patience ensures you wait for setups that match your strategy instead of forcing trades.
A confident trader doesn’t fear missing out. They know opportunities are endless. Patience ensures discipline, and discipline ensures profitability.
8. The Growth Mindset in Trading
Adopting a growth mindset means treating losses as learning opportunities rather than failures. Each mistake reveals a behavioral pattern to fix.
A trader with a growth mindset:
Reviews trades objectively.
Seeks feedback and self-improvement.
Avoids blaming the market.
Understands that consistency builds over time.
The market rewards those who keep improving rather than those who chase perfection.
9. Conclusion
Trading psychology and emotional discipline are the backbone of long-term trading success. Charts, indicators, and systems can be learned quickly, but mastering one’s mind takes continuous effort.
The best traders are not those who win every trade but those who manage their emotions through every win and loss. By developing awareness, controlling fear and greed, following a well-defined plan, and maintaining discipline, a trader can achieve stability and confidence — the true edge in the market.

AI and Data Analytics in Stock Market Decisions1. The Evolution of Stock Market Decision-Making
Traditionally, stock market decisions were made using two major approaches:
Fundamental analysis, which focuses on company performance, earnings, and macroeconomic factors.
Technical analysis, which studies past price and volume patterns to predict future trends.
While both methods remain relevant, they are now enhanced by AI and data analytics. AI can process enormous data sets that humans cannot handle manually, identify hidden correlations, and make decisions based on probabilities rather than assumptions.
The integration of these technologies started with algorithmic trading in the 1990s and has evolved into machine learning-driven trading systems and predictive analytics models in the 21st century.
2. Understanding AI and Data Analytics
Artificial Intelligence (AI) refers to systems that can mimic human intelligence, learn from experience, and make decisions autonomously. In stock trading, AI tools like machine learning (ML), deep learning, and natural language processing (NLP) play vital roles.
Machine Learning (ML): Learns patterns from historical data and applies them to predict future stock price movements.
Deep Learning (DL): Uses neural networks to process large-scale and complex financial data, identifying non-linear relationships.
Natural Language Processing (NLP): Analyzes financial news, social media sentiment, and corporate announcements to gauge market mood.
Data Analytics, on the other hand, involves the collection, cleaning, and analysis of structured and unstructured data to uncover insights. This includes historical price data, earnings reports, economic indicators, and even tweets or headlines.
Together, AI and data analytics form the backbone of quantitative trading, robo-advisory platforms, and automated portfolio management systems.
3. Key Applications of AI and Data Analytics in the Stock Market
a. Predictive Analysis and Price Forecasting
AI models can analyze historical price patterns, volatility, and macroeconomic indicators to forecast short-term and long-term price movements.
For example:
Neural networks detect recurring patterns in stock charts.
Regression models and reinforcement learning algorithms adjust predictions in real time as market conditions change.
b. Sentiment Analysis
NLP-powered tools scan news articles, earnings calls, analyst reports, and social media to measure market sentiment.
A positive sentiment can lead to short-term price surges, while negative buzz can trigger sell-offs. Platforms like Bloomberg and Refinitiv now incorporate AI-based sentiment analytics for traders.
c. Algorithmic and High-Frequency Trading (HFT)
AI-driven algorithmic trading systems execute thousands of trades per second, exploiting minor market inefficiencies.
Algorithms analyze order book data and market microstructure.
AI continuously improves its strategy by learning from past trades.
This minimizes human error and maximizes execution speed and accuracy.
d. Portfolio Management and Robo-Advisors
AI helps investors manage risk and optimize portfolios based on their risk tolerance, investment goals, and market outlook.
Robo-advisors such as Zerodha’s Niyam or international platforms like Betterment and Wealthfront use AI to automatically rebalance portfolios and minimize losses.
e. Fraud Detection and Compliance
AI-powered surveillance systems detect anomalies, such as insider trading, price manipulation, or fraudulent transactions.
Machine learning algorithms monitor trading patterns in real time and alert regulators or brokers to suspicious behavior.
f. Risk Management
AI quantifies risk using predictive models that estimate Value at Risk (VaR), expected shortfall, or drawdown probabilities.
By analyzing correlations and stress scenarios, traders can better prepare for sudden market downturns or black swan events.
4. Role of Big Data in Stock Market Analysis
Modern financial markets produce terabytes of data every day, including:
Price and volume data from multiple exchanges
Corporate filings and earnings reports
Global macroeconomic indicators
Alternative data like satellite images, foot traffic, or credit card transactions
AI and analytics platforms integrate these datasets to extract valuable insights.
For example:
Hedge funds use satellite imagery to estimate retail store performance.
Credit card data is used to forecast quarterly earnings before official reports are released.
This “alternative data revolution” gives institutions an informational edge that traditional analysis cannot provide.
5. Benefits of AI and Data Analytics in Stock Market Decisions
Speed and Efficiency: AI can process millions of data points in seconds, enabling rapid and informed decision-making.
Accuracy: Predictive models reduce human bias and emotional trading.
Automation: Reduces manual analysis and allows automated trade execution.
Risk Reduction: Helps identify potential losses early through predictive risk assessment.
Data-Driven Insights: Converts raw market data into actionable intelligence.
These advantages help both retail traders and institutional investors stay competitive in increasingly complex markets.
6. Limitations and Challenges
Despite their power, AI and analytics tools face several limitations:
Data Quality Issues: Inaccurate or biased data can lead to faulty predictions.
Overfitting: Models that perform well on historical data might fail in live markets due to changing dynamics.
Black Box Problem: Deep learning models often lack interpretability, making it hard to explain why they make certain predictions.
Market Volatility: AI cannot always predict sudden events like geopolitical crises or natural disasters.
Ethical and Regulatory Concerns: Automated trading systems can cause flash crashes or manipulate markets unintentionally.
Hence, while AI enhances decision-making, human oversight remains crucial.
7. The Future of AI in Stock Market Decision-Making
The next phase of financial technology will see even deeper integration of AI, quantum computing, and blockchain in trading ecosystems.
Quantum AI may process financial data exponentially faster, enabling near-instant decision-making.
Explainable AI (XAI) will make algorithms more transparent and trustworthy.
AI-Blockchain integration will ensure secure, auditable, and tamper-proof trading records.
Additionally, personalized AI assistants will help individual investors make smarter decisions based on their unique profiles and preferences.
8. Real-World Examples
JP Morgan’s COiN platform uses AI to review legal documents and extract key data for risk evaluation.
Goldman Sachs’ Marcus employs data analytics for consumer lending and investment recommendations.
Kavout’s Kai Score leverages machine learning to rank stocks based on predictive factors.
Indian brokerages such as Zerodha, Upstox, and ICICI Direct are adopting AI-based tools to help clients identify trading opportunities and manage portfolios efficiently.
9. Conclusion
AI and data analytics have redefined the rules of stock market participation. What was once a game of intuition and experience has now become a science of data, prediction, and automation.
By integrating AI into trading strategies, investors can gain a deeper understanding of market dynamics, identify hidden opportunities, and manage risk with greater precision.
However, successful use of AI in stock market decisions requires a balance between machine intelligence and human judgment. Machines can crunch numbers and identify trends, but human insight, discipline, and adaptability remain irreplaceable.
Ultimately, the collaboration between humans and AI will continue to shape the future of intelligent investing, driving markets toward more efficiency, transparency, and innovation.
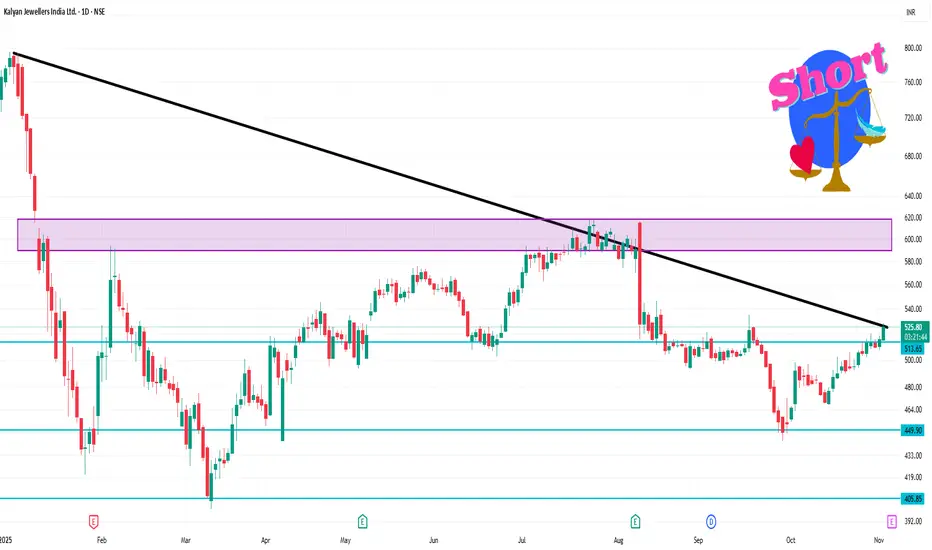
KALYANKJIL 1 Day Time frame✅ Important Levels
Pivot Point (daily): ~ ₹ 514.
Resistance Levels:
R1 ≈ ₹ 519
R2 ≈ ₹ 526
R3 ≈ ₹ 531 and above
Support Levels:
S1 ≈ ₹ 507
S2 ≈ ₹ 502
S3 ≈ ₹ 495 (or slightly below)
Retail Participation Surge via GIFT Nifty & Offshore Derivatives1. Understanding GIFT Nifty: India’s Gateway to Global Trading
The GIFT Nifty, previously known as the SGX Nifty, is a derivative contract based on the Nifty 50 Index, now traded on the India International Exchange (India INX) and the NSE International Exchange (NSE IX), both operating within the GIFT City (Gujarat International Finance Tec-City) in Gandhinagar, Gujarat.
Initially, foreign investors traded Indian index derivatives through the Singapore Exchange (SGX) under SGX Nifty futures. However, in 2023, these contracts migrated to GIFT City under the International Financial Services Centre (IFSC) framework. This move brought trading closer to home while maintaining global accessibility and regulatory efficiency.
The key goal was to make India a global hub for financial services, allowing domestic and international investors to access Indian markets in a transparent, well-regulated, and tax-efficient manner.
2. The Rise of Retail Participation
Retail investors — individual traders investing with their personal capital — have become a dominant force in India’s equity and derivative markets. With the success of discount brokers, digital trading platforms, and the pandemic-era liquidity boom, Indian retail participation in equities reached historic highs.
However, the launch and global accessibility of GIFT Nifty has now extended this participation to international derivative markets. Retail traders who previously traded only on domestic exchanges like NSE and BSE are now able to gain exposure to Nifty futures and options in an international jurisdiction.
Several factors have contributed to this retail surge:
Ease of access via digital platforms and international brokers linked to GIFT City.
Tax benefits under IFSC regulations, including zero capital gains tax for non-residents.
Extended trading hours, allowing participation even when domestic markets are closed.
Low transaction costs and minimal regulatory hurdles for offshore trading accounts.
This convergence has allowed retail investors to trade round-the-clock, hedge positions efficiently, and participate in a globally aligned Indian derivative ecosystem.
3. Offshore Derivatives: Opening Global Avenues for Retail Traders
Offshore derivatives are financial instruments linked to Indian assets but traded outside the domestic market. They provide exposure to Indian equities, indices, or debt without requiring direct ownership of the underlying securities.
Historically, instruments like Participatory Notes (P-Notes) were used by institutional investors. But with GIFT Nifty and IFSC-listed derivatives, even retail traders can participate indirectly in the offshore segment.
Retail access to offshore derivatives offers key advantages:
Diversification: Traders can access multiple markets — from Nifty and Sensex indices to global indices like S&P 500 or FTSE — within a single account.
Leverage benefits: Offshore platforms often provide higher leverage, enhancing speculative and hedging opportunities.
Hedging currency risk: With the availability of USD-denominated contracts at GIFT City, traders can protect against INR fluctuations.
Global exposure: Investors can trade Indian instruments while benefiting from international market standards and liquidity.
4. GIFT City as a Catalyst for Retail Globalization
The establishment of GIFT City IFSC has been pivotal in enabling retail and institutional participation alike. Designed as a global financial hub, it offers infrastructure comparable to international centers like Dubai or Singapore.
GIFT City’s role includes:
Hosting NSE IX and BSE INX, where international versions of Indian indices are traded.
Providing foreign currency settlements, primarily in USD, reducing conversion risks.
Offering tax neutrality and regulatory clarity under IFSCA (International Financial Services Centres Authority).
Attracting both foreign brokers and Indian fintech platforms to serve global retail clients.
For retail traders, GIFT City bridges the gap between domestic markets and global derivatives, creating a seamless ecosystem that encourages participation beyond India’s borders.
5. The Technology Revolution Driving Retail Entry
The surge in retail participation via GIFT Nifty and offshore derivatives is inseparable from the technological revolution in trading. Online trading apps, global brokerage tie-ups, and API-based trading solutions have made it effortless for individuals to access IFSC exchanges.
Innovations such as:
Algorithmic trading and copy trading tools,
Seamless onboarding through digital KYC, and
Integration with global payment systems
have lowered entry barriers and increased transparency.
Moreover, educational content and social media trading communities have empowered retail investors to understand global derivatives and execute sophisticated strategies, including hedging and arbitrage between NSE and GIFT Nifty prices.
6. Extended Market Hours: A New Opportunity Window
One of the defining advantages of GIFT Nifty is its longer trading window. Unlike domestic exchanges, which close by 3:30 PM IST, GIFT Nifty operates from 6:30 AM to 11:30 PM IST, overlapping both Asian and European trading sessions.
This feature allows:
Pre-market trend analysis based on global cues.
Hedging during US market hours when significant macroeconomic data is released.
24-hour access to Indian index movement, which appeals to global retail traders.
Extended hours also enhance liquidity and price discovery, as retail and institutional traders react in real-time to international events.
7. Regulatory Framework & Safeguards
The International Financial Services Centres Authority (IFSCA) governs all activities at GIFT City, ensuring that retail participation occurs within a secure and transparent framework.
Key safeguards include:
Investor protection norms aligned with global standards.
KYC/AML compliance to prevent misuse of offshore accounts.
Transparent margining and settlement processes under international oversight.
This ensures that even as participation widens, market integrity and financial stability remain uncompromised.
8. The Broader Impact on India’s Financial Ecosystem
The retail surge through GIFT Nifty and offshore derivatives has several macro-level benefits:
Increased liquidity: Higher participation enhances market depth and efficiency.
Global visibility: India strengthens its position as an emerging hub for international financial services.
Capital inflows: Offshore participation channels global capital back into Indian markets.
Financial innovation: The expansion encourages the development of new derivative products and cross-border instruments.
This growth aligns with India’s vision of “Viksit Bharat 2047”, where financial markets play a central role in economic globalization.
9. Challenges & the Road Ahead
Despite its promise, the surge in retail participation also brings challenges:
Risk of over-leverage: Many retail traders may lack sufficient understanding of derivative risks.
Regulatory coordination: Balancing domestic SEBI rules and IFSC frameworks requires ongoing alignment.
Market volatility: Increased speculative activity can cause sharp price movements in index futures.
To sustain growth responsibly, financial literacy, risk management tools, and investor education programs must evolve in parallel.
10. Conclusion
The surge in retail participation via GIFT Nifty and offshore derivatives symbolizes India’s integration into the global trading ecosystem. GIFT City has emerged as a transformative gateway, enabling both Indian and global traders to access Indian markets seamlessly.
For retail participants, this marks the dawn of a new era — one defined by borderless access, extended hours, tax efficiency, and technological empowerment. As participation deepens and regulation strengthens, India’s financial markets are poised to become a global benchmark for inclusivity, innovation, and international connectivity.
In essence, GIFT Nifty and offshore derivatives are not just instruments of trading; they are symbols of India’s financial maturity, bridging local ambition with global opportunity.

Introduction to Indian Financial Markets1. Structure of Indian Financial Markets
The Indian financial market is broadly divided into two segments:
Money Market – Deals with short-term funds (maturity up to one year).
Capital Market – Deals with long-term funds (maturity more than one year).
Each of these segments has multiple sub-markets and instruments designed to cater to specific financial needs.
2. Money Market
The money market provides liquidity for the economy by enabling short-term borrowing and lending. It is crucial for maintaining the stability of financial institutions and ensuring that businesses and the government have access to short-term financing.
Key Instruments of the Money Market:
Treasury Bills (T-Bills): Issued by the Reserve Bank of India (RBI) on behalf of the government for short-term borrowing.
Commercial Papers (CP): Unsecured promissory notes issued by corporations to raise short-term funds.
Certificates of Deposit (CD): Negotiable time deposits issued by commercial banks.
Call and Notice Money: Very short-term loans between banks to manage daily liquidity needs.
Repurchase Agreements (Repo and Reverse Repo): Short-term borrowing/lending against government securities.
The money market in India is regulated by the Reserve Bank of India (RBI), which ensures stability, transparency, and adequate liquidity.
3. Capital Market
The capital market facilitates the raising of long-term capital by companies and governments through the issue of shares, bonds, and other securities. It also provides investors with opportunities to earn returns by investing in these instruments.
The capital market is divided into two segments:
Primary Market: Where new securities are issued (Initial Public Offerings or IPOs).
Secondary Market: Where existing securities are traded (Stock Exchanges).
Major Institutions in the Capital Market:
Stock Exchanges: The two leading stock exchanges are the Bombay Stock Exchange (BSE) and the National Stock Exchange (NSE).
Securities and Exchange Board of India (SEBI): The regulatory authority overseeing capital markets to protect investors and promote fair trading.
Depositories: Institutions like NSDL (National Securities Depository Limited) and CDSL (Central Depository Services Limited) that facilitate electronic holding and transfer of securities.
Key Instruments of the Capital Market:
Equity Shares: Represent ownership in a company.
Debentures and Bonds: Long-term debt instruments.
Mutual Funds: Investment vehicles pooling funds from multiple investors.
Derivatives: Financial contracts like futures and options that derive value from underlying assets.
Exchange-Traded Funds (ETFs): Funds traded on exchanges like stocks.
4. Role of Financial Institutions
A variety of institutions operate within the Indian financial market to ensure smooth functioning and growth:
Banks: The backbone of the financial system, offering deposit, credit, and investment services.
Non-Banking Financial Companies (NBFCs): Provide credit and financial services outside the traditional banking system.
Insurance Companies: Mobilize long-term funds through life and general insurance.
Mutual Funds and Asset Management Companies (AMCs): Provide collective investment options.
Development Financial Institutions (DFIs): Such as NABARD, SIDBI, and EXIM Bank, which support industrial, agricultural, and export financing.
5. Regulatory Framework
The Indian financial market is regulated by several key institutions to maintain transparency, protect investors, and ensure financial stability:
Reserve Bank of India (RBI): Regulates the banking system and money market, controls inflation, and manages monetary policy.
Securities and Exchange Board of India (SEBI): Regulates the capital market and protects investor interests.
Insurance Regulatory and Development Authority of India (IRDAI): Supervises the insurance sector.
Pension Fund Regulatory and Development Authority (PFRDA): Oversees pension funds and the National Pension System (NPS).
Ministry of Finance (MoF): Frames financial policies and oversees public finances.
These institutions collectively ensure that India’s financial markets remain efficient, stable, and globally competitive.
6. Evolution of Indian Financial Markets
India’s financial market has undergone significant transformation over the past few decades:
Pre-Liberalization Era (Before 1991): The market was tightly regulated with limited investment options and government-controlled interest rates.
Post-Liberalization Era (After 1991): Economic reforms introduced free-market mechanisms, liberalized capital inflows, and promoted private sector participation.
Technological Advancements: The introduction of electronic trading, online demat accounts, and real-time settlement systems improved efficiency and transparency.
Global Integration: Increased participation by foreign institutional investors (FIIs) and global listing opportunities expanded India’s financial reach.
Today, India’s financial markets are well-diversified, globally recognized, and supported by a robust technological and regulatory framework.
7. Participants in Indian Financial Markets
The Indian financial ecosystem comprises various participants:
Retail Investors: Individuals investing in shares, mutual funds, and bonds.
Institutional Investors: Entities like mutual funds, insurance companies, pension funds, and banks.
Foreign Investors: Including Foreign Institutional Investors (FIIs) and Foreign Portfolio Investors (FPIs).
Corporate Entities: Raising capital through equity or debt.
Government: Issuing securities to finance public expenditure.
Each participant contributes to market liquidity, depth, and efficiency.
8. Importance of Indian Financial Markets
The financial market plays a crucial role in the nation’s economic framework:
Mobilization of Savings: Channels individual and institutional savings into productive investments.
Efficient Resource Allocation: Ensures funds flow to sectors with higher growth potential.
Capital Formation: Encourages entrepreneurship and industrial expansion.
Price Discovery: Reflects economic trends through demand and supply of securities.
Economic Stability: Helps manage inflation, liquidity, and interest rates.
Wealth Creation: Offers opportunities for individuals and institutions to build financial assets.
9. Challenges Facing Indian Financial Markets
Despite progress, the Indian financial system faces several challenges:
Financial Illiteracy: A large portion of the population remains unaware of investment opportunities.
Regulatory Complexity: Multiple regulators can sometimes lead to overlapping responsibilities.
Market Volatility: Global economic uncertainty affects capital inflows and investor sentiment.
Limited Depth in Bond Market: The corporate bond market remains underdeveloped compared to equity markets.
Technology Risks: Increased digitalization exposes markets to cyber threats.
Efforts are ongoing to address these challenges through reforms, education, and stronger governance.
10. Future of Indian Financial Markets
The future of Indian financial markets looks promising. With initiatives like Digital India, Financial Inclusion (Jan Dhan Yojana), and Unified Payments Interface (UPI), India is building a modern, inclusive, and technology-driven financial system.
The rise of fintech startups, blockchain applications, and AI-driven analytics is expected to enhance transparency, speed, and participation. Moreover, India’s growing middle class and global economic presence are likely to attract more domestic and international investments.
Conclusion
The Indian financial market stands as a cornerstone of the country’s economic engine. From traditional banking to sophisticated capital market instruments, it provides a dynamic platform for growth, investment, and innovation. Supported by strong regulatory institutions like the RBI and SEBI, and driven by technology and globalization, India’s financial markets continue to evolve rapidly.
As India progresses toward becoming a $5 trillion economy, a robust, transparent, and inclusive financial system will remain essential to sustain growth, attract investments, and empower millions of citizens to participate in the nation’s economic journey.
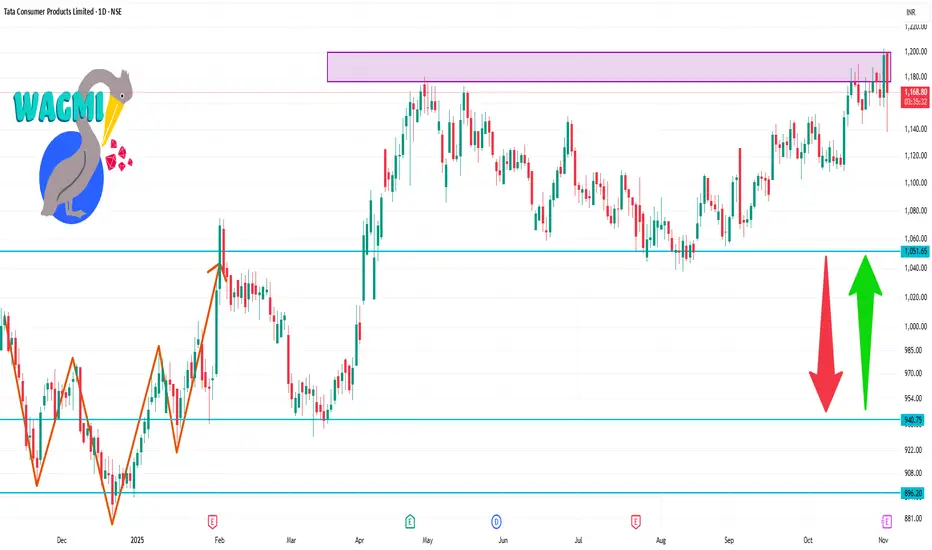
TATACONSUM 1 Day Time Frame 📊 Current Price Snapshot
Last traded around ₹ 1,155.30 on the NSE.
Day’s trading range (approx) ~ ₹ 1,157.20 to ₹ 1,169.40.
52-week range: ~ ₹ 882.90 (low) to ~ ₹ 1,191.20 (high).
🔍 Important Support & Resistance Levels
Resistance: ~ ₹ 1,170-1,190 zone (recent highs near 1,191).
Immediate Support: ~ ₹ 1,140-1,150 (recent price clustering).
Secondary Support: ~ ₹ 1,110-1,120 (if the first support fails).
Major Structural Support: ~ ₹ 1,020-1,030 (in case of deeper correction).
Part 4 Learn Institutional Trading What Are Options?
An option is a financial derivative contract that gives the holder the right, but not the obligation, to buy or sell an underlying asset—such as a stock, index, or commodity—at a predetermined price (called the strike price) within a specified period.
There are two main types of options:
Call Option – gives the holder the right to buy the underlying asset at the strike price before expiry.
Put Option – gives the holder the right to sell the underlying asset at the strike price before expiry.
The person who buys an option is called the option buyer or holder, while the person who sells (writes) the option is called the option writer or seller.

GOLD TRADING INSIGHTS TODAY WITH LUCYGOLD TRADING INSIGHTS TODAY WITH LUCY 💛
Hello everyone 🌸
The gold market (XAUUSD) today is showing many interesting signals as the price continues to test the crucial trendline area. Traders' sentiment is quite cautious at the moment – both buyers and sellers are “squaring off” around the liquidity balance zone.
🔍 Technical Analysis
On the chart, gold is moving within a narrowing triangle price channel – this indicates momentum is accumulating, and when the price breaks in either direction, the subsequent volatility will be very strong ⚡
Currently, the price is reacting around the main trendline, but there is no clear breakout signal yet.
In my personal view, the probability of a decline remains higher, however, further confirmation is needed before entering a trade.
The important point to note is the support area at 3965, which is the key boundary to confirm a clear downtrend.
If the price breaks through this area, the possibility of extending towards the Fibonacci 2.618 area around 3890 is entirely possible.
⚙️ Price Levels to Watch
Currently, the 3990 – 4012 area is short-term resistance, where sellers may reappear.
Meanwhile, the 3965 – 3945 – 3920 areas are the main supports that need close observation.
If the price continues to hold above 3945, the likelihood of a short-term rebound is quite high.
🎯 Today's Trading Scenario
💼 Buy: 3945
⛔ SL: 3938
🎯 TP: 3958 – 3977 – 3992 – 4012
💼 Sell: When the price clearly breaks below support 3965
⛔ SL: Above the breakout area
🎯 Expected TP: extending towards the Fibonacci 2.618 area around 3890
I still prefer to observe the price reaction at the trendline area, and only act when there is clear confirmation — because in a triangle pattern, the patient one will always be the winner 🌙
⚠️ Note & Conclusion
The above analysis reflects only Lucy's personal perspective, based on Trendline – Fibonacci – ICT factors 📊
This is not investment advice.
Please share your views on gold in the comments section 💬
And don't forget to follow Lucy for daily updates on insightful analyses —
where technical analysis merges with market emotions 💫🌸

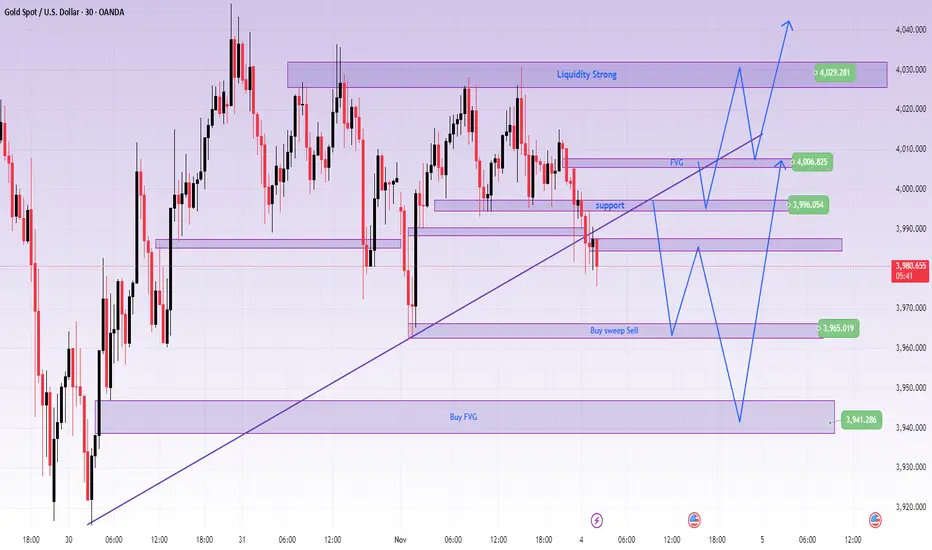
GOLD CONFIRMS SHORT-TERM DECLINE AFTER BREAKING TRENDLINEXAUUSD – GOLD CONFIRMS SHORT-TERM DECLINE AFTER BREAKING TRENDLINE
🪞 1. Overview
🌤️ In the Asian session this morning, gold broke the upward trendline even though the selling pressure wasn't particularly strong.
However, this is the first signal indicating that the short-term trend is leaning towards the sellers.
💬 Currently, the 3996 level is a significant resistance, and the price might retest this area before continuing to decline.
If the price surpasses the FVG at 4007, the trend might temporarily rebound in the short term.
💹 2. Technical Analysis (ICT Perspective)
🔸 Market structure: After breaking the trend, the structure temporarily shifts to short-term bearish.
🔸 Liquidity & FVG: Liquidity is drawn to the 3960–3940 area, while FVG 4007 is the first barrier.
🔸 Order Flow: Smart Money may lightly sweep up to the resistance area before pushing the price further down.
🎯 3. Reference Trading Scenarios
💔 MAIN SELL
Entry: 3996 | SL: 4004
TP: 3985 – 3972 – 3948
💢 SELL scalping
Entry: 4007 | SL: 4014
TP: 3998 – 3978
💖 REACTIVE BUY
Entry: 3965 | SL: 3957
TP: 3976 – 3988 – 3999
🌸 DEEP BUY
Entry: 3941 | SL: 3931
TP: 3955 – 3968 – 3988 – 4012 – 4066
🔍 4. Price Levels to Note
✨ 4007 → FVG resistance, short-term trend confirmation area
✨ 3996 → Retest area of the broken trendline
✨ 3965 – 3941 → Strong support area, likely to see reversal reactions
💬 5. Notes & Call for Interaction
⚠️ This is not an investment recommendation, but merely a personal technical perspective following the ICT method.
Observe the price reaction around the trendline carefully before making a decision 💭
If you find this post helpful, please 💛 like – 💬 leave a comment – 🔔 follow LanaM2
to stay updated with daily gold insights and learn more about the Smart Money Concept 🌷✨