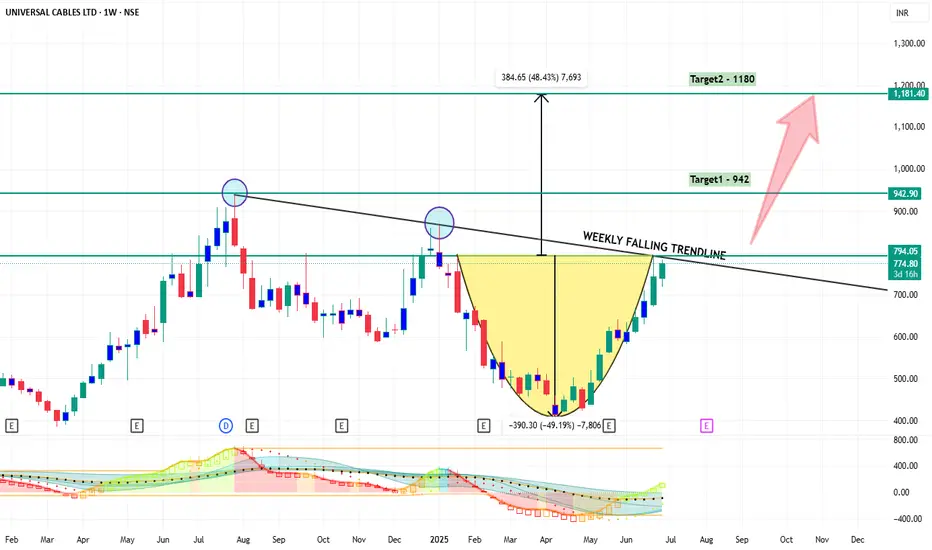
Rounding Bottom & Trendline BreakoutUniversal Cables Looks like a good candidate for a good upswing
Rounding bottom in weekly timeframe along with a weekly downwards trendline breakout above 800 levels should give a good breakout for
Target1 = 942
Targer2 - 1180
Cable industry has been in the recent news as some giants are looking to invest in the next couple of years
Looks like a multibagger but please do your fundamental analysis
Trend Lines
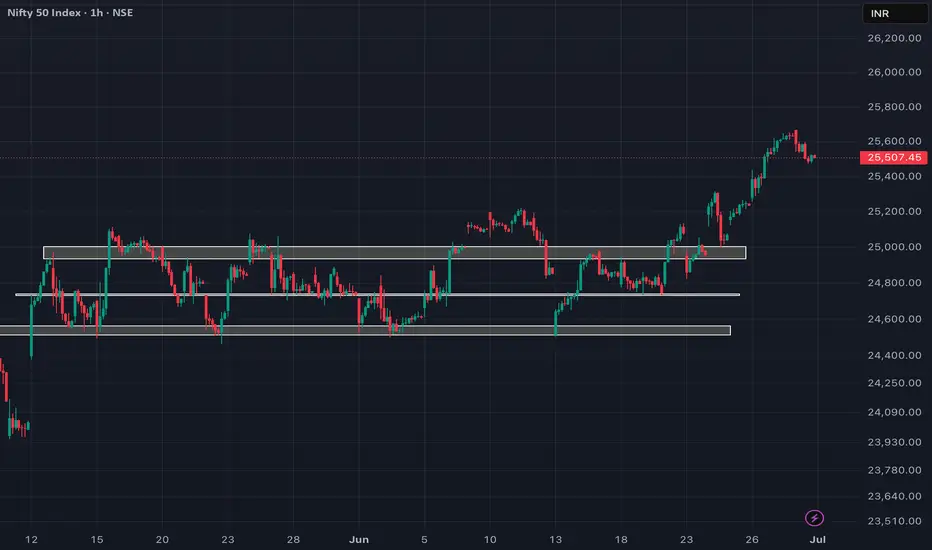
NIFTY rejected exactly as analysed!!As we can see NIFTY can be seen rejected before reaching our level but it was the gap which was mentioned in our analysis and it did get rejected exactly from our given levels hence as long as a 25750 is broken and sustained above every rise can be sold so plan your trades accordingly and keep wathcing everyone.
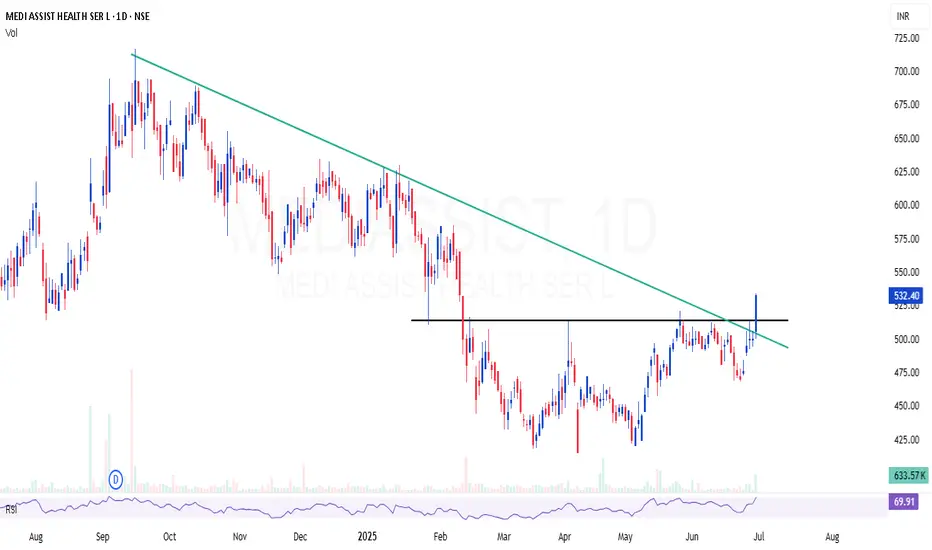
MEDIASSIST | High probable setup - Looks good for 30%MEDIASSIST | High probable setup - Looks good for 30%
Technically, the stock is strong and recent news—like the Star Health deal—is positive. The coming lock-in expiry, however, could trigger volatility. With solid digital expansion but elevated valuation, it's likely attractively positioned yet not without risk.
CMP : 532 (Dip : 500)
SL : 470
LICHSGFIN | Small flag setup (Small but convincing)LICHSGFIN | Small flag setup (Small but convincing)
Looks good for 25- 30% with good risk reward
Keep SL below 530

Shorting BTCUSD After Trendline Failure & Bearish RetestPlanning to short BTCUSD as price has rejected from the descending trendline resistance after breaking the minor ascending trendline support. The confluence of trendline rejection and bearish retest suggests potential downside continuation.
Entry Zone: ~107,300–107,350
Stop-Loss: Above 107,550 (recent high)
Target: 106,550 support area
Risk-to-Reward Ratio: ~1:2 (Min) 1:4 (Final Target)
Quote:
"Trendline confluence and failed bullish continuation often lead to deeper pullbacks."
📊 Summary of the Idea
✅Reason for Entry: Multiple rejections at trendline + structure breakdown.
✅Confirmation: Retest rejection candle.
✅Invalidation: A clean breakout and hold above the descending trendline.

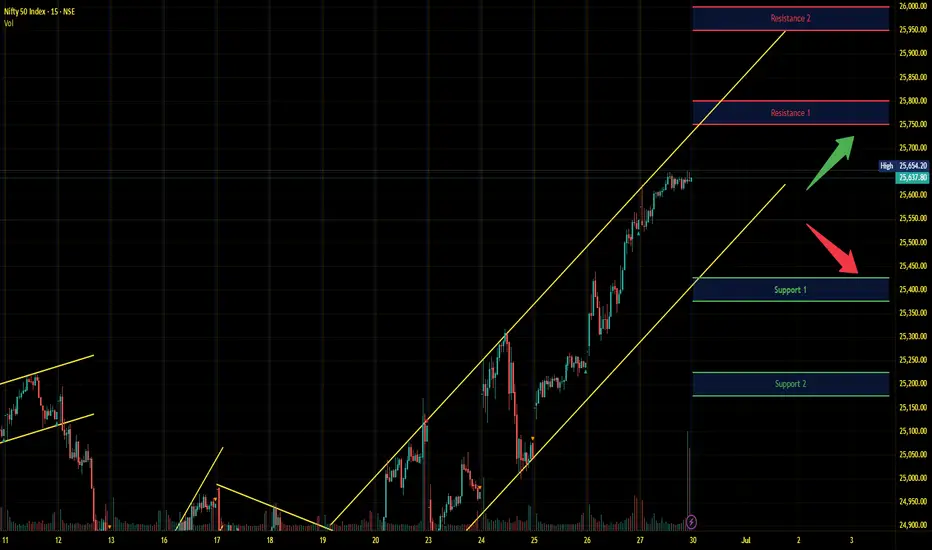
Nifty Intraday Analysis for 30+th June 2025NSE:NIFTY
Index has resistance near 25750 – 25800 range and if index crosses and sustains above this level then may reach near 25950 – 26000 range.
Nifty has immediate support near 25425 – 25375 range and if this support is broken then index may tank near 25225 – 25175 range.
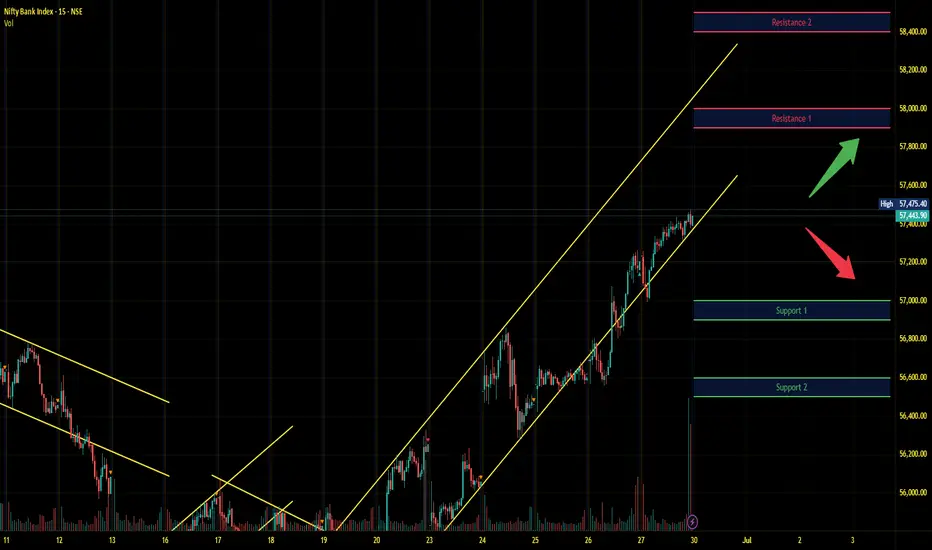
Banknifty Intraday Analysis for 30th June 2025NSE:BANKNIFTY
Index has resistance near 57900 – 58000 range and if index crosses and sustains above this level then may reach near 58400 – 58500 range.
Banknifty has immediate support near 57000 - 56900 range and if this support is broken then index may tank near 56600 - 56500 range.
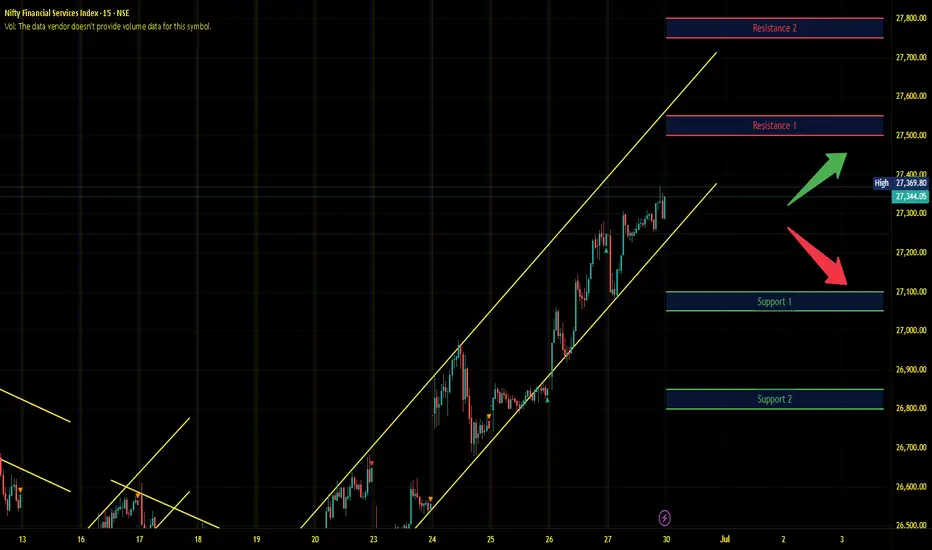
Finnifty Intraday Analysis for 30th June 2025NSE:CNXFINANCE
Index has resistance near 27500 - 27550 range and if index crosses and sustains above this level then may reach near 27750 - 27800 range.
Finnifty has immediate support near 27150 – 27050 range and if this support is broken then index may tank near 26850 – 26800 range.
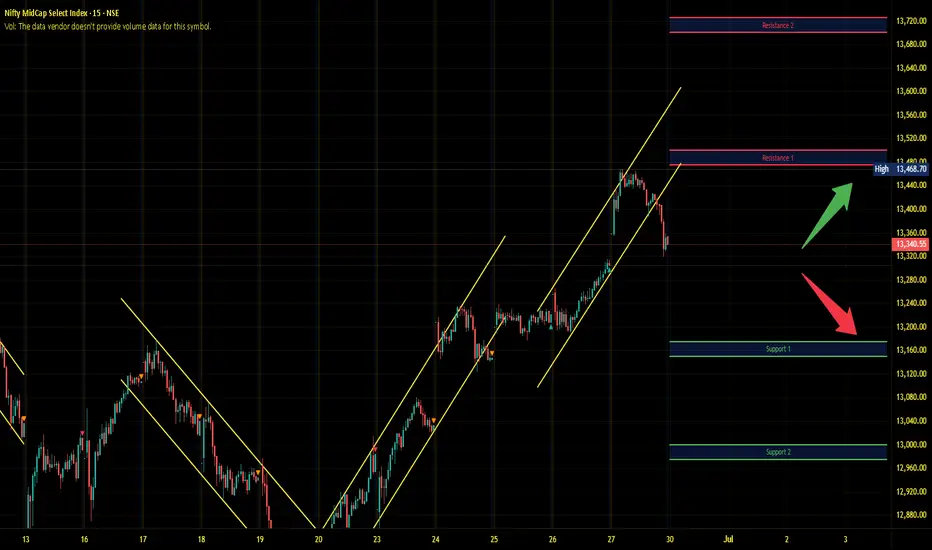
Midnifty Intraday Analysis for 30th June 2025NSE:NIFTY_MID_SELECT
Index has immediate resistance near 13475 – 13500 range and if index crosses and sustains above this level then may reach 13700 – 13725 range.
Midnifty has immediate support near 13175 – 13150 range and if this support is broken then index may tank near 13000 – 12975 range.
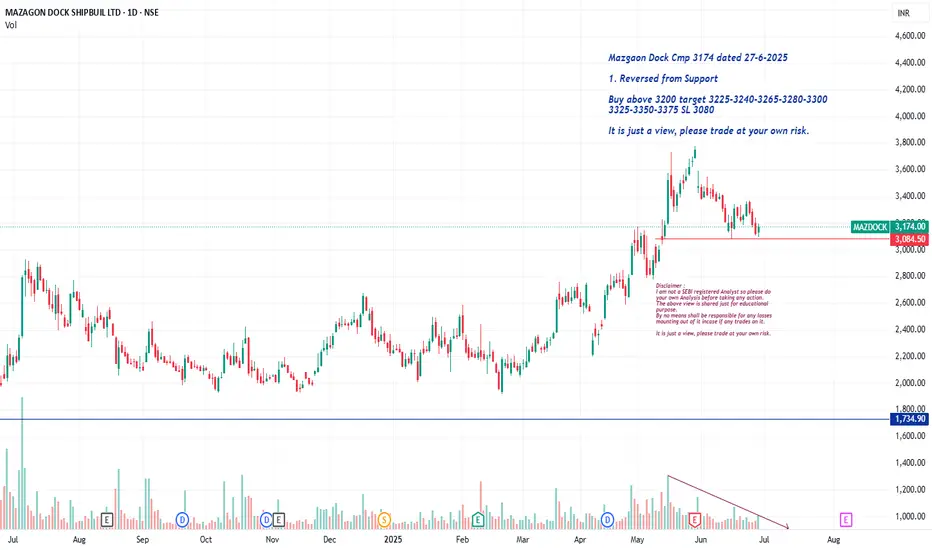
Mazgaon Dock Cmp 3174 Reversed from Support Mazgaon Dock Cmp 3174 dated 27-6-2025
1. Reversed from Support
Buy above 3200 target 3225-3240-3265-3280-3300
3325-3350-3375 SL 3080
It is just a view, please trade at your own risk.
SBI Ready for 10% Upside in Short termOn Monthly TF
Taken Support At Lower Parallel Channel 20MEMA
On Weekly TF
Inverted HNS Breakout and Retest Completed at 100 WEMA And trading above 20 and 50 WEMA
Above 810 Shorts may start Covering
Trade Activates above 810
SL below 775
Targeting 890
R:R = 2.5
Downside To Trade Idea: Trendline Breakout Pending

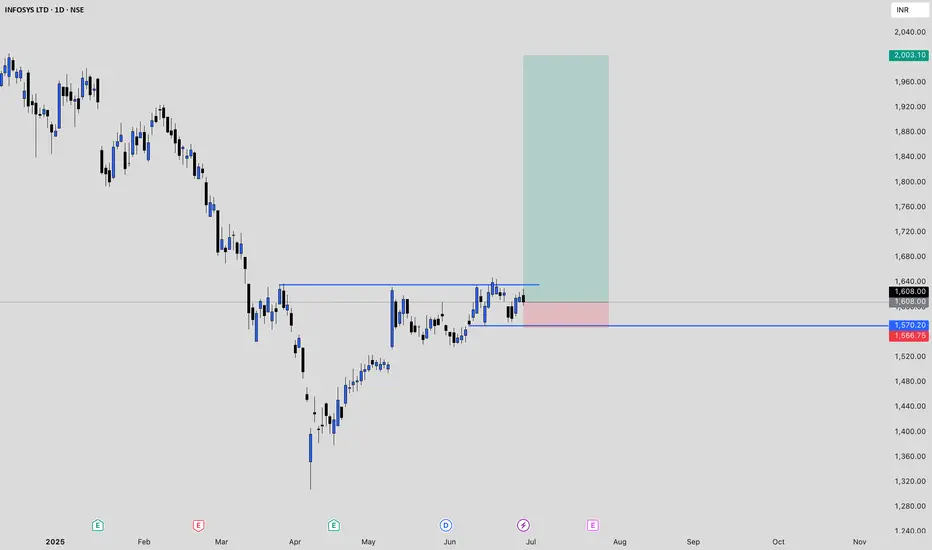
Infy Price actionInfosys (INFY) is currently trading around ₹1,608, with recent fluctuations between ₹1,606 and ₹1,629. Over the past year, the stock has delivered modest gains, slightly underperforming broader market indices and the IT sector. Financially, Infosys remains robust, maintaining strong revenues, healthy profit margins, and a debt-free balance sheet. The company continues to reward shareholders with consistent dividends, including a recent payout of ₹22 per share.
Looking ahead, growth expectations for Infosys are muted. The company has projected revenue growth of just 0–3% for the upcoming fiscal year, citing macroeconomic uncertainties and cautious client spending in its key markets. This represents one of the lowest growth forecasts for Infosys in over a decade and reflects broader industry headwinds, including delayed client decision-making and a focus on cost optimization.
Analyst sentiment is generally positive but cautious, with most maintaining a buy or hold rating. Price forecasts for the next year range from ₹1,667 to ₹1,945, indicating limited upside from current levels. Technical analysis shows immediate support near ₹1,579 and resistance around ₹1,633, suggesting the stock is likely to remain range-bound in the near term.
In summary, Infosys is financially sound and offers stable dividends, but near-term growth is expected to be subdued due to global economic challenges and restrained client budgets. The stock is more attractive for investors seeking stability and income rather than aggressive capital appreciation at this stage.
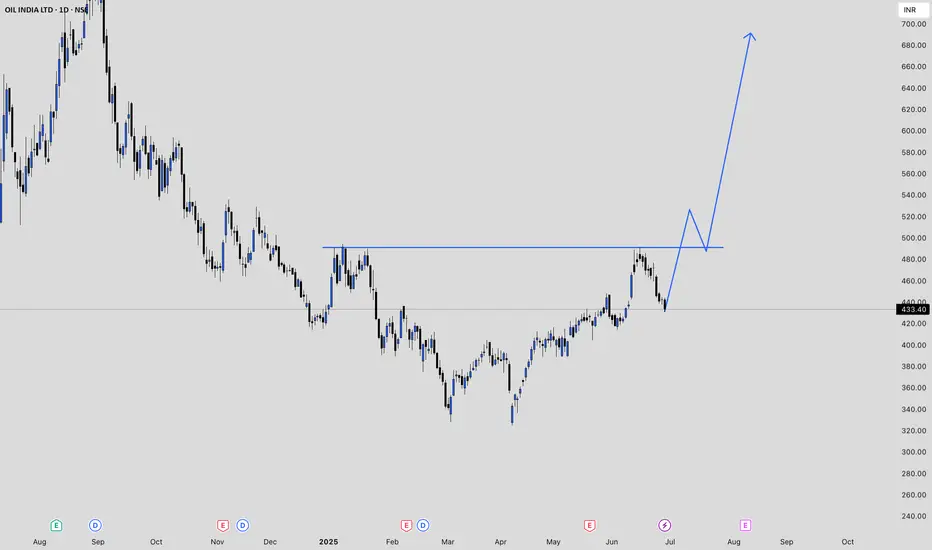
OIL Price ActionOil India Limited is currently trading at ₹433.40 as of June 27, 2025. The stock has seen a notable decline over the past week, falling by nearly 7%. Over the last month, the price has remained relatively flat, with a slight gain of about 0.5%. Looking at a broader time frame, the stock is up 12% over the past three months and has gained just under 2% in the last six months.
The 52-week high for Oil India stands at ₹767.90, while the low is ₹325.00, indicating that the stock is trading well below its peak for the year. Recent sessions have shown increased volatility, with sharp movements both up and down. For example, the stock dropped over 5% in a single day on June 24, after previously rallying above ₹470 earlier in the month.
Oil India’s price-to-earnings (PE) ratio is 10.98, and the price-to-book (PB) ratio is 1.32, suggesting the stock is reasonably valued compared to its historical averages and sector peers. The company maintains a market capitalization of around ₹70,500 crore, ranking it among the larger players in India’s gas and petroleum sector.
In summary, Oil India Limited is currently in a correction phase after a strong run-up earlier this year. The stock is trading closer to its recent lows than its highs, with moderate valuation metrics and ongoing volatility. Investors should watch for further price stabilization before considering new positions.
NIFTY heading towards strong supply zone!as we can see NIFTY is heading towards 25750 levels which is both a strong supply zone and also psychological level hence NIFTY can extend upto this level before finally getting rejected at following level hence any signs of REJECTION around this zone can make fresh entries for short so planj your trades accordingly and keep watching everyone.

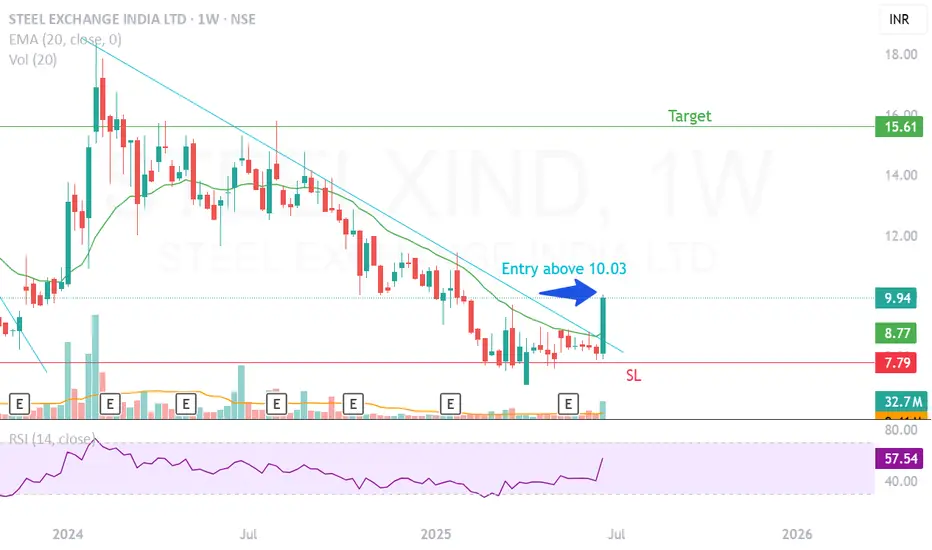
Trendline breakout in weekly Time frameLooks good for buying at this price .
The price was at key support level
trendline breakout happened in daily, weekly timeframe
can get best returns in short time when chased the target with trailing stoploss
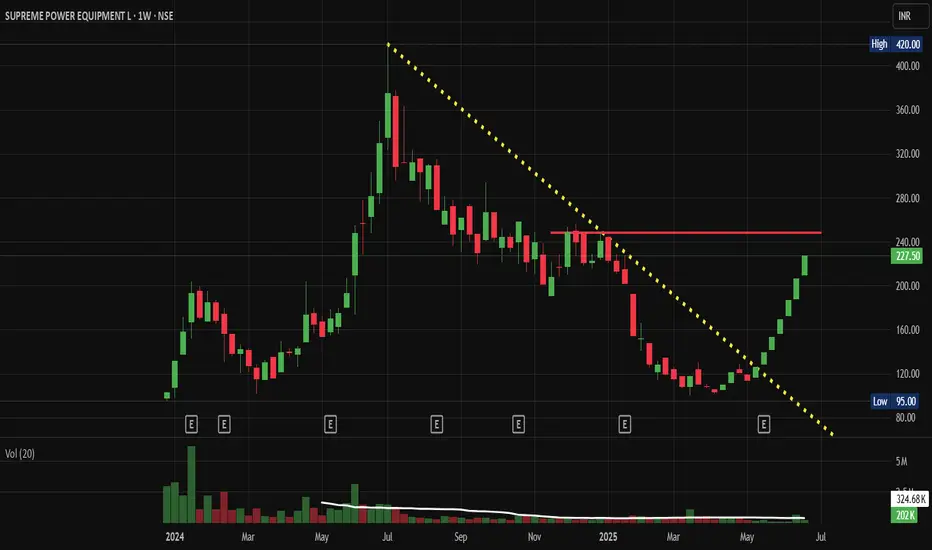
Supreme Power Equipment: Technically Strong, Chart of the MonthNSE:SUPREMEPWR Technically Strong Momentum is my pick in this month's "Chart of the Month"
Price Action Analsis:
- Stock currently trading at ₹227.50, up 21.35 (+10.36%), showing strong bullish momentum
- Recent breakout from a prolonged Correction phase that lasted from July 2024 to May 2025
- Price has successfully cleared multiple resistance levels and is now approaching previous highs
- Strong recovery from the March 2025 lows around ₹95-100 levels
Volume Spread Analysis:
- Current volume at 324.68K shares, significantly higher than the 20-day average
- Volume spike during the recent breakout confirms institutional participation
- Volume pattern shows accumulation during the consolidation phase
- Strong volume support during the current upward move validates the breakout
Key Technical Levels:
Support Levels:
- Immediate support: ₹210-215 (recent breakout level)
- Secondary support: ₹190-195 (previous resistance turned support)
- Major support: ₹160-170 (consolidation zone)
- Critical support: ₹120-130 (long-term moving average zone)
Resistance Levels:
- Immediate resistance: ₹240-250 (previous high zone)
- Major resistance: ₹280-290 (historical resistance)
- Ultimate target: ₹350-370 (measured move from base)
Base Formation:
- Clear accumulation base formed between ₹120-250 from July 2024 to May 2025
- Base depth of approximately 130 points provides a strong foundation
- Base duration of 10+ months indicates strong institutional accumulation
- Recent breakout from this base suggests potential for significant upward move
Technical Patterns:
- The cup and Handle pattern formation is visible on the monthly timeframe
- The ascending triangle breakout pattern recently completed
- Moving average convergence suggesting trend reversal
- RSI is likely showing bullish divergence from the March lows
Trade Setup:
Entry Strategy:
- Primary entry: ₹225-230 on any pullback to the breakout level
- Aggressive entry: Current market price ₹227.50 for momentum traders
- Conservative entry: Wait for retest of ₹210-215 support zone
- Scale-in approach: 50% at current levels, 50% on any dip to ₹215
Exit Levels:
- Target 1: ₹280 (24% upside) - Previous resistance zone
- Target 2: ₹320 (41% upside) - Measured move target
- Target 3: ₹370 (63% upside) - Ultimate breakout target
- Trailing stop: Use a 10% trailing stop once Target 1 is achieved
Stop-Loss:
- Initial stop-loss: ₹195 (14% downside risk)
- Breakeven stop: Move to ₹230 once price reaches ₹260
- Trailing stop: 8-10% below recent swing high
Position Sizing:
- Conservative investors: 2-3% of portfolio
- Moderate risk tolerance: 3-5% of portfolio
- Aggressive traders: 5-7% of portfolio (with tight stops)
- Maximum exposure: Not more than 7% given single stock concentration risk
Risk Management:
- Risk-reward ratio: 1:2 minimum for all positions
- Never risk more than 2% of the total portfolio on this single trade
- Use position sizing calculators to determine the exact share quantity
- Consider partial profit booking at each target level
- Monitor sector rotation and overall market conditions
Sectoral Backdrop:
Power Equipment Sector Overview:
- India's power sector is undergoing a massive transformation with a renewable energy push
- The government's target of 500 GW of renewable capacity by 2030 is driving equipment demand
- Infrastructure spending and rural electrification programs supporting sector growth
- PLI scheme for manufacturing provides additional tailwinds
Sector Challenges:
- Raw material cost inflation is impacting margins
- Supply chain disruptions affecting delivery timelines
- Intense competition from Chinese manufacturers
- Regulatory changes and policy uncertainties
Sector Opportunities:
- Make in India initiative favours domestic manufacturers
- Rising power demand from industrial and commercial sectors
- Smart grid implementation creating new revenue streams
- Export opportunities in emerging markets
Fundamental Backdrop:
Company Strengths:
- Established player in power transmission and distribution equipment
- Strong order book providing revenue visibility
- Diversified product portfolio, reducing concentration risk
- Experienced management team with industry expertise
Financial Health:
- Need to verify recent quarterly results for revenue and profit trends
- Debt levels and interest coverage ratios require monitoring
- Cash flow generation capability is important for sustained growth
- Return on equity and asset turnover metrics need evaluation
Growth Catalysts:
- Government infrastructure spending on the power sector
- Rural electrification and grid modernization projects
- Renewable energy integration requires specialized equipment
- Potential for export market expansion
Risk Factors:
- Dependence on government orders and policy changes
- Working capital-intensive business model
- Competition from larger players and imports
- Raw material price volatility affecting margins
My Take:
NSE:SUPREMEPWR exhibits a strong technical setup, characterised by a clear breakout from a well-formed base. The combination of volume confirmation, sector tailwinds, and government policy support creates a favourable risk-reward scenario. However, traders should maintain disciplined risk management and avoid overexposure to this single position.
Honourable Mentions:
Other stocks that have a good Setup
NSE:KIRLOSBROS , NSE:CGCL , NSE:SUNDRMFAST
Keep in the Watchlist.
NO RECO. For Buy/Sell.
📌Thank you for exploring my idea! I hope you found it valuable.
🙏FOLLOW for more
👍BOOST if you found it useful.
✍️COMMENT below with your views.
Meanwhile, check out my other stock ideas on the right side until this trade is activated. I would love your feedback.
Disclaimer: "I am not a SEBI REGISTERED RESEARCH ANALYST AND INVESTMENT ADVISER."
This analysis is intended solely for informational and educational purposes and should not be interpreted as financial advice. It is advisable to consult a qualified financial advisor or conduct thorough research before making investment decisions.
JSW ENERGY -- BULLISH VIEW-- EDUCATIONAL PURPOSEJSW ENERGY-- BULLISH VIEW-EDUCATIONAL PURPOSE
Bounced from trendline support
Sustained above trendline support for 6 weeks
Enter on slight correction -- Near 495-500
Target 1 : 730 (48%)-- previous resistance
Target 2 : 1184 (140%) -- (Fibo)-- Need to clear resistance near 770-- may enter in consolidation or reversal may be seen-- Need to be careful and patient
Stop loss : weekly closing below 420 (-16%)
Risk reward ratio
(for first target) : 1:3
(for second target) : 1:9
Time frame
1 st target : 18 months
2nd target : 36-40 months
Only long term (investment ) view, not for short term trading

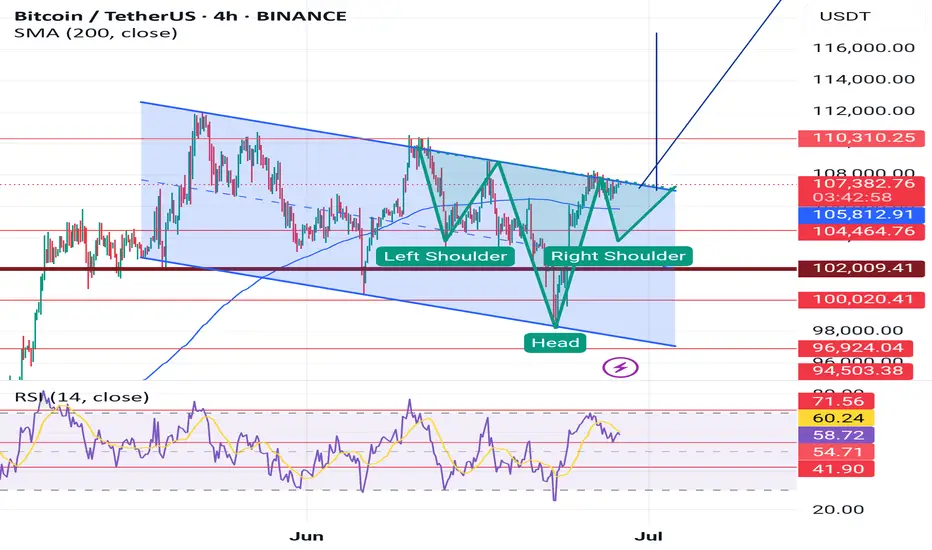
BTCUSDT creates another head and shoulder pattern BTC is creating inverse head and shoulder pattern in daily time frame as well as in 4H time frame, currently BTC is creating Bullish flag pattern in larger time frame and in that Bullish flag it's likely to create inverse head and shoulder pattern, however in both scenarios it's look Bullish with target of 1,17,000$ for inverse head and shoulder pattern, And 1,45,000$ for Bullish flag pattern, And in daily head and shoulder pattern target is 1,50,000$. It can come to retest 1,03,000$ to 1,04,000$ for LIQUIDITY purposes and to complete Right shoulder.
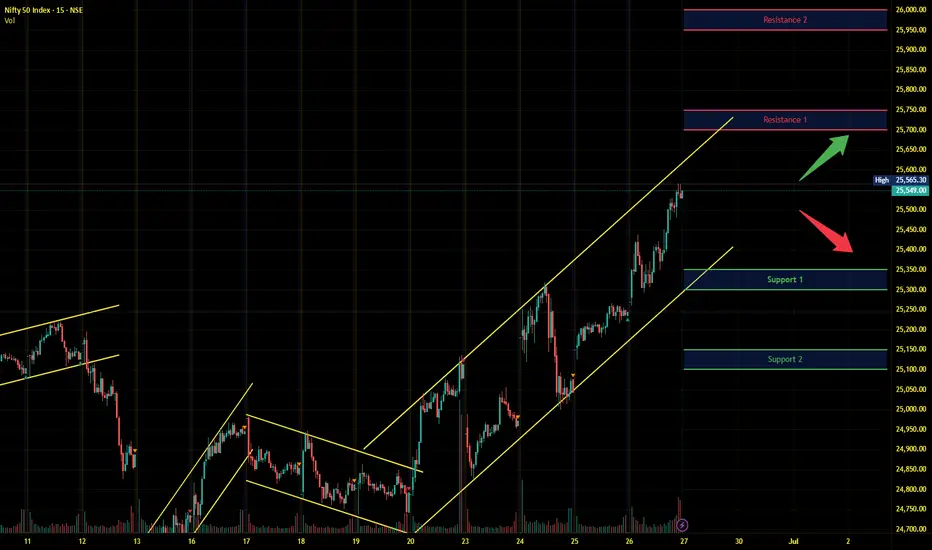
Nifty Intraday Analysis for 27th June 2025NSE:NIFTY
Index has resistance near 25700 – 25750 range and if index crosses and sustains above this level then may reach near 25950 – 26000 range.
Nifty has immediate support near 25350 – 25300 range and if this support is broken then index may tank near 25150 – 25100 range.
Banknifty Intraday Analysis for 27th June 2025NSE:BANKNIFTY
Index has resistance near 57500 – 57600 range and if index crosses and sustains above this level then may reach near 58000 – 58100 range.
Banknifty has immediate support near 56800 - 56700 range and if this support is broken then index may tank near 56300 - 56200 range.

Finnifty Intraday Analysis for 27th June 2025NSE:CNXFINANCE
Index has resistance near 27450 - 27500 range and if index crosses and sustains above this level then may reach near 27650 - 27700 range.
Finnifty has immediate support near 27050 – 27000 range and if this support is broken then index may tank near 26850 – 26800 range.

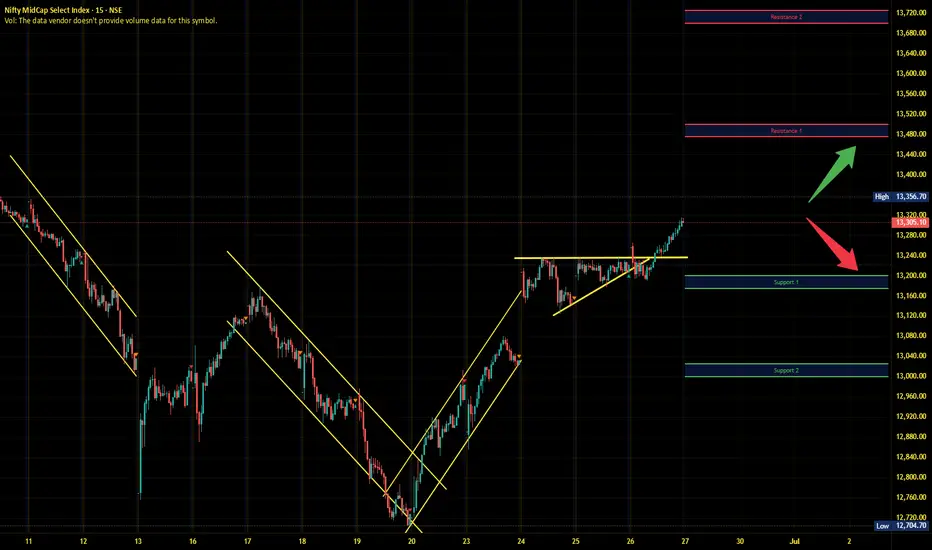
Midnifty Intraday Analysis for 27th June 2025NSE:NIFTY_MID_SELECT
Index has immediate resistance near 13475 – 13500 range and if index crosses and sustains above this level then may reach 13700 – 13725 range.
Midnifty has immediate support near 13200 – 13175 range and if this support is broken then index may tank near 13025 – 13000 range.
Tata steel cup Handle breakoutTata steel cup and handle breakout and the price is near resistance also with support coming close to the resistance suggesting possible breakout.
Buy around - 160
Target - 180 (13%)
Duration - 1 month
Tata steel have good fundamentals and showing breakout possibility
