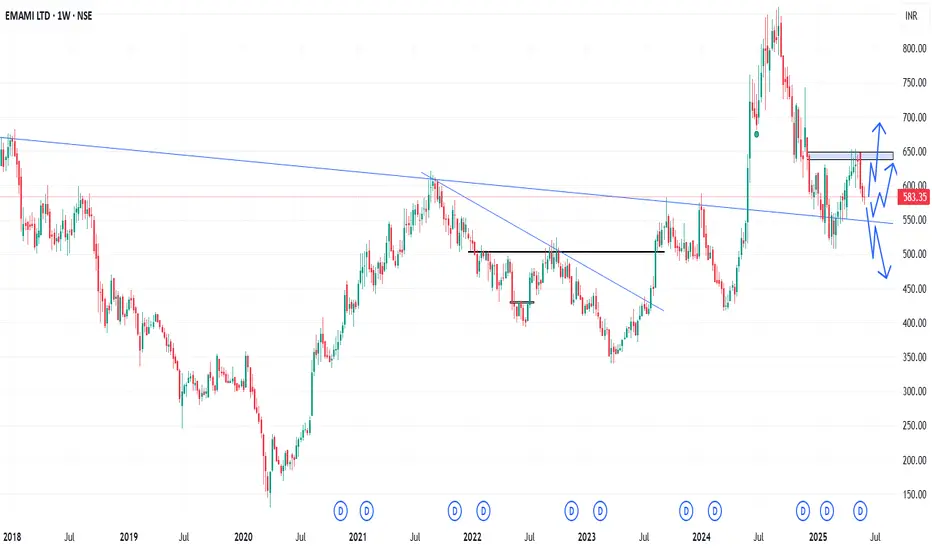
EMAMILTD - Weekly AnalysisIn the Weekly Chart of EMAMILTD ,
we can see that, it is at decision making point.
Expected momentums are shown in chart.
Trend Lines
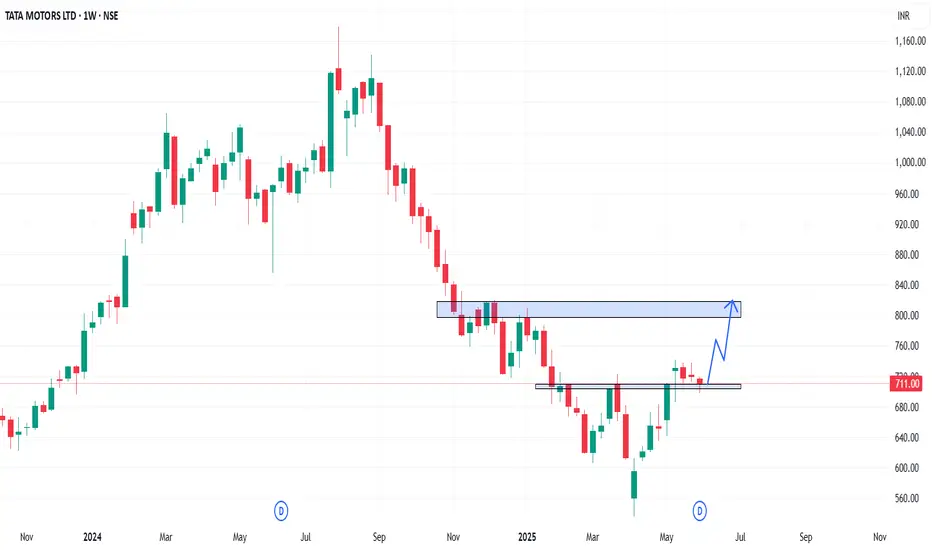
TATAMOTORS - Weekly AnalysisIn the Weekly Chart of TATAMOTORS ,
we can see that, it has retested properly and now its ready for up move.
Expected momentum is shown in chart.
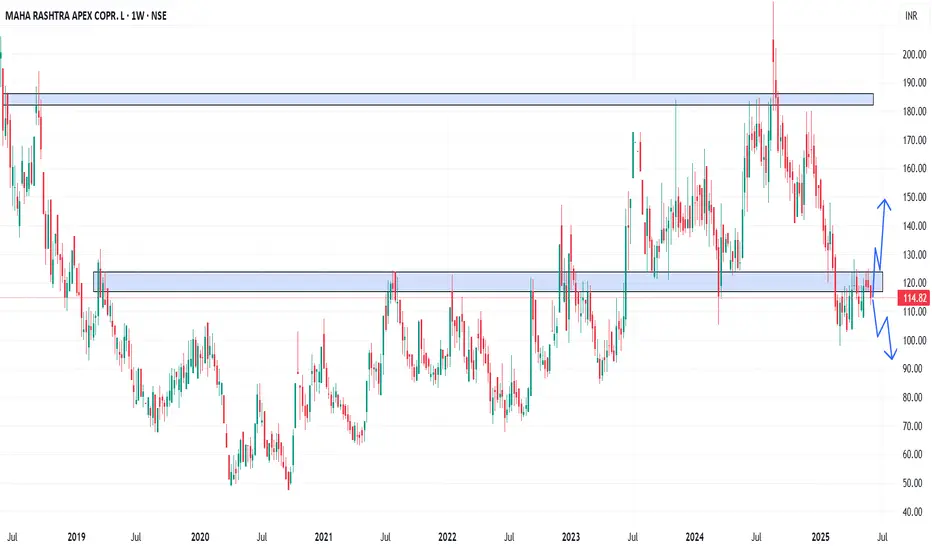
MAHAPEXLTD - Weekly AnalysisIn the Weekly Chart of MAHAPEXLTD ,
we can see that, it is at decision making point.
Expected momentums are shown in chart.
CROMPTON - Weekly AnalysisIn the Weekly Chart of CROMPTON,
we can see that, Bullish momentum is started.
It has taken a bounce back from 300-320.
Also, it is leading towards Big Cup & Handle breakout.
Expected momentum is shown in chart.

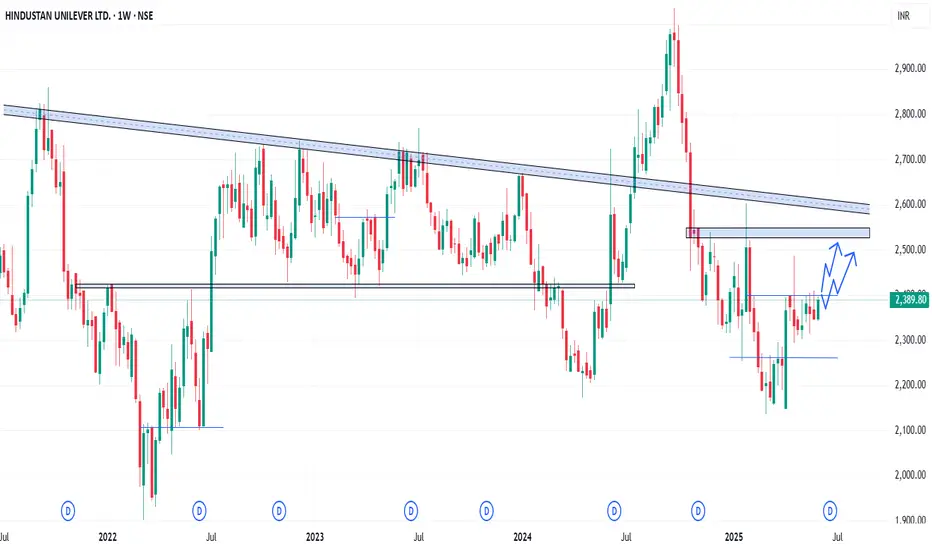
HINDUNILVR - Weekly AnalysisIn the Weekly Chart of HINDUNILVR ,
we can see that, it can give a Cup & Handle breakout at 2400 level.
Expected momentum is shown in chart.
HPAL - Weekly AnalysisIn the Weekly Chart of HPAL ,
we can see that; selling is very slow and it is loading towards Cup & Handle breakout.
Expected momentum is shown in chart.

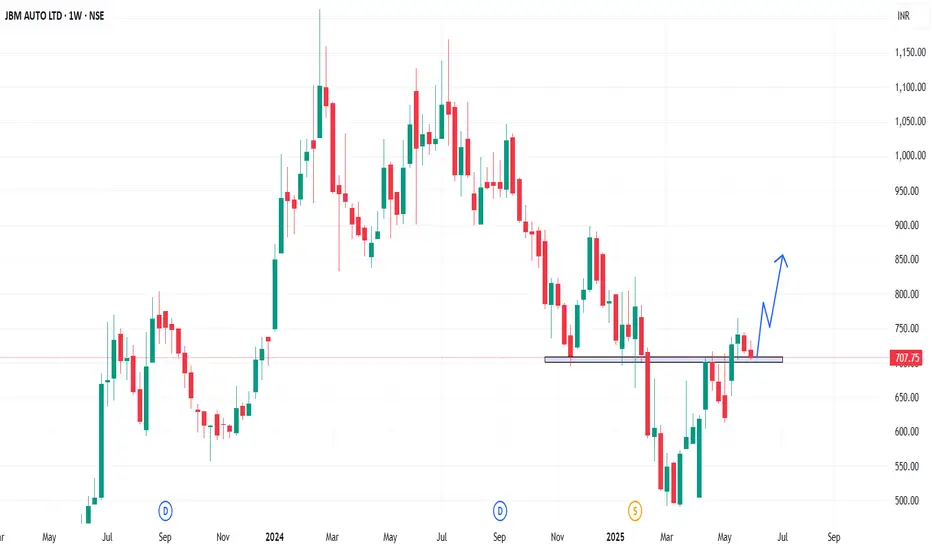
JBMA - Weekly AnalysisIn the Weekly Chart of JBMA ,
we can see that; it has retested properly and ready to up move.
Expected momentum is shown in chart.
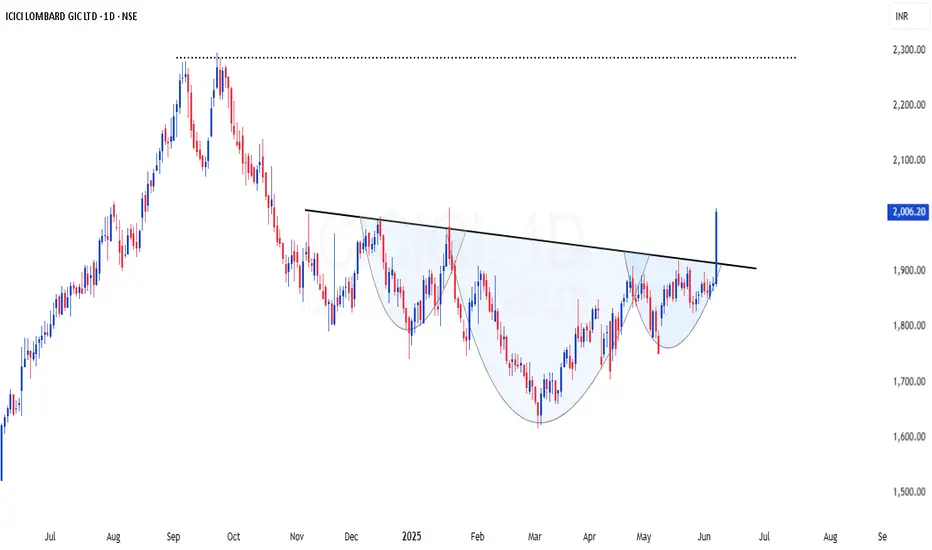
ICICIGI | High probable INHS setup - Looks good for 20-40%ICICIGI | High probable INHS setup - Looks good for 20-40%
CMP : 2006 (Dip : 1930)
SL : 1800
The stock has confirmed a classic inverted Head & Shoulders pattern on the daily chart, signaling a strong trend reversal.
✅ Breakout above neckline with decent volume, adding conviction to the move.
🎯 Immediate Target: 2300
🎯 Second Target (as per Fibonacci extension): 2700
📉 Pattern: Inverted H&S
📈 Volume: Supporting the breakout
📊 Bias: Bullish
This could be an excellent area of value for swing traders looking to ride the trend. A retest of the neckline could offer a second entry opportunity with a good risk-reward ratio.
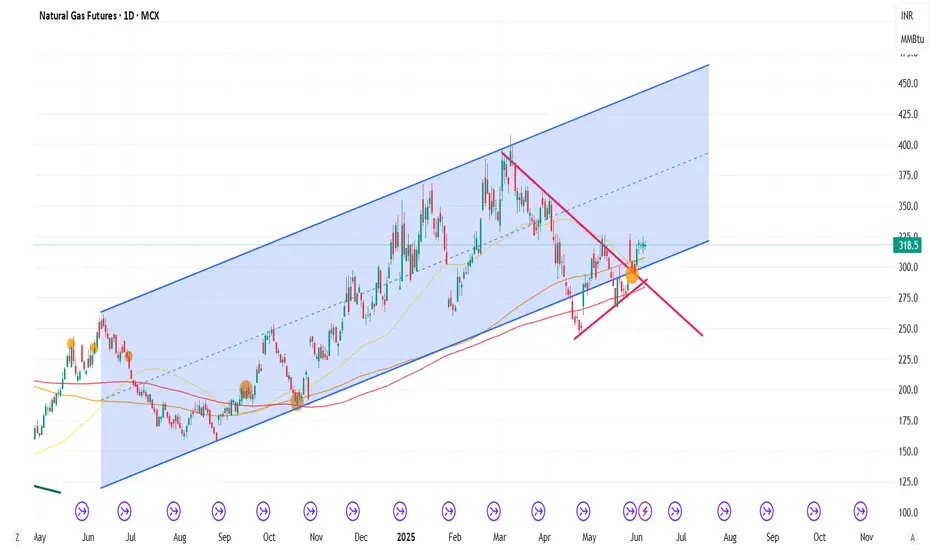
Natural GasThis is for educational purposes only. Natural gas has broken its trendline and is consolidating within a narrow range, indicating a high probability of an upward move. Trade with a stop loss.
KEC Price ActionKEC International’s share price as of June 6, 2025, is around ₹889.25, reflecting a 2.16% increase from the previous close. Over the past month, the stock has surged by 28.8%, and it is up 6.83% in the last week, showing strong short-term momentum. However, over the last six months, the stock is down by 26.85%, indicating significant volatility in the medium term .
The company is currently trading at a price-to-earnings (P/E) ratio of 40.6 and a price-to-book (P/B) ratio of 4.33, both of which are considered high compared to the sector average P/E of 28.9. This suggests that the stock is priced at a premium relative to its peers . The dividend yield stands at 0.63% .
KEC International recently secured new orders worth ₹2,211 crore across various segments, including Transmission & Distribution, Oil & Gas Pipelines, and Cables. This has contributed to a 40% year-to-date growth in orders and strengthened its international order book. As a result, analysts maintain a ‘Buy’ rating, with target prices ranging from ₹911 to ₹998, and some suggesting a potential 10% upside from current levels .
Financially, the company’s trailing twelve-month earnings per share (EPS) has grown by 58.95% year-on-year, and the company has a market capitalization of about ₹23,295 crore . The stock hit its 52-week high at ₹1,313.25 and its 52-week low at ₹627.45, highlighting its volatility over the past year .
In summary, KEC International is showing positive short-term momentum, backed by strong order inflows and optimistic analyst ratings. However, its high valuation multiples and recent volatility suggest that investors should approach with some caution, balancing growth prospects against the premium pricing and market fluctuations .

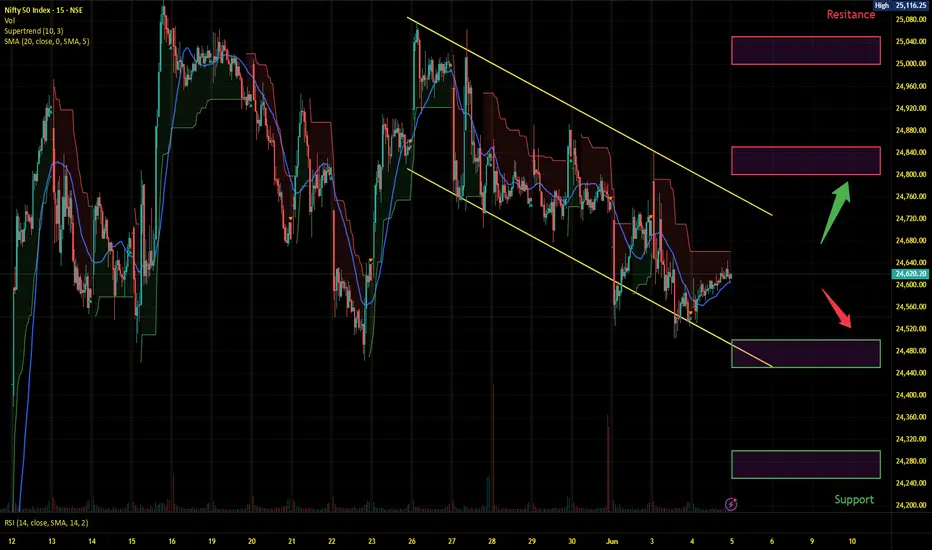
Nifty Intraday Analysis for 06th June 2025NSE:NIFTY
Volatility expected on RBI June’25 MPC Meeting outcome.
Index has resistance near 24900 - 24950 range and if index crosses and sustains above this level then may reach near 25200 – 25250 range.
Nifty has immediate support near 24575 – 24525 range and if this support is broken then index may tank near 24350 – 24300 range.

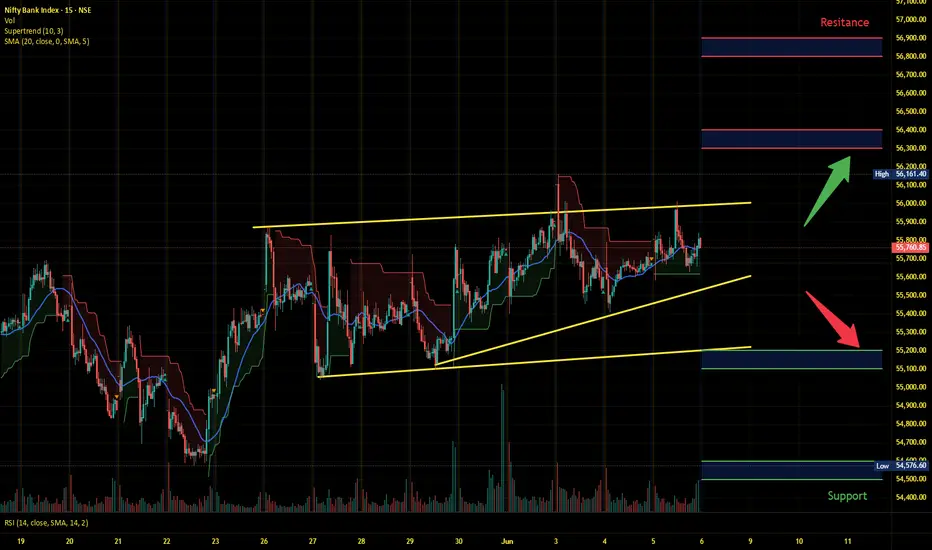
Banknifty Intraday Analysis for 06th June 2025NSE:BANKNIFTY
Volatility expected on RBI June’25 MPC Meeting outcome.
Index has resistance near 56300 – 56400 range and if index crosses and sustains above this level then may reach near 56800 – 56900 range.
Banknifty has immediate support near 55200 - 55100 range and if this support is broken then index may tank near 54600 - 54500 range.
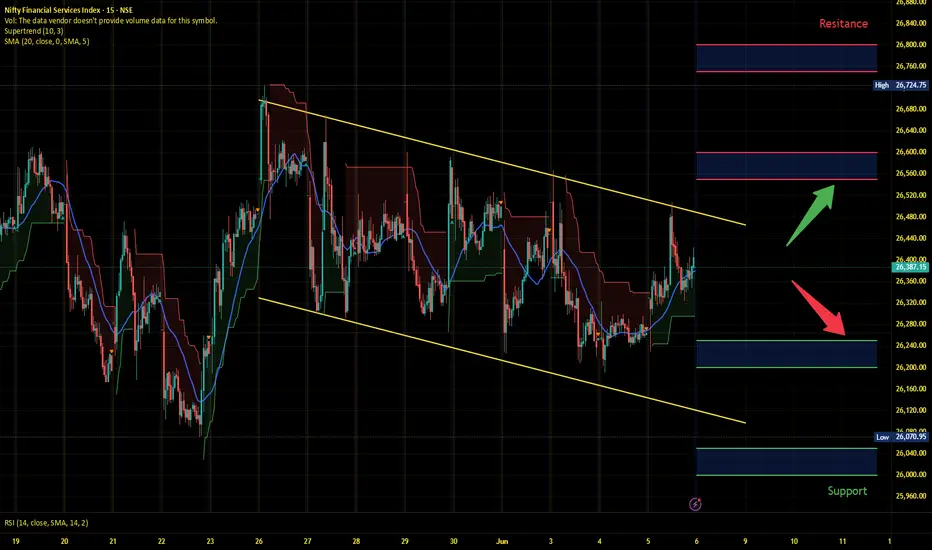
Finnifty Intraday Analysis for 06th June 2025NSE:CNXFINANCE
Volatility expected on RBI June’25 MPC Meeting outcome.
Index has resistance near 26550 - 26600 range and if index crosses and sustains above this level then may reach near 26750 - 26800 range.
Finnifty has immediate support near 26250 – 26200 range and if this support is broken then index may tank near 26050 – 26000 range.
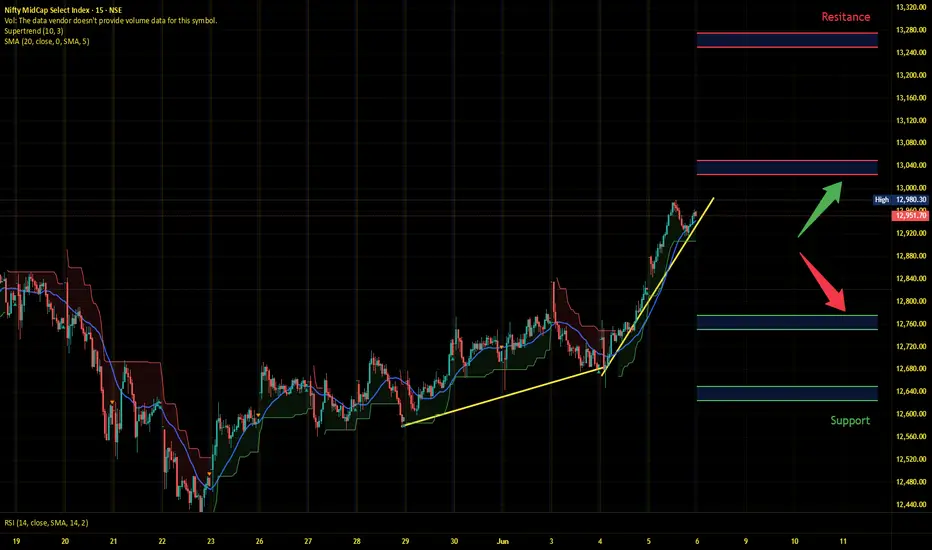
Midnifty Intraday Analysis for 06th June 2025NSE:NIFTY_MID_SELECT
Volatility expected on RBI June’25 MPC Meeting outcome.
Index has immediate resistance near 13025 – 13050 range and if index crosses and sustains above this level then may reach 13250 – 13275 range.
Midnifty has immediate support near 12775 – 12750 range and if this support is broken then index may tank near 12650 – 12625 range.
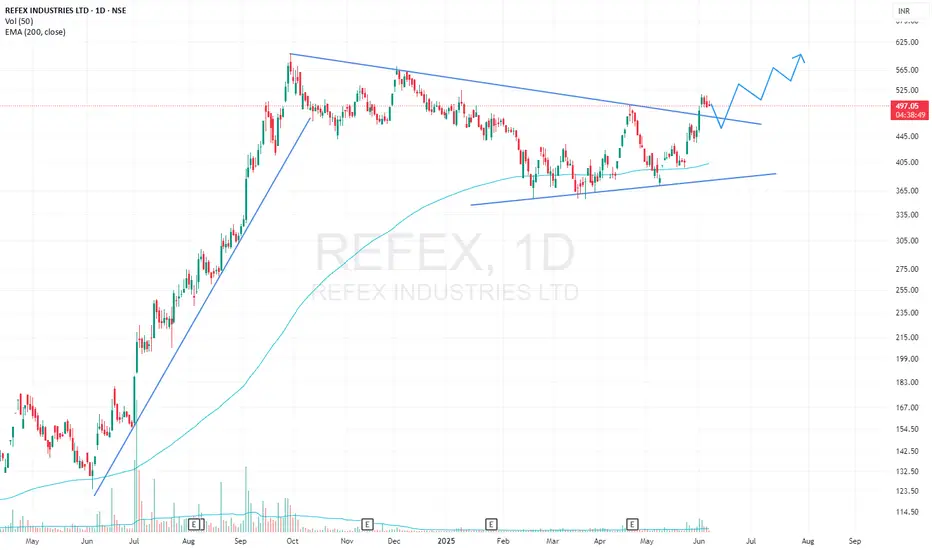
REFEX Triangle & Bull Flag BreakoutREFEX has given a breakout from Symmetrical Triangle and Bull Flag pattern on 1D timeframe with high volumes. Stock has also bounced several times from 200 EMA. Long Position can be initiated with proper risk management.
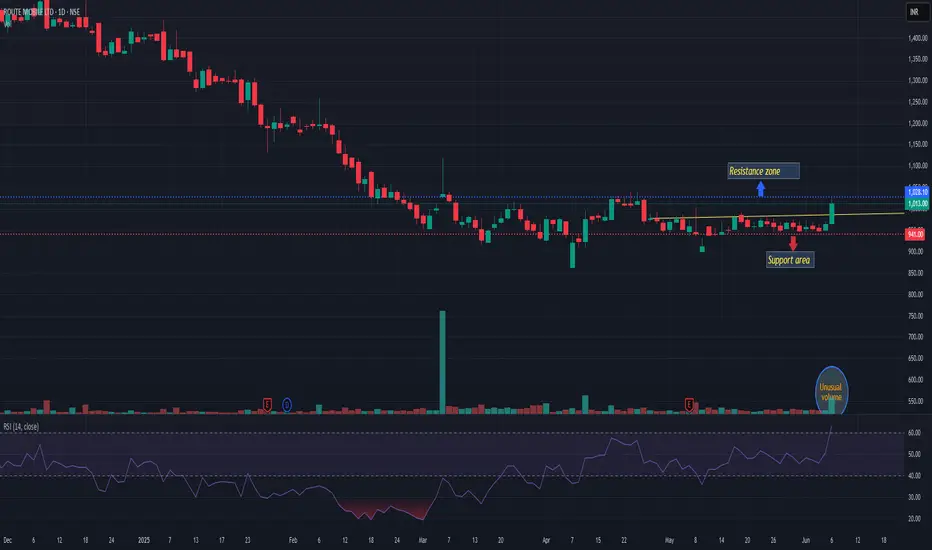
ROUTEROUTE is giving hint of reversal with unusual volume. And in mu opinion reversal will be confirmed only if it closes above 1030. If it confirmed then 15-17% from here may be possible. And if it closes below 930 may change my view. Today it is attempting to close above short term key moving averages. Keep a closer watch
HERCULES HOISTS technical analysisHercules Hoisting Ltd. (NSE: HERCULES HOI. LTD.) is currently trading at INR 309.20. The company operates in the material handling and industrial equipment sector, providing hoisting solutions for infrastructure, manufacturing, and logistics industries. This company is part of Bajaj Group.
Key Levels
Support Levels: INR 77.36, INR 127.30, INR 169.29, INR 196.37
Swing Level: INR 309.20
Possible Upside Levels: INR 359.15, INR 422.75, INR 487.60
Technical Indicators
RSI: The Relative Strength Index (RSI) is currently at 59.97, indicating strong momentum but remaining below the overbought threshold, suggesting further upside potential if buying interest persists.
Volume: Trading volume has been consistent, reflecting steady investor participation. A spike in volume near resistance levels could confirm bullish movements.
Sector and Market Context
Hercules Hoisting Ltd. operates within the industrial equipment and logistics automation sector, which has seen rising demand due to increased manufacturing activity, automation in warehousing, and infrastructure growth. The industry benefits from government-led industrial expansion and private sector investments, though it faces challenges such as raw material price fluctuations, regulatory compliance, and competitive pressures from global players. Broader market conditions suggest positive sentiment in capital goods stocks, making industrial and equipment-related companies appealing to long-term investors.
Latest News and Developments
Market Trends: Increased adoption of automated material handling solutions, boosting prospects for hoisting and lifting equipment manufacturers.
Analyst Ratings: Analysts have projected stable revenue growth, citing expansions in industrial automation demand.
Quarterly Results: The company reported moderate earnings growth, supported by steady infrastructure investment inflows.
Dividend Update: Hercules Hoisting Ltd. has declared a dividend payout of ₹3 per share, reflecting stable cash flow management and shareholder commitment.
Analysis Summary
Hercules Hoisting Ltd. presents a bullish technical setup, with RSI and volume trends indicating strong investor engagement. Sector fundamentals remain positive, supported by automation-driven industrial growth and infrastructure expansion. Investors should monitor price movements near key resistance levels, macroeconomic indicators, and industrial investment trends before making strategic decisions. A balanced approach is advised, factoring in market cyclicality and sector-specific risks.

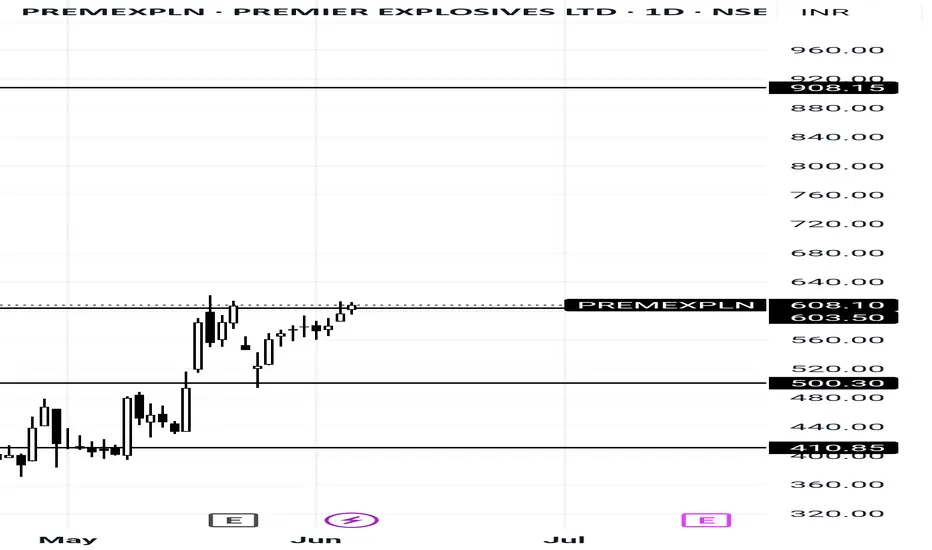
Premier Explosives Limited is ready to explodeI'm seeing some interesting price action. The stock seems to have made a strong move and then come back to retest what appears to be a key level around ₹608.
From my perspective, if PREMEXPLN can hold above this ₹608 mark, I'm anticipating a potential move higher. My current target for this setup is around the ₹900 level, which aligns with a significant point on the chart.
This is simply my interpretation of the technicals, and I'll be watching how price develops from here. As with any trading idea, proper risk management is essential.
Just sharing my chart observation – not financial advice.
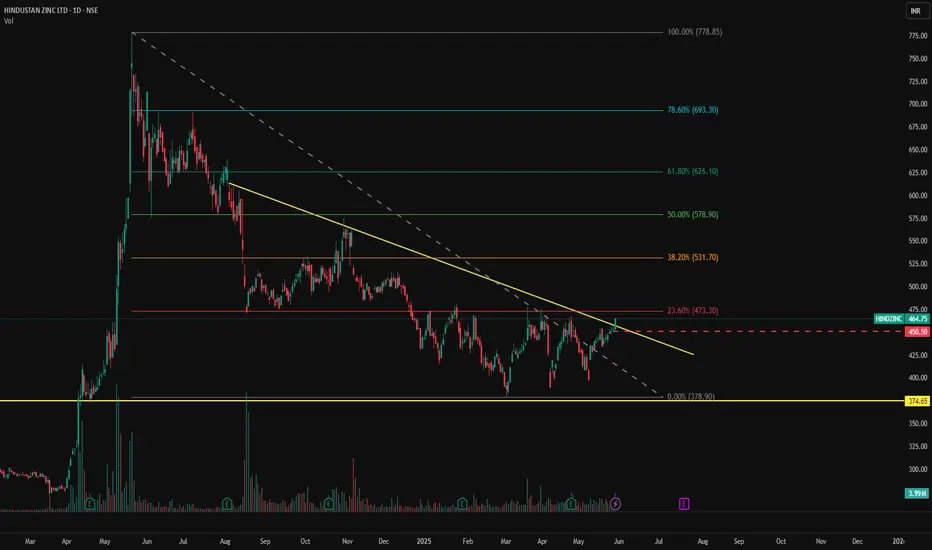
HINDZINC - NSE | Daily Chart Analysis📊 HINDUSTAN ZINC LTD (HINDZINC) – NSE | Daily Chart Analysis
📅 Date: May 30, 2025
📈 CMP: ₹464.75 (+2.68%)
📌 Ticker: NSE:HINDZINC
🧠 Technical Breakdown
🟢 Descending Trendline Breakout 🟢
The stock is showing early signs of strength as it approaches the apex of a long-term descending trendline. Price action is attempting a trendline breakout from a nearly year-long downtrend, suggesting the possibility of a bullish reversal.
🔍 Volume Confirmation
Steady volume buildup over the past few sessions, potentially indicating accumulation ahead of a confirmed breakout.
📉 Well-Defined Support
₹374.65 has acted as a strong demand zone on multiple occasions, offering a solid base for the current move.
📍 Key Price Levels
🔺 Resistance (Trendline Breakout Zone): ₹465
🔻 Major Support: ₹374.65
🎯 Upside Targets (on breakout):
₹500
₹535
₹575+
🛡️ Stop Loss: Below ₹440 (on breakout failure)
📌 Trading Strategy
Aggressive Entry: On breakout + closing above ₹465 with volume surge
Conservative Entry: Retest of trendline post-breakout
SL: ₹440
Target Zone: ₹500–₹575
⚠️ Disclaimer
This post is for educational purposes only and does not constitute financial advice. Always conduct your own analysis or consult a financial advisor before investing.
Well anticipated move!As we can see despite the bearishness, NIFTY showed immense strength as expected and analysed in our previous posts. We had been adamant to our levels and hence every dip was our buying opportunity and also told u guys to make fresh entries for better risk to reward. Now we will stick to our analysis and will keep on buying the dip unless 24400 is broken and sustained below for ATH target.

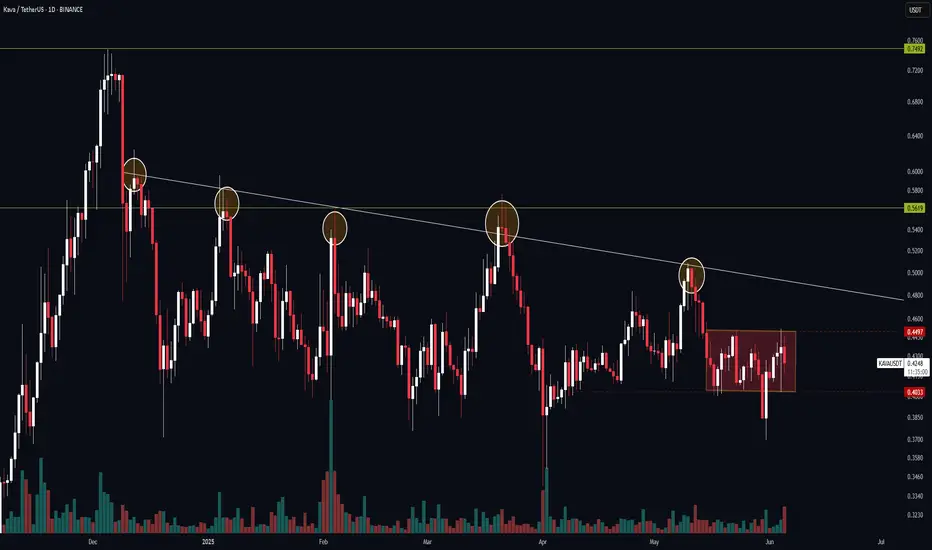
KAVA Ready for Breakout? Watch 0.45 Key Level
📊 Cycle Analysis
🔁 HWC: Ranging
🔁 MWC: Ranging
🔁 LWC: Ranging
The price is currently moving inside a 4H range box. Personally, I avoid trading inside ranges like this due to the high probability of fakeouts and choppy movement.
🧭 My Strategy:
✅ A break above 0.45 (range resistance) could be a solid long trigger, signaling a potential breakout from this consolidation zone.
📈 After entering, I’ll let the price move toward the upper descending trendline, which has seen multiple touches. This increases the odds of a breakout, or at least a strong reaction.
⚠️ If the reaction to the trendline is weak (e.g., no strong rejection candle, low volume), I’ll keep my position open, as the market may break out and offer better R multiples.
🚫 About Short Positions:
Technically, you could short a breakdown from the range, but I won’t be taking any short setups here. I’m focused purely on the long side for now.
📝 Summary:
❌ No trades inside the range box
✅ Long entry on 0.45 resistance break
🎯 Targeting the upper trendline
🧠 If the trendline gives a weak rejection → keep the trade open
🚫 Ignoring short opportunities
📌 Got a coin in mind? Drop it in the comments and I’ll analyze it for you.
⚠️ Without proper risk management, you're just a ticking time bomb.
IRCON TRENDLINE BREAKOUTIRCON breaking trendline resistance weekly
huge volume for this week
bullish RSI,trading above all key ema
railway stock looking good🚀
#resistance r marked in chart
NO BUY/SELL RECOMENDATION

Nifty Intraday Analysis for 05th June 2025NSE:NIFTY
Index has resistance near 24800 - 24850 range and if index crosses and sustains above this level then may reach near 25000 – 25050 range.
Nifty has immediate support near 24500 – 24450 range and if this support is broken then index may tank near 24300 – 24250 range.