Introduction: India’s Infrastructure Revolution and Market Impac1. The Infrastructure Revolution: A Historical Turning Point
Infrastructure has always been the backbone of economic growth. However, India’s earlier attempts at large-scale infrastructure expansion often suffered from policy bottlenecks, inadequate funding, and execution delays. The recent decade marks a fundamental shift — from fragmented planning to integrated development.
Under initiatives like the National Infrastructure Pipeline (NIP), PM Gati Shakti, and Smart Cities Mission, India is modernizing its roads, railways, ports, and energy networks with unprecedented scale and coordination. The NIP alone envisions an investment of over ₹111 lakh crore across sectors such as energy, transport, water, and social infrastructure by 2025.
This surge is not limited to government spending. Public-Private Partnerships (PPPs), sovereign wealth funds, and global investors are increasingly financing infrastructure projects, drawn by India’s growth potential and improving regulatory frameworks.
2. Policy Push: The Catalyst for Change
The infrastructure revolution owes much to strategic policy direction. The government has implemented structural reforms aimed at accelerating project execution, reducing red tape, and ensuring transparency in tendering and funding.
Some of the most influential initiatives include:
PM Gati Shakti National Master Plan (2021): A digital platform that integrates 16 ministries to ensure coordinated planning and implementation of infrastructure projects.
Bharatmala and Sagarmala Projects: Focused on improving road and port connectivity to enhance logistics efficiency.
Dedicated Freight Corridors (DFCs): Designed to ease congestion on railway lines and boost freight movement.
Smart Cities and AMRUT: Targeted towards urban transformation through improved utilities, mobility, and housing.
National Monetization Pipeline (NMP): Monetizing existing assets to fund new projects, reducing fiscal burden while attracting private capital.
Together, these programs mark a shift from infrastructure “creation” to infrastructure “optimization,” ensuring long-term economic dividends.
3. Economic Impact: A Multiplier for Growth
The infrastructure push has a ripple effect across the economy. Each rupee invested in infrastructure generates a multiplier impact of approximately 2.5 to 3 times on GDP.
Here’s how:
Employment Generation: Large-scale projects create millions of direct and indirect jobs, particularly in construction, manufacturing, and logistics sectors.
Improved Productivity: Efficient logistics and transport reduce travel time, lower costs, and boost competitiveness for businesses.
Urbanization and Real Estate Growth: Enhanced connectivity fuels urban expansion, leading to increased demand for housing, retail, and industrial spaces.
Investment Magnet: Stable infrastructure attracts foreign direct investment (FDI), especially in sectors like manufacturing, renewable energy, and technology parks.
Regional Development: Projects in tier-2 and tier-3 cities are reducing regional disparities, promoting balanced growth.
According to estimates, infrastructure could contribute nearly 10% to India’s GDP by 2030, transforming the nation into a global manufacturing and logistics hub.
4. Stock Market Impact: The Infrastructure Theme Takes Center Stage
India’s stock markets have responded positively to this infrastructure wave. Investors see this as a multi-decade opportunity across several interconnected sectors.
a. Core Infrastructure Stocks
Companies in construction, engineering, and heavy machinery — such as Larsen & Toubro, IRB Infrastructure, KNR Construction, and NBCC — are witnessing strong order inflows and improved margins.
b. Cement and Steel
Demand for building materials is soaring. Cement majors like UltraTech, ACC, and Dalmia Bharat, and steel producers like Tata Steel and JSW Steel, have benefited from the government’s spending spree.
c. Capital Goods and Equipment
Firms like Siemens, ABB India, and Cummins are riding the wave of infrastructure electrification, metro projects, and industrial automation.
d. Logistics and Transport
The development of multi-modal transport networks boosts companies in logistics and warehousing, such as Container Corporation of India, TCI Express, and Adani Ports.
e. Ancillary Sectors
Power, renewable energy, and urban development firms are integral beneficiaries of the infrastructure ecosystem. For instance, NTPC, Power Grid Corporation, and Adani Energy Solutions are vital to India’s grid modernization.
Thus, the infrastructure theme has become one of the strongest investment narratives in India’s equity market, attracting both domestic and foreign institutional investors.
5. Financing the Boom: Innovative Funding Models
Financing India’s infrastructure ambitions requires creativity beyond traditional budget allocations. To address this, the government and private sector are leveraging multiple instruments:
Infrastructure Investment Trusts (InvITs) and Real Estate Investment Trusts (REITs) are unlocking liquidity by monetizing assets like roads, power transmission lines, and commercial real estate.
Green Bonds and Masala Bonds are mobilizing international capital for sustainable projects.
Sovereign Wealth Funds and Pension Funds from countries like Canada, Singapore, and the UAE are increasingly investing in long-term Indian infrastructure assets.
Development Finance Institutions (DFIs), such as the National Bank for Financing Infrastructure and Development (NaBFID), provide specialized financing for large-scale projects.
This diversification of funding sources ensures that India’s infrastructure revolution is both financially sustainable and globally integrated.
6. Challenges on the Road Ahead
Despite remarkable progress, several challenges persist:
Execution Delays: Land acquisition, environmental clearances, and litigation can slow project timelines.
Cost Overruns: Inflation in construction materials and logistical inefficiencies can erode profitability.
Private Participation Risks: Uncertain returns and policy changes can deter private investment.
Skill Shortage: The sector still faces a lack of skilled labor, especially in high-tech construction and project management.
Environmental Concerns: Balancing rapid development with ecological sustainability remains a critical challenge.
Addressing these issues will require continued policy refinement, institutional strengthening, and technological innovation.
7. Future Outlook: India’s Infrastructure Decade
Looking ahead, the 2020s are likely to be remembered as India’s “Infrastructure Decade.” The focus is now expanding beyond traditional construction to include digital infrastructure, green mobility, renewable energy, and sustainable cities.
Digital India and 5G rollout will connect even the remotest regions, enabling inclusive growth.
Renewable energy projects, targeting 500 GW by 2030, will redefine India’s energy landscape.
High-speed rail networks and metro expansion will modernize urban transport.
Smart logistics parks and industrial corridors will make India a global manufacturing powerhouse.
With urbanization accelerating and global investors viewing India as a growth engine, infrastructure will continue to be the foundation of the nation’s economic narrative.
Conclusion: The Market’s Golden Era of Infrastructure
India’s infrastructure revolution is more than a construction story — it’s a transformation of the nation’s economic DNA. It intertwines policy reform, financial innovation, and market opportunity. As roads, railways, ports, and data highways connect the nation, they are also connecting investors to one of the most promising growth stories in the world.
The infrastructure-led growth model not only drives GDP expansion but also deepens India’s capital markets, generates employment, and enhances global competitiveness. For investors and policymakers alike, India’s infrastructure revolution represents both an opportunity and a responsibility — to build a future that is strong, sustainable, and inclusive.
In essence, this is not merely an infrastructure boom; it’s the building of “New India” — brick by brick, byte by byte, and vision by vision.
Trendlineanalysis
AI-Driven Economies: Boon or Inflation Trap?1. The Economic Boon of AI
a. Productivity Revolution
One of AI’s most powerful contributions lies in its ability to enhance productivity. Unlike previous technological shifts that replaced physical labor, AI enhances cognitive productivity. Algorithms can analyze massive datasets, make real-time decisions, and optimize operations that humans could never process at similar speed or accuracy.
For instance, AI-driven automation in manufacturing reduces downtime, minimizes errors, and lowers production costs. In the service sector, AI chatbots and recommendation engines improve customer experiences while cutting operational costs. As a result, output per worker increases — a key driver of GDP growth.
b. Innovation and New Industry Creation
AI is not just optimizing existing industries but creating entirely new ones. The rise of autonomous vehicles, robotics, healthcare analytics, and smart agriculture represents multibillion-dollar markets built around AI innovation. These new sectors attract massive investment, stimulate entrepreneurship, and create high-value jobs in data science, engineering, and software development.
The global AI market, projected to surpass $2 trillion by 2030, has become a cornerstone of modern industrial policy. Nations investing early in AI infrastructure, like the U.S., China, and India, are positioning themselves as leaders in the next phase of the digital economy.
c. Efficiency in Resource Allocation
AI systems enable more efficient use of resources — energy, raw materials, and capital. In agriculture, AI optimizes irrigation and fertilizer use; in finance, it reduces bad loans through predictive risk models; and in logistics, it minimizes fuel consumption by optimizing routes. These efficiencies reduce costs and environmental impact simultaneously — a win-win scenario for businesses and governments alike.
d. Deflationary Forces in the Short Term
Interestingly, AI can initially act as a deflationary force. As automation increases, the cost of goods and services tends to drop because of higher productivity and lower labor costs. For example, AI-driven manufacturing allows companies to produce more at lower costs, passing savings on to consumers. This short-term price stability often supports economic expansion and higher consumer spending.
2. The Inflation Trap: Hidden Risks of AI-Driven Economies
While the short-term gains from AI appear promising, long-term structural challenges could create inflationary pressures and social imbalances.
a. Unequal Distribution of Wealth
AI-driven productivity gains do not always benefit everyone equally. Large corporations that own AI technologies and data infrastructure accumulate significant economic power, while smaller firms and low-skilled workers struggle to keep up. This wealth concentration leads to income inequality, which indirectly fuels inflationary cycles.
When profits are concentrated in a few hands, consumer demand may become skewed — luxury goods prices rise, while basic goods and wages stagnate. As the middle class shrinks, governments may increase fiscal spending and social programs to stabilize consumption, adding inflationary pressure to the system.
b. Wage Polarization and Cost-Push Inflation
AI often automates repetitive, low-skill jobs while creating demand for high-skill technical roles. This “job polarization” leads to wage growth at the top and stagnation at the bottom. Over time, this could produce cost-push inflation, especially in sectors like healthcare, education, and housing — where human labor remains essential and costs cannot easily be automated.
Moreover, displaced workers may require retraining or government support, which increases fiscal spending. This government-driven stimulus, though necessary, can also be inflationary if not managed carefully.
c. Overreliance on Technology and Supply Constraints
AI systems depend on complex supply chains — semiconductors, rare earth elements, and high computing infrastructure. If supply disruptions occur (like during the 2020–2022 global chip shortage), the cost of AI deployment could spike dramatically. Such shortages can trigger supply-side inflation, as companies raise prices to offset rising input costs.
d. Productivity Paradox and the Lag Effect
Historically, major technological innovations take years to translate into widespread productivity gains. While AI promises long-term efficiency, short-term disruptions — such as job losses, retraining costs, and restructuring — can slow growth. If governments and central banks anticipate faster gains than reality delivers, they may overstimulate the economy through loose monetary or fiscal policy, unintentionally fueling inflation.
e. Data Monopoly and Market Power
Another inflationary risk comes from AI-driven monopolies. As large tech firms dominate AI data and computing ecosystems, competition declines. With fewer players controlling markets, they gain pricing power. For instance, if a handful of companies control AI chips or cloud computing, they can increase prices with little resistance — embedding inflation within critical digital infrastructure.
3. The Policy Balancing Act
The challenge for policymakers is to harness AI’s growth potential without allowing it to destabilize inflation and inequality.
a. Investing in Human Capital
Education and reskilling programs are essential to help workers adapt to AI-driven changes. By closing the skill gap, governments can prevent mass unemployment and wage stagnation — two key sources of inflationary pressure. Encouraging AI literacy at all education levels ensures that the workforce evolves alongside technology.
b. Strengthening Competition and Regulation
To prevent monopolistic practices, policymakers must enforce antitrust laws and promote open data ecosystems. Encouraging small and medium enterprises (SMEs) to adopt AI through subsidies or shared platforms can democratize productivity gains, spreading benefits more evenly across the economy.
c. Smart Monetary Policy
Central banks face a unique challenge: distinguishing between AI-driven deflation (from productivity) and AI-driven inflation (from inequality or bottlenecks). Adaptive monetary policies — including real-time data analysis powered by AI itself — could help maintain balance.
d. Sustainable AI Infrastructure
AI consumes significant energy and computing resources. Building green, efficient data centers and investing in renewable energy reduces the risk of cost-driven inflation tied to energy usage.
4. The Long-Term Outlook
If managed wisely, AI could usher in a new era of sustainable, inclusive growth. Imagine economies where AI predicts demand accurately, minimizes waste, and boosts productivity across industries — from healthcare diagnostics to energy optimization. However, without careful regulation and equitable access, AI could deepen divides, distort price structures, and trap economies in persistent inflation.
The real test will be governance — how nations balance innovation with fairness. Economies that combine AI adoption with strong education systems, ethical regulation, and transparent competition policies will likely emerge as winners. Those that allow monopolies, inequality, and resource inefficiencies to spread may find themselves facing an inflationary storm masked as progress.
Conclusion
AI-driven economies are neither pure blessings nor inherent traps — they are complex ecosystems shaped by human choices. Artificial Intelligence can unlock enormous wealth and efficiency, but it can also magnify inflationary risks if benefits are unevenly distributed or poorly regulated.
The future of AI in economics depends not only on technological progress but on policy foresight. Governments, corporations, and societies must collaborate to ensure that AI serves as a tool for inclusive growth rather than a catalyst for inflationary instability. The question, therefore, is not whether AI will reshape economies — it already is — but whether we can guide its power wisely enough to ensure prosperity without falling into the inflation trap.

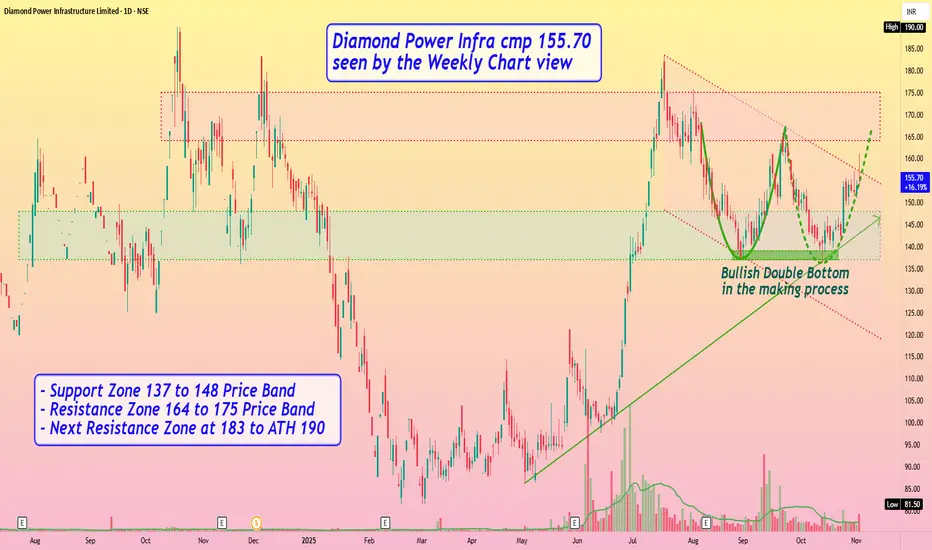
Diamond Power Infra cmp 155.70 seen by the Weekly Chart viewDiamond Power Infra cmp 155.70 seen by the Weekly Chart view
- Support Zone 137 to 148 Price Band
- Resistance Zone 164 to 175 Price Band
- Next Resistance Zone at 183 to ATH 190
- Bullish Double Bottom in the making process
- Rising Support Trendline seems well respected
- Volumes spiking regularly by close sync with avg traded qty
- Falling Price Channel Breakout seems to be in the making process
Option Trading: Basic UnderstandingHow Options Work
Each option represents a contract between a buyer and a seller. The buyer pays a premium to the seller (also called the writer) in exchange for certain rights:
The call option buyer has the right to buy the asset at the strike price.
The put option buyer has the right to sell the asset at the strike price.
If the market moves in favor of the buyer, they can exercise the option to make a profit. If the market moves against them, they can simply let the option expire, losing only the premium paid.
Example:
Suppose a trader buys a call option on ABC Ltd. with a strike price of ₹100, expiring in one month, for a premium of ₹5.
If ABC’s price rises to ₹120, the trader can buy the stock at ₹100 and sell it at ₹120, making ₹20 profit minus the ₹5 premium = ₹15 net profit.
If ABC’s price stays below ₹100, the trader will let the option expire and lose only the ₹5 premium.
This limited loss and unlimited profit potential make call options attractive for bullish traders.

The Power of Divergence in TradingParticipants in the Options Market
There are four main types of market participants, each with different motivations:
Buyers of Call Options: Expect the asset price to rise.
Sellers (Writers) of Call Options: Expect the asset price to remain stable or fall.
Buyers of Put Options: Expect the asset price to decline.
Sellers (Writers) of Put Options: Expect the asset price to remain stable or rise.
Each side of the trade involves a buyer and a seller, and each carries distinct risks and rewards.

Part 2 Master Candle Stick Pattern Option Trading Styles
There are two primary styles of options:
American Options: Can be exercised at any time before the expiration date.
(Common in U.S. markets)
European Options: Can only be exercised on the expiration date.
(Common in index options and global markets)

Part 1 Master Candle Stick Pattern How Options Work
Each option represents a contract between a buyer and a seller. The buyer pays a premium to the seller (also called the writer) in exchange for certain rights:
The call option buyer has the right to buy the asset at the strike price.
The put option buyer has the right to sell the asset at the strike price.
If the market moves in favor of the buyer, they can exercise the option to make a profit. If the market moves against them, they can simply let the option expire, losing only the premium paid.

Positional Trading and Swing Trading in the Indian Market1. What Is Positional Trading?
Positional trading is a strategy where traders hold their positions for several weeks to months, depending on the trend and potential price movement. It’s based on the belief that once a trend starts, it will continue for a considerable period. Traders focus on identifying such long-lasting trends and patiently ride them out, ignoring short-term volatility.
Unlike intraday trading, positional trading doesn’t require constant monitoring. Traders rely heavily on fundamental analysis and technical indicators to determine the stock’s overall direction. The idea is simple — find fundamentally strong companies or technical setups that show signs of an uptrend or downtrend and hold them until the trend matures.
For example, if a trader notices a breakout on a weekly chart with strong volume and expects the stock to rise due to positive earnings or sectoral growth, they may hold the position for weeks or even months.
2. What Is Swing Trading?
Swing trading, on the other hand, is a short- to medium-term trading strategy aimed at capturing price “swings” that occur within a trend. These swings typically last from a few days to a few weeks. Swing traders don’t aim to catch the entire trend; instead, they seek to profit from smaller, predictable moves within the broader market direction.
In the Indian context, swing traders often focus on stocks with high liquidity, such as those in the Nifty 50 or Bank Nifty, since these provide enough volatility and volume to generate consistent opportunities.
Swing traders rely heavily on technical analysis, using indicators such as moving averages, RSI (Relative Strength Index), MACD, Fibonacci retracements, and candlestick patterns to time their entries and exits.
3. Tools and Analysis Methods
Both strategies depend on technical analysis, but positional traders often combine it with fundamental research, while swing traders primarily depend on price action.
For Positional Traders:
Fundamental Analysis: Checking company earnings, management quality, sectoral growth, and macroeconomic indicators.
Technical Tools: Weekly charts, long-term moving averages (50-day, 200-day), support and resistance zones, and trendlines.
Volume Analysis: Confirmation of trend strength through increased trading volume.
Sentiment Indicators: Market breadth or institutional buying trends.
For Swing Traders:
Technical Indicators: RSI, MACD, Bollinger Bands, Fibonacci retracements, and pivot points.
Candlestick Patterns: Reversals (Hammer, Shooting Star, Engulfing), breakouts, or continuation patterns.
Momentum Indicators: Used to identify short bursts of price action.
News Flow & Events: Earnings announcements, RBI policy, or global cues that can move prices quickly.
4. Risk and Reward Dynamics
Risk management is central to both trading styles, but the approach differs:
Positional Trading Risks:
Since positions are held for weeks or months, traders face overnight risk and gap-up/gap-down openings due to news, results, or global market movements. However, since the focus is on the bigger trend, small fluctuations are ignored. Positional traders often use stop losses based on weekly chart structures and risk smaller capital per trade.
Swing Trading Risks:
Swing traders face short-term volatility and need to manage tight stop losses. Since they target quick gains, even a minor reversal can affect profits. The advantage is limited exposure time — positions are not held too long, reducing prolonged uncertainty.
Reward-wise, positional trades often yield higher returns per trade but take time to materialize, while swing trades produce frequent smaller gains that can compound effectively.
5. Market Conditions for Each Strategy
Market conditions greatly influence which strategy works best:
Positional Trading Works Best In:
Trending markets — either bullish or bearish. Stocks or indices showing clear breakouts or breakdowns after consolidation phases.
Example: During a sectoral bull run (like IT in 2020–21 or PSU banks in 2023), positional traders could hold positions for months and ride the trend.
Swing Trading Works Best In:
Range-bound or moderately volatile markets. When the Nifty oscillates between support and resistance, swing traders capitalize on those moves.
Example: When Nifty trades between 22,000–23,000 for several weeks, swing traders buy near the support zone and sell near resistance.
6. Capital and Margin Requirements
In India, both strategies can be implemented using cash or futures and options (F&O).
Positional Trading: Typically requires more capital because trades are held longer, and margin funding costs can add up. Investors in delivery mode (cash segment) need full capital but have no daily margin calls.
Swing Trading: Requires less capital since traders can use leverage or trade in F&O. However, due to short holding periods, frequent transaction costs and taxes can slightly reduce profits.
7. Emotional and Psychological Factors
Positional Trading Psychology:
Demands patience and discipline. Traders must tolerate price pullbacks and avoid reacting to daily market noise. Emotional stability and conviction in analysis are crucial.
Swing Trading Psychology:
Requires quick decision-making and emotional agility. Traders must be comfortable with fast-paced setups, quick exits, and booking partial profits. Impulsiveness or hesitation can lead to missed opportunities.
8. Examples in the Indian Context
Let’s understand through two practical examples:
Positional Trade Example:
Suppose Tata Motors shows a breakout above ₹950 on a weekly chart after months of consolidation with rising volumes and improving earnings outlook. A positional trader buys and holds, targeting ₹1,200–₹1,300 over 2–3 months while keeping a stop loss at ₹880.
Swing Trade Example:
HDFC Bank rebounds from support near ₹1,450 with bullish candles and RSI divergence. A swing trader buys and holds for 4–6 trading days, aiming for a move to ₹1,520–₹1,550, keeping a tight stop loss at ₹1,435.
9. Which Strategy Is Better for Indian Traders?
There is no universal answer — the better strategy depends on one’s capital base, personality, and time commitment.
Choose Positional Trading if you:
Have a full-time job and cannot monitor markets daily.
Prefer fundamental strength and long-term trend riding.
Can tolerate drawdowns and be patient.
Choose Swing Trading if you:
Can actively watch markets for setups.
Enjoy technical analysis and momentum trading.
Prefer quicker profits and short-term engagement.
Many successful Indian traders blend both — they maintain positional trades in trending sectors and take swing trades for short-term opportunities.
10. Conclusion
Positional and swing trading are two of the most practical and flexible trading styles in the Indian market. While positional trading is about patience, conviction, and trend-following, swing trading emphasizes timing, agility, and momentum capture. Both demand disciplined risk management, a solid understanding of technicals, and awareness of market sentiment.
In essence, positional trading builds wealth gradually, while swing trading builds income through active participation. A balanced trader who understands when to switch between the two — depending on market conditions — can truly harness the best of both worlds in India’s dynamic stock market.

Unlocking Trading Breakouts and Avoiding Costly Mistakes1. What Is a Breakout in Trading?
A breakout occurs when the price of a stock or asset moves outside a key support or resistance level with increased volume.
Resistance Breakout: Price moves above a resistance level (previous high or consolidation zone).
Support Breakout: Price drops below a support level (previous low or base).
This movement suggests that market sentiment is shifting—buyers or sellers are gaining control. A valid breakout often signals a new phase of volatility or the beginning of a strong trend.
For example, if a stock has been trading between ₹100 and ₹120 for weeks, a close above ₹120 on strong volume may signal a bullish breakout—potentially leading to a larger upside move.
2. Why Breakouts Matter
Breakouts often mark major transitions in supply and demand.
When price breaks above resistance, it shows that buyers have overpowered sellers.
When price breaks below support, it means sellers have overwhelmed buyers.
These moments attract large institutional traders and trigger algorithmic buying or selling. Breakout traders attempt to capture the early stage of a trend before the broader market catches on.
However, not every breakout leads to a sustainable move. Many fail quickly—these are known as false breakouts or “bull traps” and “bear traps.” Understanding how to differentiate them is key to success.
3. Characteristics of a Strong Breakout
To filter high-probability breakouts, traders should look for certain confirming signals:
a. High Volume
Volume is the heartbeat of any breakout. When price breaks a key level with high volume, it shows strong participation and conviction among traders. Low-volume breakouts often fail.
b. Tight Consolidation Before Breakout
A tight range or a base pattern (like a flag, pennant, or triangle) before breakout suggests accumulation or preparation for a major move.
c. Strong Close Beyond the Level
The price should close beyond the breakout point—not just spike intraday. Closing strength confirms that the breakout is genuine.
d. Favorable Market Context
Breakouts perform best in trend-supportive markets. A bullish breakout in a strong overall market (e.g., NIFTY 50 uptrend) has a higher chance of succeeding.
4. Common Types of Breakout Patterns
1. Horizontal Breakouts
Price breaks a flat support or resistance level, often after sideways movement or consolidation.
2. Trendline Breakouts
A long-standing trendline is breached, signaling a potential reversal or acceleration of momentum.
3. Chart Pattern Breakouts
Patterns like triangles, flags, rectangles, cups and handles, and head and shoulders often lead to breakouts. Each has its psychology of accumulation and release.
4. Volatility Breakouts
Price suddenly expands after a period of low volatility (e.g., after a squeeze on Bollinger Bands). Such breakouts are explosive but short-lived.
5. The Psychology Behind Breakouts
Understanding trader psychology is as important as chart analysis.
When price nears resistance, many traders expect rejection and place sell orders there. But once the price breaks above that level, short sellers are forced to cover, adding to buying pressure. Similarly, breakout traders jump in, driving price higher—a self-reinforcing cycle that fuels trends.
However, emotions can be dangerous. Many traders fear missing out (FOMO) and chase the price after the breakout has already extended too far. This often leads to losses when price retraces.
6. The Most Common Breakout Mistakes (and How to Avoid Them)
a. Entering Too Early
Jumping in before confirmation is a common trap. Wait for a daily or hourly candle close above resistance (or below support). Premature entries often get caught in false breakouts.
Solution: Be patient. Confirmation matters more than speed.
b. Ignoring Volume
Breakouts without volume often lack strength. Many traders ignore this and assume every move beyond a line is a breakout.
Solution: Use volume indicators (like Volume Profile or OBV) to confirm market participation.
c. No Stop-Loss Strategy
Many traders enter breakouts without pre-defined stop-loss levels, hoping the price will “eventually” go in their favor. This leads to big losses.
Solution: Always place a stop-loss just below the breakout point (for longs) or above it (for shorts). This protects against false breakouts.
d. Chasing Price
After the breakout, price may retest the breakout zone before resuming its trend. Impatient traders chase extended moves, only to see price pull back.
Solution: Wait for a retest or minor pullback before entering.
e. Ignoring Market Context
A breakout in a weak overall market is risky. Broader sentiment influences individual stock movement.
Solution: Align trades with broader trend direction. Bullish breakouts perform better in bull markets.
f. Over-Leveraging
Using high leverage amplifies both profit and loss. If the breakout fails, leveraged traders face margin calls.
Solution: Keep position sizes moderate—risk no more than 1–2% of capital per trade.
7. Smart Techniques to Trade Breakouts Effectively
a. Use Multi-Timeframe Analysis
Check higher timeframes (like weekly or daily) to confirm structure, and use lower ones (like 1-hour) for entries. This ensures alignment between short-term and long-term trends.
b. Employ Volume Profile
Volume Profile helps identify high-volume nodes (HVNs)—zones of strong support/resistance—and low-volume nodes (LVNs)—areas where breakouts are likely to accelerate.
c. Watch for Retests
Many valid breakouts come back to retest the broken level before continuing. This offers low-risk entry points.
d. Combine Momentum Indicators
Use RSI, MACD, or ADX to confirm momentum. If these show strength during breakout, chances of success rise.
e. Manage Emotions
Don’t let excitement or fear dictate action. Follow your trading plan strictly—discipline beats prediction.
8. Risk Management in Breakout Trading
Breakout trading works best with strict risk management because not all breakouts succeed.
Here’s how to manage risk effectively:
Stop-Loss: Place just beyond the opposite side of the breakout.
Position Sizing: Limit risk to 1–2% of capital per trade.
Trailing Stops: As price moves in your favor, trail your stop-loss to lock in profits.
Risk–Reward Ratio: Target at least 2:1. For every ₹1 risked, aim to gain ₹2.
Without proper risk control, even a few failed breakouts can wipe out profits from several successful ones.
9. Identifying False Breakouts
False breakouts happen when price temporarily breaches a key level and then reverses sharply. These are often caused by stop-hunting or lack of follow-through buying/selling.
How to Identify:
Breakout happens with low or average volume.
Price doesn’t close beyond the level.
Immediate reversal candle (like a shooting star or bearish engulfing).
How to Avoid:
Wait for confirmation on closing basis.
Avoid trading during major news events when volatility is erratic.
Use alerts instead of instant market entries.
10. Conclusion: Mastering the Art of Breakouts
Breakout trading offers tremendous potential—but only for disciplined traders who respect structure, volume, and risk. Successful breakout traders don’t chase—they anticipate, confirm, and control risk.
By focusing on volume confirmation, price structure, and broader trend context, you can distinguish between genuine and false breakouts. Equally important is patience—waiting for setups that align technically and psychologically.
Remember: every breakout is an opportunity, but only if you trade it with a plan. Stay objective, manage your emotions, and protect your capital. Over time, mastering breakout trading becomes less about prediction and more about precision—the art of entering when others hesitate and exiting when others panic.
Quantitative Trading in India1. What is Quantitative Trading?
Quantitative trading involves developing mathematical models that analyze large sets of historical and real-time market data to identify profitable trading opportunities. These models are then translated into algorithms that execute trades automatically when specific conditions are met.
Unlike traditional trading, where decisions are based on human analysis or intuition, quant trading depends on data-driven models—built from statistical patterns, price behavior, and probability-based predictions.
For instance, a quantitative model might identify that whenever a particular stock’s price crosses its 50-day moving average, there’s a 60% chance it will rise by 1% in the next two days. The algorithm will then automatically place a buy order when this condition occurs and exit when profit or risk targets are hit.
2. The Rise of Quantitative Trading in India
The Indian financial market has undergone a digital revolution in the past decade. The introduction of advanced trading platforms, co-location services by exchanges, and faster internet connectivity has made algorithmic and quantitative trading more accessible.
NSE and BSE Initiatives: Both the National Stock Exchange (NSE) and Bombay Stock Exchange (BSE) allow algorithmic trading through their APIs. The NSE launched “NOW” and later “Colo” services that let institutional traders place their servers near the exchange for low-latency execution.
Growth in HFT and Algo Desks: Many domestic and foreign institutional investors now operate high-frequency trading (HFT) and quant desks in India.
Retail Access: With brokers like Zerodha, Upstox, and Interactive Brokers offering APIs, even retail traders can deploy basic quant strategies today.
India’s equity and derivatives markets—known for their liquidity and volatility—offer ideal conditions for quantitative models to thrive.
3. Key Components of Quantitative Trading
Quantitative trading relies on multiple technical and analytical components:
a. Data Collection and Processing
The foundation of quant trading is data—price, volume, volatility, order book, and macroeconomic indicators. Traders use both historical data (to backtest strategies) and real-time data (for live execution).
Data is cleaned, normalized, and structured before being fed into analytical models.
b. Mathematical Modeling
Traders use statistical and machine learning techniques to find relationships in the data. Common techniques include:
Regression analysis to predict future price moves.
Time-series modeling like ARIMA or GARCH for volatility forecasting.
Machine learning models such as random forests or neural networks to identify non-linear market patterns.
c. Backtesting
Before deploying a model, it’s tested on historical data to evaluate performance metrics—profitability, drawdown, win rate, and Sharpe ratio. This step helps refine parameters and assess risk.
d. Execution Systems
The strategy is implemented using automated scripts written in Python, C++, or R. Execution systems ensure the trade is carried out efficiently and at the desired price, with minimal slippage and latency.
e. Risk Management
Quantitative traders use strict risk management protocols, including stop-losses, position sizing, and portfolio diversification. Models also include safeguards to handle sudden market disruptions.
4. Types of Quantitative Trading Strategies
Quant trading covers a wide range of strategies. Some of the most popular in India include:
a. Statistical Arbitrage
This strategy involves exploiting temporary price inefficiencies between correlated securities. For example, if two bank stocks usually move together but diverge briefly, a trader might short one and buy the other, expecting prices to converge.
b. Mean Reversion
Based on the idea that prices eventually revert to their mean, traders buy when prices fall below the average and sell when they rise above it.
c. Momentum Trading
Momentum models look for stocks showing strong price movements in one direction and attempt to ride the trend. These are popular in the Indian equity derivatives market.
d. Market Making
Market makers provide liquidity by simultaneously placing buy and sell orders, earning from the bid-ask spread. Quant systems are used to constantly adjust quotes based on volatility and order flow.
e. Machine Learning-Based Models
AI and deep learning models analyze large datasets—including news, social media sentiment, and macro data—to predict short-term price trends.
5. Technology and Infrastructure
Quantitative trading demands high computing power and low-latency infrastructure.
Key tools and technologies include:
Programming Languages: Python, R, C++, and MATLAB for model development.
Databases: SQL, MongoDB, and time-series databases to handle massive data.
Cloud Computing: Platforms like AWS and Google Cloud for scalability.
APIs and FIX Protocols: For real-time data and automated order execution.
Co-location Servers: Provided by NSE and BSE for high-speed trading.
6. Regulatory Framework in India
The Securities and Exchange Board of India (SEBI) regulates quantitative and algorithmic trading. Some of the major regulations include:
Approval Requirement: Institutional participants must get exchange approval before using an algorithm.
Risk Checks: Pre-trade risk controls are mandatory—such as order price bands and quantity limits.
Audit Trail: All automated strategies must maintain complete logs of trades.
Fair Access: SEBI ensures equal market access for all participants, preventing latency advantages.
Retail traders using broker APIs are also subject to compliance checks, including throttling limits and order validations.
7. Advantages of Quantitative Trading
Quant trading offers multiple advantages over traditional manual methods:
Emotion-Free Decision Making: Models rely on logic and data, not human emotion.
Speed and Efficiency: Algorithms execute trades in microseconds.
Backtesting Capability: Strategies can be tested before deployment.
Scalability: The same model can be applied across multiple instruments.
Diversification: Automated systems can manage hundreds of securities simultaneously.
8. Challenges in India’s Quant Landscape
Despite its growth, quant trading in India faces unique challenges:
Data Quality: Historical tick data is expensive and often inconsistent.
Regulatory Complexity: Frequent SEBI changes create compliance hurdles.
Infrastructure Costs: Co-location and low-latency systems are costly for small firms.
Talent Gap: Skilled professionals with expertise in both finance and coding are limited.
Market Depth: While Nifty and Bank Nifty are highly liquid, smaller stocks lack sufficient volume for quant models.
9. The Future of Quantitative Trading in India
The future of quantitative trading in India looks extremely promising. As AI, machine learning, and big data analytics continue to evolve, trading models are becoming smarter and faster. The democratization of APIs and data feeds is enabling more retail traders to experiment with quant strategies.
Additionally, with the growth of quant funds, hedge funds, and proprietary trading firms in India, institutional adoption is accelerating. Educational programs and fintech incubators are also nurturing the next generation of quantitative analysts.
In the coming years, India is likely to see:
Greater integration of AI-driven predictive analytics.
Expansion of retail quant platforms.
Development of multi-asset quant models including commodities and currencies.
Stronger regulatory frameworks ensuring market fairness.
10. Conclusion
Quantitative trading is transforming India’s financial landscape. It represents the intersection of finance, mathematics, and technology—allowing traders to make data-driven decisions with precision and speed. While challenges like regulation and data access remain, the momentum toward automation is irreversible.
As markets mature and technology becomes more accessible, quantitative trading will continue to dominate institutional desks and increasingly empower sophisticated retail participants. In essence, the future of trading in India is quantitative, algorithmic, and intelligent.
Geopolitical Energy TradingThe Intersection of Power, Politics, and Global Markets
Energy is the lifeblood of the global economy. Every modern industry—from manufacturing and transportation to technology and agriculture—relies on steady energy supplies. Yet, energy trading is not simply a matter of market forces like supply and demand. It is deeply shaped by geopolitics—the strategic and political relationships among nations. Geopolitical energy trading refers to the global buying, selling, and movement of energy resources such as oil, gas, coal, and renewables, influenced by political decisions, regional alliances, conflicts, and national interests.
In the 21st century, as countries compete for energy security, control over resources, and technological dominance in renewables, the geopolitical stakes of energy trading have never been higher.
1. The Foundation of Geopolitical Energy Trading
Energy trading is the mechanism through which countries and corporations buy and sell energy commodities across borders. Traditional markets have been dominated by fossil fuels—crude oil, natural gas, and coal. However, as the world moves toward cleaner energy, renewable energy credits, carbon permits, and electricity are becoming new instruments of trade.
Geopolitics enters this equation because energy resources are unevenly distributed. For instance:
The Middle East holds massive oil reserves.
Russia dominates natural gas exports to Europe.
The United States has become a major exporter of LNG (liquefied natural gas) and crude oil.
China is the world’s largest energy importer and a leading investor in renewable technologies.
This imbalance of resources creates dependencies, alliances, and rivalries that shape global energy flows.
2. Oil and Geopolitics: The Old Power Game
Crude oil has long been the most geopolitically sensitive commodity. The Organization of the Petroleum Exporting Countries (OPEC), formed in 1960, was one of the first examples of nations using collective control over energy supply to influence global politics and prices.
Oil’s strategic role became clear during events such as:
The 1973 Oil Crisis, when Arab OPEC members imposed an embargo on Western nations supporting Israel, causing oil prices to quadruple.
The Iran-Iraq War (1980s) and the Gulf War (1991), which disrupted oil production and transportation.
Russia-Ukraine tensions, where energy pipelines became tools of political leverage over Europe.
Oil prices often rise during conflicts in major producing regions, as traders fear supply disruptions. In response, consuming nations build strategic petroleum reserves (SPRs) to guard against shortages.
3. Natural Gas: The New Energy Weapon
Natural gas, once considered a regional fuel due to its transportation challenges, has become a global commodity thanks to LNG technology. Pipelines and LNG terminals now connect producers and consumers across continents.
However, gas also holds strong geopolitical weight. For decades, Europe’s dependence on Russian gas shaped diplomatic relations. When Russia invaded Ukraine in 2022, it used gas supply cuts as a political tool, leading to an energy crisis in Europe. European countries had to rapidly diversify, importing LNG from the US, Qatar, and Australia.
Similarly, China has built extensive energy partnerships through its Belt and Road Initiative (BRI), investing in pipelines from Central Asia and maritime terminals across Asia and Africa. These moves aim to secure long-term energy supplies while expanding China’s geopolitical influence.
4. The Rise of Energy Independence
Geopolitical energy trading also involves efforts by countries to reduce dependency on foreign suppliers. This strategy is known as energy independence.
For example:
The United States experienced an energy revolution through shale oil and gas extraction (fracking), turning it from a major importer into an exporter.
India is investing heavily in solar and green hydrogen to reduce crude import dependence.
European nations are accelerating renewable adoption to minimize reliance on unstable regions like the Middle East and Russia.
Energy independence reshapes global trade routes and weakens traditional energy powerhouses, redistributing influence among nations.
5. Renewables and the New Geopolitics
As the world transitions toward clean energy, a new form of geopolitical competition is emerging. Instead of fighting over oil wells, countries now compete for lithium, cobalt, rare earth elements, and solar panel technology—key inputs for renewable energy systems and electric vehicles.
For instance:
China dominates over 70% of the global solar panel and battery manufacturing market.
Chile, Australia, and Bolivia hold vast lithium reserves essential for EV batteries.
Africa is becoming a crucial player due to its mineral wealth.
This creates a new type of “green geopolitics” where nations with renewable technologies and resources hold strategic leverage. Control over energy transition technologies—such as grid infrastructure, hydrogen systems, and battery supply chains—could define the next era of energy dominance.
6. Energy Trading Hubs and Routes
Energy trading also depends on strategic chokepoints and hubs that influence transportation and pricing. Some of the world’s most vital routes include:
The Strait of Hormuz (linking Persian Gulf oil to global markets)
The Suez Canal (connecting Europe and Asia)
The Malacca Strait (key route for China and East Asia)
The Panama Canal (connecting Atlantic and Pacific trade flows)
Disruptions in any of these routes—due to war, piracy, or blockades—can send shockwaves through global markets.
Major trading hubs such as Singapore, Rotterdam, Houston, and Dubai facilitate physical energy trade and derivatives trading. They serve as price benchmarks and logistics centers for global traders.
7. Political Sanctions and Market Volatility
Sanctions are one of the most powerful geopolitical tools in energy trading. When major producers like Iran, Venezuela, or Russia face international sanctions, their oil and gas exports are restricted, affecting global supply and prices.
For example:
Sanctions on Iran reduced its oil exports, tightening supply in the Asian market.
Restrictions on Russian crude and gas after 2022 reshaped global flows, with Russian energy redirected to China and India at discounted rates.
These sanctions also triggered a surge in “shadow fleets”—unregulated tankers trading sanctioned oil covertly.
Geopolitical uncertainty creates volatility, which traders exploit through derivatives like futures and options, betting on price movements influenced by political developments.
8. Role of International Organizations
Several institutions influence the global energy trade’s geopolitical balance:
OPEC+, including Russia, coordinates oil output to stabilize prices.
The International Energy Agency (IEA) advises consumer nations on energy policy and emergency stockpiles.
The World Trade Organization (WTO) and United Nations mediate energy-related disputes and environmental regulations.
COP summits set climate targets that reshape long-term energy investment patterns.
Thus, energy trading is not only an economic system but also a diplomatic and regulatory framework managed through multilateral negotiations.
9. Emerging Trends and the Road Ahead
The next decade will redefine geopolitical energy trading through several key trends:
Decarbonization Pressure: Countries are racing to meet net-zero targets, creating demand for carbon trading and green hydrogen.
Regional Energy Blocs: Alliances like the BRICS and EU Energy Union are forming to coordinate energy policy and trade.
Digital Energy Markets: Blockchain and AI-based trading platforms are making energy exchange more transparent and efficient.
Energy Storage Wars: Control over battery production and recycling will become as critical as oil reserves once were.
As energy systems become more diversified, geopolitics will revolve around technology, supply chains, and environmental diplomacy rather than just resource control.
Conclusion
Geopolitical energy trading is a complex dance between power, economics, and survival. Nations leverage energy as both a weapon and a tool of cooperation. While fossil fuels continue to dominate global trade, the rise of renewables, electric mobility, and digital infrastructure is redrawing the geopolitical map.
In this evolving landscape, countries that balance energy security, diversification, and innovation will hold the upper hand. The transition from oil-based geopolitics to a multi-energy world will not end energy rivalries—but it will transform them into a new contest over clean technologies, supply chains, and strategic influence.
How to Understand Candlestick Patterns1. The Structure of a Candlestick
A single candlestick consists of four main components:
Open: The price at which the asset began trading during that time period.
Close: The price at which the asset finished trading during that period.
High: The highest price reached within that timeframe.
Low: The lowest price reached within that timeframe.
The body of the candlestick represents the range between the open and close prices.
The wicks or shadows (thin lines above and below the body) show the highs and lows.
If the close is higher than the open, the candlestick is often colored green or white, indicating bullish (buying) pressure.
If the close is lower than the open, the candlestick is usually red or black, showing bearish (selling) pressure.
This simple structure gives an instant snapshot of price behavior within that period.
2. Why Candlestick Patterns Matter
Candlestick patterns are more than just shapes—they reflect market psychology: the emotions of traders, including fear, greed, and hesitation. When you interpret these patterns correctly, you can anticipate what the market might do next.
For example:
A long green candle indicates strong buying enthusiasm.
A long red candle shows aggressive selling pressure.
A candle with a small body and long wicks reflects indecision in the market.
Over time, combinations of these candles form patterns that traders use to predict price direction.
3. Types of Candlestick Patterns
Candlestick patterns are generally categorized into three main types:
Reversal patterns – Indicate a change in trend direction.
Continuation patterns – Suggest the trend will likely continue.
Indecision patterns – Show hesitation, signaling a possible pause or reversal.
Let’s explore each with examples.
4. Reversal Candlestick Patterns
These patterns often appear at the end of a trend and signal a potential turning point.
a. Hammer and Hanging Man
Hammer: Found in a downtrend, it has a small body with a long lower wick. This means sellers drove prices down, but buyers stepped in and pushed it back up—a sign that bulls are gaining control.
Hanging Man: Looks identical to a hammer but occurs in an uptrend. It suggests buyers are losing momentum and sellers might soon take over.
b. Bullish Engulfing Pattern
A small red candle is followed by a large green candle that completely engulfs the previous body. This shows a strong shift from selling to buying pressure, indicating a potential uptrend reversal.
c. Bearish Engulfing Pattern
The opposite of the bullish version. A small green candle is followed by a large red one that engulfs it—signaling that bears are taking charge, often leading to a downtrend.
d. Doji
A doji occurs when the open and close prices are nearly the same, forming a very small body with long wicks. It shows indecision between buyers and sellers. Depending on its position within the trend, it may signal a reversal or continuation.
e. Morning Star and Evening Star
Morning Star: A three-candle pattern signaling a bullish reversal. It consists of a long red candle, a small indecisive candle (doji or small body), and a long green candle confirming the reversal.
Evening Star: The opposite, signaling a bearish reversal, often found at the top of an uptrend.
5. Continuation Candlestick Patterns
These patterns suggest that the current trend—up or down—is likely to persist.
a. Rising Three Methods
Appears in an uptrend. It starts with a strong green candle, followed by several small red candles (temporary pullback), and then another strong green candle breaking above the previous high—confirming the continuation of the bullish trend.
b. Falling Three Methods
The bearish version of the above. A large red candle, followed by small green candles, and another large red candle indicate that the downtrend will continue.
c. Bullish and Bearish Harami
Bullish Harami: A small green candle forms within the body of a prior large red candle—suggesting selling pressure is weakening.
Bearish Harami: A small red candle forms inside a prior green one—hinting at potential downward movement.
6. Indecision or Neutral Candlestick Patterns
Some patterns show uncertainty or consolidation—meaning traders are waiting for a breakout in either direction.
a. Spinning Tops
These candles have small bodies and long upper and lower wicks. They indicate a tug-of-war between buyers and sellers, ending in near balance. They often precede a breakout or trend reversal.
b. Doji (Revisited)
Depending on its position, a doji might signal hesitation within an existing trend or the start of a reversal once confirmed by subsequent candles.
7. Understanding Candlestick Context
Candlesticks don’t work in isolation—they must be analyzed in context:
Trend Direction: A bullish pattern in a strong downtrend may not succeed unless confirmed by volume or follow-up candles.
Volume: High trading volume strengthens the validity of a pattern.
Support and Resistance: Patterns near key levels (like support zones or resistance lines) carry more weight.
Timeframe: Higher timeframes (daily or weekly charts) usually provide more reliable patterns than shorter ones (5-minute or 15-minute).
Example:
If a hammer forms near a major support level with high volume, it’s a strong indication that buyers are stepping in.
8. Common Mistakes When Reading Candlestick Patterns
Ignoring Market Context: Patterns can fail if you don’t consider overall trend or support/resistance zones.
Trading Without Confirmation: Always wait for confirmation—like a closing candle or volume spike—before entering trades.
Overtrading Patterns: Not every pattern guarantees a reversal or breakout. Use them with other tools like moving averages or RSI.
Forgetting Risk Management: Even the strongest pattern can fail. Use stop-loss orders to manage risk.
9. Combining Candlestick Patterns with Indicators
To improve accuracy, traders combine candlestick patterns with:
Moving Averages (to identify trend direction)
RSI (Relative Strength Index) (to gauge overbought/oversold levels)
MACD (Moving Average Convergence Divergence) (to confirm momentum shifts)
Volume Indicators (to measure strength of buying or selling pressure)
For example, a bullish engulfing pattern confirmed by RSI moving up from an oversold level is a strong buy signal.
10. Final Thoughts: Mastering Candlestick Patterns
Candlestick analysis blends visual observation with emotional insight. Every candle tells a part of the story—who’s winning, who’s losing, and what might come next.
To truly master candlesticks:
Study real charts daily.
Observe how patterns behave across different timeframes.
Learn which patterns work best in trending versus ranging markets.
Always confirm patterns with volume and momentum indicators.
With consistent practice, candlestick patterns will become second nature, allowing you to anticipate price movements with greater confidence and precision.
Mid-Cap Index Fund: Risks and Rewards ExplainedWhat Are Mid-Cap Index Funds?
Mid-cap index funds are mutual funds or exchange-traded funds (ETFs) that replicate the performance of a mid-cap index, such as the Nifty Midcap 150 Index or the S&P BSE Midcap Index in India. These indices include companies ranked between 101 and 250 in terms of market capitalization.
Mid-cap companies are typically firms that have moved past the early growth stage of small-caps but have not yet reached the size and stability of large-caps. They are often expanding aggressively, gaining market share, or innovating within their sectors.
By investing in a mid-cap index fund, investors gain diversified exposure to a basket of such companies, reducing the risks associated with holding individual mid-cap stocks.
Rewards of Investing in Mid-Cap Index Funds
1. High Growth Potential
Mid-cap companies often experience faster growth than large-cap firms because they operate in the expansion phase. They may be entering new markets, developing innovative products, or improving operational efficiency. As a result, their earnings can grow rapidly, leading to significant stock price appreciation over time.
Historically, mid-cap indices have outperformed large-cap indices during periods of economic expansion. For instance, when GDP growth is strong, mid-caps tend to benefit more due to their agility and ability to capture emerging opportunities faster than larger corporations.
2. Diversification Benefits
Mid-cap index funds provide diversification across multiple sectors and companies, spreading out risk. Unlike investing in a handful of mid-cap stocks, a mid-cap index fund holds dozens (or even hundreds) of companies from different industries. This diversification helps cushion the impact if a few companies underperform.
For example, a fund tracking the Nifty Midcap 150 Index holds companies from sectors like finance, manufacturing, IT, pharmaceuticals, and consumer goods—offering balanced exposure to the broader economy.
3. Potential to Outperform Large-Cap Funds
Over long investment horizons, mid-cap index funds have shown the ability to outperform large-cap funds due to their higher growth potential. While large-cap companies have more stable earnings, their size often limits explosive growth. Mid-cap firms, being smaller, can expand revenues and profits at a faster pace, leading to superior long-term returns.
Many studies and market analyses indicate that over 10–15 years, the mid-cap segment can deliver higher compounded annual growth rates (CAGR) than the large-cap segment, especially in emerging markets like India.
4. Lower Expense Ratio (in Index Funds)
Since mid-cap index funds passively track an index, they do not require active fund management. This results in a lower expense ratio compared to actively managed mid-cap funds. Over time, lower costs can significantly improve net returns, especially in long-term compounding.
This cost efficiency makes mid-cap index funds attractive to investors seeking growth without the higher costs of active management.
5. Participation in India’s Growth Story
Mid-cap companies are often at the forefront of India’s growth sectors—such as renewable energy, infrastructure, technology, and manufacturing. Investing in mid-cap index funds allows investors to participate in the evolving economic landscape and benefit from rising domestic consumption, innovation, and industrial expansion.
Risks of Investing in Mid-Cap Index Funds
While mid-cap index funds offer exciting rewards, they also carry certain risks that investors must understand before investing.
1. Higher Volatility
Mid-cap stocks are generally more volatile than large-cap stocks. Their prices can swing significantly in short periods due to lower trading volumes, limited institutional coverage, and market sentiment shifts. During bearish or uncertain markets, mid-cap indices tend to fall more sharply than large-cap indices.
For example, during market corrections or economic slowdowns, investors often move their money to safer large-cap or defensive stocks, causing mid-caps to underperform temporarily.
2. Liquidity Risks
Mid-cap companies typically have lower liquidity compared to large-caps. This means fewer buyers and sellers are available at any given time, making it harder to buy or sell large quantities without affecting the stock price. During market stress, liquidity in the mid-cap segment can dry up quickly, leading to steep price declines.
Although an index fund itself is liquid (as it trades like a mutual fund or ETF), the underlying stocks can face liquidity issues, especially in times of panic selling.
3. Business and Operational Risks
Mid-cap firms are still in their growth phase, which means they face higher business risks—such as competition, management inefficiencies, regulatory changes, or funding challenges. They may also lack the financial strength of large corporations to weather long downturns or sudden market disruptions.
A few poor business decisions or operational inefficiencies can hurt profitability and, in turn, the stock’s performance.
4. Market Cycle Sensitivity
Mid-cap stocks perform best in bull markets or during periods of economic expansion. However, they are highly sensitive to market cycles. During recessions or market downturns, investors tend to favor large-caps for stability, leaving mid-caps lagging behind. This cyclical behavior means timing and patience play a crucial role in mid-cap investing.
Investors with a short-term horizon may find it difficult to handle the swings in mid-cap index performance.
5. No Active Management
Because mid-cap index funds are passively managed, fund managers do not have the flexibility to sell underperforming stocks or adjust portfolio allocation in response to market conditions. The fund must mirror the index composition, even if certain stocks are overvalued or declining.
This lack of active oversight can sometimes lead to underperformance compared to actively managed mid-cap mutual funds.
Who Should Invest in Mid-Cap Index Funds?
Mid-cap index funds are suitable for investors who:
Have a medium to long-term horizon (at least 5–7 years).
Can tolerate moderate to high volatility.
Want exposure to growth-oriented companies without active fund management costs.
Seek to diversify their portfolio beyond large-caps but with less risk than small-caps.
These funds fit well in a core-satellite investment strategy, where large-cap index funds form the core (stability) and mid-cap funds act as the satellite (growth booster).
How to Manage the Risks
Investors can manage mid-cap fund risks by:
Investing through SIPs (Systematic Investment Plans) to average out volatility.
Staying invested long-term, as mid-caps tend to outperform after full market cycles.
Balancing the portfolio with a mix of large-cap and mid-cap index funds.
Reviewing performance periodically to ensure it aligns with financial goals and risk tolerance.
Conclusion
Mid-cap index funds occupy a sweet spot in the investment landscape—offering a blend of growth and diversification. They represent the potential of companies that are ambitious, expanding, and capable of becoming tomorrow’s large-caps.
However, this opportunity comes with higher volatility and business risks compared to large-caps. Therefore, investors must approach mid-cap index funds with discipline, patience, and a long-term view. When held for 5–10 years or more, these funds can play a vital role in wealth creation, bridging the gap between stability and growth in a well-balanced portfolio.
In summary, mid-cap index funds reward those who stay the course—offering strong potential returns to investors willing to navigate the temporary bumps along the way toward long-term financial success.
Small-Cap Index Funds Volatility Explained1. Understanding Small-Cap Index Funds
Small-cap index funds track market indices composed of small-cap stocks—companies typically valued between ₹5,000 crore and ₹20,000 crore in India (or between $300 million and $2 billion globally). Examples include the Nifty Smallcap 100 in India or the Russell 2000 Index in the U.S.
Unlike actively managed funds, index funds do not attempt to pick specific stocks; they simply mirror the performance of a predefined index. This makes them cost-effective and diversified, offering investors exposure to a wide range of small companies in one investment vehicle.
While this diversification helps reduce the risk of individual company failure, it doesn’t eliminate market-level volatility, especially in the small-cap segment.
2. Why Small-Cap Stocks Are Volatile
The key reason behind small-cap fund volatility lies in the nature of the underlying small companies. They are in the growth or expansion phase of their business cycle, which makes their earnings, cash flows, and valuations less stable than those of large, established firms.
Let’s break down the main causes:
a) Limited Financial Resources
Small-cap companies often have restricted access to credit and lower cash reserves. During economic downturns or credit crises, they struggle more than large firms to raise funds or maintain operations, which can cause sharp price declines.
b) Low Liquidity
Shares of small-cap companies are traded less frequently. When investors rush to buy or sell, prices can swing widely because there are fewer buyers or sellers in the market. This low liquidity amplifies short-term price movements.
c) Higher Business Risk
Many small-cap firms operate in niche markets or rely on a limited set of products. This lack of diversification in business models means that any disruption—such as regulatory changes, technological shifts, or a key customer loss—can severely impact their earnings and, consequently, stock prices.
d) Sensitivity to Economic Cycles
Small caps are considered economic barometers. They perform strongly during expansions when demand and growth rise, but they can fall sharply during recessions or when interest rates rise. This cyclical nature adds to their volatility.
e) Market Sentiment
Investor perception plays a significant role in small-cap stock movements. In bullish phases, investors often become overly optimistic, driving prices to unsustainable levels. Conversely, during market corrections, fear can lead to steep declines. Hence, sentiment swings are more pronounced in small-cap segments.
3. Historical Perspective: Volatility Patterns
Looking at historical data, small-cap indices have shown higher annualized volatility compared to large-cap indices. For instance, over long periods, the Nifty Smallcap 100 has displayed greater short-term fluctuations compared to the Nifty 50, though it has also offered higher potential returns over a 10-year horizon.
Periods of extreme volatility often follow market corrections or macroeconomic uncertainty—like the 2008 global financial crisis or the 2020 pandemic. However, in recovery phases, small caps tend to rebound faster and outperform, as investors return to riskier growth opportunities.
4. Measuring Volatility in Small-Cap Funds
Volatility can be measured using several metrics:
a) Standard Deviation
It measures how much a fund’s returns deviate from its average over time. A higher standard deviation indicates greater volatility. Small-cap index funds typically have a higher standard deviation than mid- or large-cap funds.
b) Beta
Beta measures a fund’s sensitivity to the overall market. A beta greater than 1 indicates that the fund is more volatile than the market. Small-cap funds usually have betas ranging from 1.2 to 1.5, meaning they move more sharply in both directions compared to broader market indices.
c) Sharpe Ratio
This metric shows how much excess return a fund provides per unit of risk. Although small-cap funds may have high volatility, if they generate proportionately higher returns, they can still deliver a favorable Sharpe ratio.
5. Short-Term vs Long-Term Volatility
Volatility matters most in the short term. Over days, weeks, or months, small-cap index funds can experience large swings—sometimes 5–10% in a single session during turbulent times.
However, over long investment horizons (5–10 years), these fluctuations tend to average out. Historically, investors who remained invested through multiple market cycles often benefited from the compounding effect of growth in small companies that later became mid- or large-cap giants.
6. Benefits of Volatility: Hidden Opportunities
While volatility often sounds negative, it also presents opportunities for disciplined investors:
Higher Growth Potential: Small companies have more room to grow their earnings, and as their valuations expand, investors benefit from capital appreciation.
Mean Reversion: After sharp sell-offs, small-cap indices often recover quickly, offering attractive entry points.
Diversification Advantage: Adding a small-cap index fund to a portfolio primarily composed of large-cap stocks can improve overall portfolio returns and balance risk.
Thus, for long-term investors who can tolerate fluctuations, volatility can be a friend, not a foe.
7. Managing Volatility: Smart Investment Strategies
To navigate small-cap volatility effectively, investors can adopt several strategies:
a) Long-Term Approach
Holding investments for 7–10 years allows time for small-cap companies to grow and for short-term volatility to even out.
b) Systematic Investment Plan (SIP)
Investing through SIPs helps average out the cost of purchase across market cycles, reducing the impact of volatility.
c) Diversification
Balancing small-cap exposure with mid-cap and large-cap funds creates a more stable portfolio. This helps cushion against sudden declines in the small-cap space.
d) Regular Review
Monitoring fund performance relative to benchmarks ensures that the fund continues to align with your risk tolerance and financial goals.
e) Avoid Market Timing
Trying to predict highs and lows in volatile segments often backfires. Staying invested consistently usually yields better results than frequent trading.
8. Who Should Invest in Small-Cap Index Funds?
Small-cap index funds are not suitable for everyone. They best fit investors who:
Have a high risk tolerance
Seek long-term capital growth
Can withstand temporary market declines
Understand that volatility is part of the journey toward higher returns
For conservative investors or those nearing financial goals, it’s advisable to keep small-cap allocation limited (say 10–15% of the equity portfolio).
9. Real-World Example
Consider the Nifty Smallcap 100 Index. Between March 2020 and November 2021, it surged over 150%, reflecting a massive post-pandemic recovery. Yet, in 2022, the same index dropped around 25% due to global inflation concerns and rate hikes. This wide swing highlights the volatility inherent in small caps—but also their recovery power.
10. Conclusion
Volatility in small-cap index funds is not inherently bad—it’s a reflection of the growth potential and risk embedded in smaller businesses. These funds fluctuate more because they mirror the economic pulse of emerging companies—dynamic, ambitious, and vulnerable.
For patient, informed, and risk-tolerant investors, small-cap index funds can be powerful tools for long-term wealth creation. However, success requires discipline: understanding the market cycles, managing emotions during downturns, and staying invested long enough for volatility to transform into opportunity.
Part 1 Intraday Master ClassIntroduction to Options
Option trading is a type of financial trading that gives investors the right—but not the obligation—to buy or sell an underlying asset, such as stocks, indices, commodities, or currencies, at a predetermined price before or on a specific date. Unlike owning the asset itself, an option allows traders to speculate on price movements or hedge against potential risks in the market.
Options are powerful financial instruments because they can be used for leverage, income generation, and risk management. However, they also carry complexity and risk, making education essential for anyone interested in trading them.

Onmobile Global cmp 73.96 by Weekly Chart viewOnmobile Global cmp 73.96 by Weekly Chart view
- Support Zone 62 to 68 Price Band
- Resistance Zone 78 to 85 Price Band
- Bullish Rounding Bottom under Resistance Zone
- 1st Falling Resistance Trendline seems well sustained
- Next hurdles are Dotted Falling Resistance Trendline and Resistance Zone
- Volumes needed to provide fresh upside to give breakout above the Resistance
- Stock price trending well with positive technical indicators EMA, MACD, RSI, SAR, SuperTrend

Part 10 Trade Like InstitutionsWhy Traders Use Options
Options are used for various purposes:
Hedging – To protect portfolios against adverse price movements. For instance, a fund manager holding stocks may buy Put options to limit downside risk.
Speculation – Traders use options to bet on market direction with limited capital.
Income Generation – Writing (selling) options can earn premium income. Covered Call and Cash-Secured Put strategies are popular examples.
Leverage – Options offer exposure to large positions with a small upfront cost.

Part 9 Trading Master Class With ExpertsTypes of Options
Options can be classified in different ways:
Based on Style:
European Options – can only be exercised on the expiry date.
American Options – can be exercised any time before expiry.
Based on Underlying Asset:
Stock Options – based on shares of companies.
Index Options – based on market indices like Nifty or Bank Nifty.
Commodity Options – based on commodities like gold or crude oil.
Currency Options – based on currency pairs like USD/INR.

Part 8 Trading Master Class With ExpertsHow Option Premium Is Determined
The option premium is influenced by several factors, collectively known as the “Greeks.” These include:
Intrinsic Value – The actual value if exercised immediately (difference between market price and strike price).
Time Value – Extra premium paid for the time left before expiration.
Volatility (Vega) – The higher the market volatility, the higher the option premium.
Delta – Measures how much the option’s price changes with a change in the underlying price.
Theta – Indicates how much the option’s value erodes as time passes (time decay).
Rho – Measures sensitivity to interest rate changes.
For example, an option closer to expiry loses time value faster due to Theta decay.

Part 6 Learn Institutional Trading Key Terminology in Option Trading
Before trading options, understanding the terminology is crucial:
Underlying Asset: The financial asset (e.g., Nifty 50 index, stock, commodity) on which the option is based.
Strike Price: The fixed price at which the option holder can buy or sell the underlying asset.
Premium: The price paid by the buyer to the seller for obtaining the rights of the option.
Expiration Date: The date on which the option contract expires.
In-the-Money (ITM): When exercising the option would be profitable.
Out-of-the-Money (OTM): When exercising the option would not be profitable.
At-the-Money (ATM): When the market price equals the strike price.

RADICO 1 Day Time Frame 🔍 Current price snapshot
Recent price: ~ ₹3,220 on the NSE.
The stock has its 52-week high around ~ ₹3,423 and 52-week low around ~ ₹1,845.
📈 Key technical levels (1-day frame)
Based on available pivot / support/resistance data:
Pivot (daily): ~ ₹2,831.17.
Immediate supports: ~ ₹2,777.77 (S2) and ~ ₹2,800.93 (S1).
Immediate resistances: ~ ₹2,884.57 (R2) and ~ ₹2,907.73 (R3).
Using another source: Support ~ ₹3,143.31 and ~ ₹3,125.26; Resistance ~ ~₹3,219.81 & ~₹3,249.03.
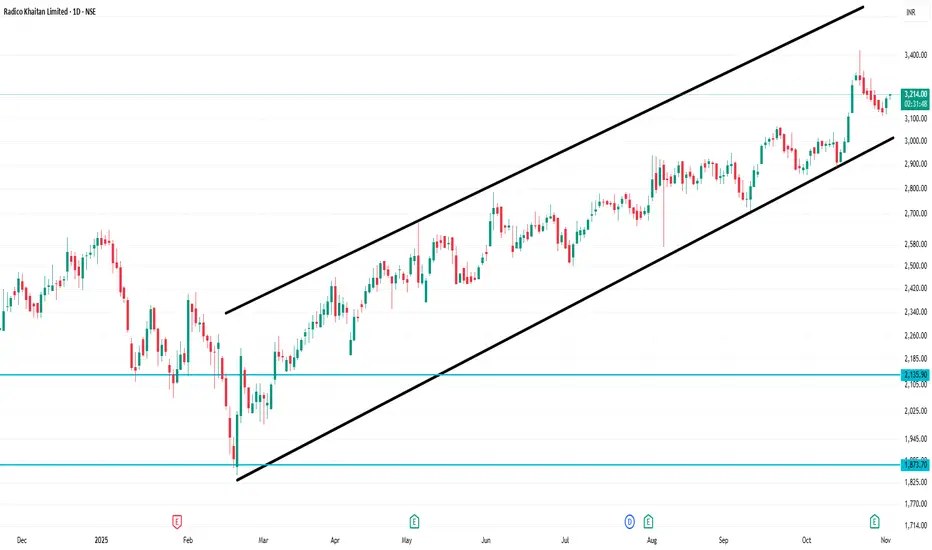
NETWORK18 1 Day Time Frame 📊 Key daily levels to watch
Here are approximate levels based on recent data:
Support: around ₹47.50-₹48.00 region (the near lower band)
Resistance: around ₹50.00-₹52.00 region — a near barrier if the stock tries to bounce.
Pivot/central reference: ~ ₹48.15 (classic pivot) for the day.
📌 Interpretation for a Day Trader
a) If price remains above ~₹48.00 and holds, that level may act as a short-term base.
b) A decisive break above ~₹49.50-₹50.10 with good volume could open a short relief move towards the next resistance zone.
Conversely, a break below ~₹47.50 would signal risk of deeper downside and may invalidate the c) short-term support.
d) Because the trend/indicator setup is weak (daily technicals show “Strong Sell” for daily timeframe), any long trade should be cautious and risk-managed.
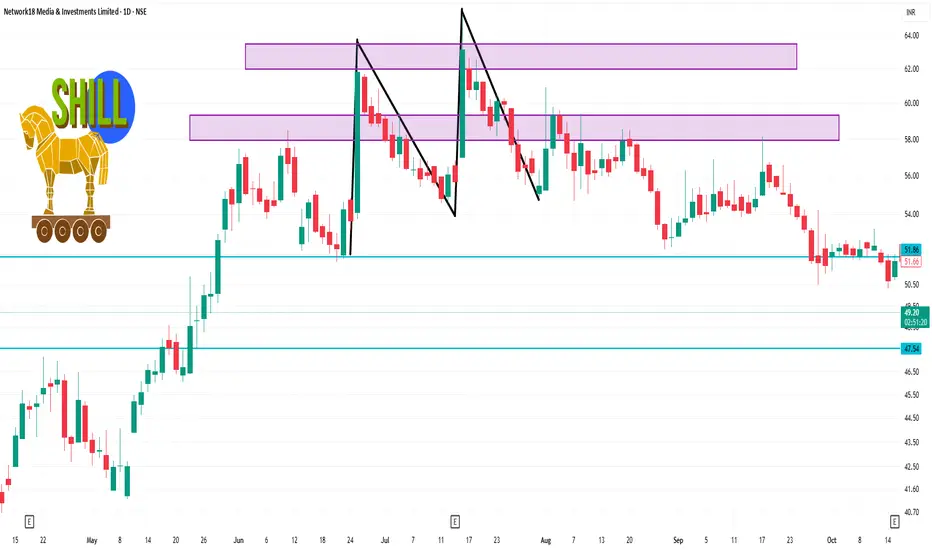
ADANIENT 1 Day Time Frame ✅ Important Levels
From the pivot-point and support/resistance calculations:
Pivot (Classic) ≈ ₹ 2,448.43
Resistance levels: ≈ ₹ 2,466.16 (R1) / ₹ 2,493.93 (R2)
Support levels: ≈ ₹ 2,420.66 (S1) / ₹ 2,402.93 (S2)
🧭 What to watch in the near term
a) If price breaks above ₹2,466-2,493 and holds above, that could shift bias upward and open a test of higher resistance levels.
b) If price slips below ₹2,420-2,402, further downside risk is likely, and next support zones would become relevant.
c) Given the bearish MA structure and weak momentum, the path of least resistance right now appears downward (unless strong buying emerges).