[XAUUSD] New Week Scenario: Accumulation Awaiting Drop New Week Scenario: Accumulation Awaiting Drop - Watch for Selling at Liquidity Zone $4195
Hello traders community,
The new week begins with XAUUSD (Gold) being "restrained" in a sideways structure. However, don't let this calm deceive you. Technically, this is an accumulation pattern with a clear bearish bias.
The market is in "wait" mode, and patience will be the key to catching the next big wave.
📰 MACRO ANALYSIS: TUG OF WAR AHEAD OF FOMC
The market is caught between two opposing streams of information:
Bearish Pressure: Positive signs of a US-China trade deal are reducing the demand for safe-haven assets, putting pressure on Gold prices.
Bullish Support: The weakening USD due to expectations that the Fed will continue to cut interest rates, inadvertently provides some short-term support for the precious metal.
Decisive Factor: Traders are "lying low" waiting for this week's two-day monetary policy meeting (FOMC). This will be the main event, determining the medium-term trend of USD and Gold.
📊 TECHNICAL ANALYSIS: CONTINUATION OF BEARISH STRUCTURE
The H1 chart shows a very clear "Sell" scenario:
Price Structure: After a strong drop from the peak, the price is moving sideways in an accumulation pattern of a bearish pennant. This is a continuation structure, indicating that the Sellers are "resting" before pushing the price further down.
Ideal Sell Zone: The $4195 zone is an extremely strong resistance confluence, marked as "Liquidity strong" on the chart.
This is the 0.5 Fibonacci level, the "golden" retracement point of the entire previous decline.
This is the old support zone now turned into new resistance.
Optimal Scenario: We will wait for the price to pull back to test the $4195 liquidity zone. This is an opportunity for Sellers to enter the market with low risk and high profit potential.
🎯 TRADING PLAN (SELL SETUP)
Absolute priority is to Watch for Selling (Sell) in line with the main trend.
ENTRY (Sell): $4195
STOP LOSS: $4205
TAKE PROFIT: TP1: $4168-TP2: $4145-TP3: $4122-TP4: $4102
SUMMARY
In the context of the market awaiting FOMC news, Gold is likely to make a final "pullback" to the $4195 zone before continuing its downtrend. Be patient and wait for signals at this ideal sell zone.
Wishing traders a successful and disciplined new trading week!
Trendtrading

XAUUSD – Bearish scenario activatedXAUUSD – Bearish scenario activated: watch for sell retest at 4,303–4,305, deep buy at 4,208–4,210 🟡
Gold just hit a historic peak at 4,381 but the subsequent sharp drop opens up the risk of a short-term correction. On H1, the price is blocked by the descending trendline and the sell zone cluster at 4,30x; below are liquidity zones and the bottom trendline waiting to be retested.
Quick chart insights
The structure shifts to a descending triangle pullback after breaking the upward momentum.
Sell zone 4,303–4,305 coincides with the descending trendline + thick volume (VP).
Below 4,26x is Liquidity Buy; deeper is the 4,208–4,210 mark near FE 4.236 and the trendline base — the final “shakeout” zone before recovery.
Trading plan (if–then)
Sell retest (priority in weak rebound)
Entry: 4,305–4,303
SL: 4,310
TP: 4,287 → 4,260 → 4,242 → 4,220
Condition: rebound to 4,30x and appearance of rejection/engulfing candle on H1 below the descending trendline.
Deep buy (liquidity sweep + bounce back)
Entry: 4,210–4,208
SL: 4,204
TP: 4,225 → 4,242 → 4,270 → 4,298
Condition: deep shakeout to 4,21x, appearance of pin bar/absorbing volume at the bottom trendline.
Invalidation
Sell scenario invalidated if H1 closes above 4,310.
Buy scenario invalidated if H1 closes below 4,204 (risk of deeper trendline range).
Key levels to watch (easy to view on mobile)
Resistance: 4,303–4,305 • 4,320–4,325 (descending trendline)
Support: 4,260–4,255 • 4,242 • 4,210–4,208 • 4,200
Expected move: rebound to 4,30x → sell down to 4,26x/4,24x; sweep 4,21x → bounce back to 4,27x–4,29x.
Quick context (macro)
Expectations of Fed rate cuts + geopolitical risks keep the major trend upward, but post-ATH often sees short-term sell-offs to rebalance positions.
Monitor USD/yield fluctuations: a strong USD will support the sell retest scenario; a cooling USD creates opportunities for rebounds from buy zones.

XAUUSD: Prioritise Buying, Is the $5000 Target Still Far?XAUUSD: "No More Gold to Sell" - Prioritise Buying, Is the $5000 Target Still Far?
Hello trading community,
The Gold market (XAUUSD) is in a state of "extreme euphoria", continuously setting new highs. The upward momentum is not only driven by technical charts but also bolstered by extremely strong macro factors.
This article will analyse why the strategy "Prioritise Buying on Dips" is optimal, and the $4400 mark, though seemingly high, may not be the final stop.
📰 Macro Analysis: "No More Gold to Sell!"
The market is witnessing a physical supply shock that we cannot ignore:
Supply Shock: Japan's largest gold retailer had to temporarily halt gold bar sales due to overwhelming buying demand. This is a clear signal that physical gold demand is far outstripping available supply. When physical gold is scarce, the paper market price must rise to reflect true value.
Falling Bond Yields: The 10-year German government bond yield (representing Europe) has fallen to its lowest since June. Lower yields make Gold (a non-yielding asset) significantly more attractive compared to holding bonds.
Both these factors are creating a "perfect storm" supporting the price rise of XAUUSD.
📊 Technical Analysis
The M30/H1 chart shows a very sustainable parabolic uptrend structure:
Trend: The uptrend is undeniable. The price is moving within a steep upward channel, with all selling efforts quickly absorbed by buyers.
Fibonacci Extension: The Fibonacci extension levels are acting as the next price targets:
Zone $4382 (Fib 2.273): Conquered.
Zone $4407 - $4410 (Fib 2.407): This is a potential "Sell Scalping" zone, where a short correction might occur.
Zone $4480 - $4483 (Fib 2.618): This is a strong resistance "Sell Zone", the next target for buyers.
Volume Profile (VPVR):
Support "Buy Retest" ($4290 - $4300): This is an extremely important liquidity zone, a broken old peak and also an area with large accumulated trading volume. Buyers will strongly defend this zone.
🎯 Detailed Trading Strategy
The main trend is to Buy. All sell orders (Sell) at this time carry high risk and should only be considered for short-term scalping to catch corrections.
Scenario 1: Buy the Dip 📈
Entry Zone: Wait for a price correction to the "Buy retest" zone $4290.
Stop Loss: $4280.
Take Profit: $4312 - $4334 - $4372 - $4390.
Scenario 2: Sell Scalping ⚡️
Entry Zone: Look to sell at the Fibo $4410 zone.
Stop Loss: $4420.
Take Profit: $4393 - $4380 - $4370. (Note: Counter-trend order, go small volume and take quick profit).
Scenario 3: Sell at Strong Resistance Zone 📉
Entry Zone: $4480.
Stop Loss: $4490.
Take Profit: $4463 - $4442 - $4410.
Summary
The combination of a strong technical uptrend and a fundamental supply shock is pushing Gold into a new price cycle. The $4400 mark has been conquered, and with this momentum, the long-term target of $5000 is no longer a fantasy.
The wisest strategy is to "go with the flow", looking to Buy at key support zones.
Wishing traders a successful week!

XAUUSD – Continues to set ATH XAUUSD – Continues to set ATH, prioritise buying according to POC 4,146–4,148 🟡
Gold continues to make higher highs after a strong rise in the Asian session; the upward channel structure remains intact. On H1, POC ~4,147–4,148 is the nearest support point; above is the resistance cluster according to FE 1.618 ~4,186 and the sell zone 4,221–4,240.
Key levels
Support: 4,146–4,148 (POC) • 4,140 (short-term invalid).
Resistance/targets: 4,166 • 4,186 (FE 1.618) • 4,188–4,200 • 4,221 (sell scalping) • 4,240 (sell zone).
Trading scenarios
Buy 1 – POC pullback
Entry 4,146–4,148 | SL 4,140 | TP 4,166 → 4,188 → 4,200 → 4,245.
If it pulls back to POC and H1 shows a confirmation candle/mid-trendline support, prioritise buying.
Buy 2 – Shallow retest
If the price only dips ~4,160–4,162 then rebounds above POC, additional buying is possible with SL 4,152, TP as above.
Sell reaction (higher risk)
Entry 4,240 | SL 4,250 | TP 4,222 → 4,200 → 4,188 → 4,160.
Only trigger when there is a clear rejection signal at 4,221–4,240; this is a counter-trend trade.
Invalidation & management
Buying bias weakens when H1 closes below 4,140 or breaks the lower channel edge.
After TP1, move SL to entry; avoid chasing price in the 4,18x–4,20x area when volume is thin. 🎯
Quick context
The upward momentum is maintained due to expectations of the Fed ending QT/looser conditions and safe haven flows; however, the 4,221–4,240 area may create a short-term reaction before the uptrend continues.
Trade well with this scenario!

XAUUSD – Liquidity Sweep “Flush”XAUUSD – Liquidity Sweep “Flush”; prioritise trading around key zones 🟡
Gold just dropped nearly 90 points during the Asian session – a time typically lacking volume, resulting in a “flush” that wiped out many leveraged positions. The larger trend remains bullish, but short-term risks of a deep pullback are present before the European–American markets engage.
The accompanying image shows:
Price peaked and then broke the upper edge of the H1 uptrend channel → quickly fell to the mid-channel zone.
Thick Volume Profile cluster around 4.07x, POC ~4,075; below lies VAL ~4,025.
Sell retest zone marked around 4.14x; grey boxes indicate buy zones at 4,075 and 4,056.
Key Levels
Resistance: 4,143–4,150, 4,122, 4,160.
Support: 4,075 (POC), 4,056 (buy scalping), 4,025 (VAL).
Scalping watch: 4,057 – 4,085 – 4,160 – 4,025.
Trading Scenarios
SELL retest (reaction, higher risk)
Entry: 4,143
SL: 4,150
TP: 4,122 → 4,105 → 4,078 → 4,050
Idea: activate only upon clear rejection at 4.14x (long wick/engulfing H1).
BUY at POC zone
Entry: 4,075
SL: 4,067
TP: 4,089 → 4,100 → 4,122 → 4,155
BUY scalping (shallow pullback)
Entry: 4,056
SL: 4,049–4,050
TP: 4,075 → 4,089
Invalidation: short-term buy bias weakens if H1 closes below ~4,025 (VAL). If this zone breaks, prioritise waiting for a failed retest to consider selling with the continued downtrend.
Practical Notes
The range is currently very wide; the European session will increase volume, making false breaks more likely.
After TP1, move SL to entry to secure the position.
Sell orders are merely reaction trades at 4.14x; prioritise buy-the-dip at 4,075/4,056 upon confirmation signals.

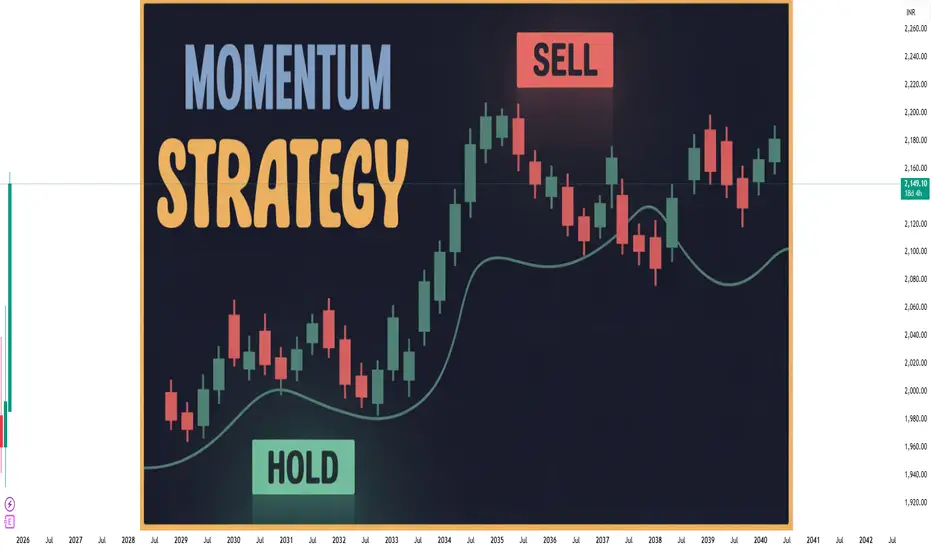
Momentum & Trend Following Strategies in TradingUnderstanding Momentum in Trading
Momentum refers to the rate at which the price of a financial instrument moves in a particular direction. Traders who adopt momentum strategies aim to buy assets showing upward momentum and sell assets showing downward momentum. The underlying assumption is that price trends, once established, tend to persist due to behavioral biases and institutional flows.
Key Concepts in Momentum Trading
Relative Strength: Momentum traders often compare the performance of an asset against its historical performance or a benchmark. Assets outperforming the market are considered candidates for buying, while underperforming assets may be sold or shorted.
Price Rate of Change (ROC): This measures the percentage change in an asset’s price over a specified period, helping traders identify accelerating trends.
Moving Averages & Crossovers: Traders use short-term and long-term moving averages to spot momentum. For instance, if a 20-day moving average crosses above a 50-day moving average, it signals upward momentum.
Breakouts: Momentum traders look for price breakouts from key resistance or support levels, often indicating the start of a strong directional move.
Volume Confirmation: A momentum move accompanied by higher trading volume suggests conviction and increases the probability of trend continuation.
Behavioral Rationale
Momentum is strongly linked to investor psychology. Behavioral biases such as herding, overconfidence, and delayed reaction to news contribute to the persistence of price trends. Market participants tend to chase rising assets, amplifying momentum, while undervalued or declining assets continue to fall as pessimism dominates sentiment.
Momentum Indicators
Several technical indicators are widely used in momentum trading:
Relative Strength Index (RSI): Measures the speed and change of price movements; helps identify overbought or oversold conditions.
Moving Average Convergence Divergence (MACD): Identifies trend direction and momentum strength.
Stochastic Oscillator: Compares a security’s closing price to its price range over a period, indicating momentum shifts.
Rate of Change (ROC): Quantifies the percentage change in price over a specified time frame.
Momentum strategies are typically short-to-medium-term, ranging from a few days to several months, depending on market conditions and the trader’s time horizon.
Understanding Trend Following
Trend following is a broader trading approach based on identifying and riding long-term directional movements in the market. Unlike momentum trading, which focuses on relative performance and price acceleration, trend following emphasizes sustained price movements regardless of speed. Trend followers aim to enter trades in the direction of the prevailing trend and exit when trends reverse.
Core Principles of Trend Following
Markets Trend More Often Than They Mean-Revert: Trend followers operate on the principle that markets, over medium to long-term periods, exhibit trends in response to macroeconomic factors, sentiment shifts, or institutional positioning.
Trading with the Market: Trend following is inherently reactive. Traders wait for clear signals from price movements rather than predicting reversals or tops and bottoms.
Risk Management and Position Sizing: Since trends can reverse unexpectedly, risk management is critical. Trend followers use stop losses, trailing stops, and controlled position sizes to protect capital.
Time Horizon: Trend-following strategies typically have longer holding periods than momentum strategies, ranging from weeks to months or even years in certain markets, such as commodities or forex.
Trend Following Indicators
Trend-following strategies rely heavily on technical indicators to identify the direction and strength of trends:
Moving Averages: Simple Moving Average (SMA) or Exponential Moving Average (EMA) crossovers are common trend signals. For example, a trader may buy when a shorter-term EMA crosses above a longer-term EMA.
Average Directional Index (ADX): Measures the strength of a trend regardless of direction; values above 25 often indicate a strong trend.
Bollinger Bands: Trend followers use bands to confirm price breakouts or sustained trends.
Parabolic SAR: Identifies potential trend reversals and helps with trailing stops.
Practical Implementation
Step 1: Market Selection
Both momentum and trend-following strategies can be applied across multiple markets, including:
Equities: Individual stocks or stock indices.
Forex: Currency pairs exhibiting strong directional movements.
Commodities: Metals, oil, and agricultural products.
Cryptocurrencies: Digital assets with high volatility and clear trends.
Step 2: Identifying Trends or Momentum
For momentum trading, rank assets based on recent performance, RSI, or ROC indicators.
For trend-following, analyze price charts for moving average crossovers, trendlines, or ADX confirmation.
Step 3: Entry and Exit Rules
Momentum Entry: Buy assets showing positive momentum or breaking above resistance; sell or short assets showing negative momentum.
Trend-Following Entry: Enter positions in the direction of the prevailing trend after confirmation from moving averages or trendlines.
Exit Rules: Use stop losses, trailing stops, or reversal signals to exit positions. Trend followers often ride trends until technical indicators signal a reversal.
Step 4: Risk Management
Risk management is critical for both strategies:
Position Sizing: Determine trade size based on account equity and risk tolerance (e.g., risking 1–2% per trade).
Diversification: Spread risk across multiple assets to reduce exposure to a single market.
Stop Losses: Protect capital from unexpected reversals.
Volatility Adjustment: Higher volatility assets may require tighter risk controls or smaller position sizes.
Advanced Strategy Variations
Dual Momentum: Combines relative and absolute momentum. Traders invest in assets with the strongest performance relative to others while ensuring they are positive in absolute terms.
Trend-Momentum Hybrid: Uses momentum indicators for entry and trend-following techniques for position management. For example, enter on RSI breakout but use moving averages to exit.
Sector Rotation: Momentum traders may rotate capital between sectors or asset classes based on relative performance trends.
Algorithmic and Systematic Approaches: Many hedge funds implement algorithmic momentum and trend-following strategies using quantitative models, high-frequency data, and machine learning for signal optimization.
Performance and Market Conditions
Momentum and trend-following strategies tend to perform differently depending on market conditions:
Trending Markets: Both strategies excel in strong, directional trends. Trend followers benefit from sustained moves, while momentum traders profit from short bursts of strong performance.
Choppy or Sideways Markets: Momentum strategies may generate false signals, while trend-following strategies may suffer from whipsaw losses.
Volatile Markets: Momentum strategies can capture rapid gains, but risk management is crucial to avoid large drawdowns.
Empirical studies have shown that momentum strategies often produce short-term outperformance in equities and commodities, while trend-following strategies are particularly effective in commodity, forex, and futures markets over the long term.
Behavioral and Psychological Considerations
Both momentum and trend-following strategies exploit behavioral biases:
Herding: Investors tend to follow recent winners, reinforcing momentum.
Anchoring: Market participants anchor to past prices, creating delayed reactions that trend followers can exploit.
Overreaction: Short-term overreactions create opportunities for momentum trades.
Discipline Requirement: Traders must overcome fear and greed, sticking to systematic rules rather than attempting to time reversals.
Examples of Momentum & Trend Following
Equities: Buying technology stocks outperforming the S&P 500 for the past 3–6 months (momentum) or holding positions until a 50-day moving average crossover signals a reversal (trend-following).
Forex: Trading EUR/USD when it breaks above a recent high with increasing volume (momentum) or following a long-term uptrend using EMA crossovers (trend-following).
Commodities: Entering oil futures when prices break out from a support/resistance zone (momentum) or riding a multi-month trend using ADX to gauge trend strength (trend-following).
Advantages and Limitations
Advantages
Simplicity: Rules-based approach allows systematic trading.
Adaptability: Works across multiple markets and timeframes.
Behavioral Edge: Exploits common psychological biases in trading.
Scalability: Can be applied to both retail and institutional portfolios.
Limitations
False Signals: Particularly in range-bound markets, leading to potential losses.
Drawdowns: Both strategies can experience significant losses during trend reversals.
Market Sensitivity: Performance may degrade in markets with low liquidity or sudden news shocks.
Discipline Required: Traders must follow strict rules, avoiding emotional decision-making.
Conclusion
Momentum and trend-following strategies are pillars of modern trading methodology. While momentum strategies capitalize on short-term price accelerations, trend-following strategies aim to capture long-term directional moves. Both approaches are grounded in behavioral finance principles, technical analysis, and empirical research, making them effective tools for traders seeking systematic, disciplined approaches.
The success of these strategies depends on rigorous market analysis, sound risk management, and psychological discipline. While they are not immune to losses, their adaptability across markets, scalability, and historical efficacy make them indispensable in both retail and institutional trading.
By combining these strategies intelligently, traders can create robust portfolios capable of profiting in multiple market conditions, harnessing both short-term momentum surges and long-term trends for sustained success.
LiamTrading – XAUUSD: Structure BreakLiamTrading – XAUUSD: Structure Break, Preparing for a STRONG DOWNTREND?
Hello trader,
The Gold market has undergone a significant Market Structure Shift, breaking the previous sustainable uptrend. After the key support area around 4000 was breached with high volume, the Bears have taken short-term control.
Currently, the price is experiencing a slight correction after a sharp drop, but overall, it is forming Lower High – Lower Low patterns on the H1 chart, confirming the downward movement.
📊 Technical Analysis (Chart 1H – XAUUSD)
The recent sharp decline has broken the upward structure (Break of Structure - BOS) and created significant inefficiencies/imbalances that need to be filled:
Liquidity Zone (Resistance): $4050 – $4060. This is the resistance peak to watch.
Sell Liquidity Zone (FVG Sell Zone): $4030 – $4040. This is the ideal Fair Value Gap for Bears to re-enter.
Key Support/Buy Scalping Zone: $3925 – $3935 (Confluence area of Fibonacci Extension 2.272).
Swing Buy/Accumulation Zone: $3905 – $3915 (Confluence area of Fibonacci Extension 2.618).
🎯 Main Trading Scenario (Short-term BEARISH)
Sell entry 4000 – 4002
SL 4008
TP 3986 – 3965 3950 – 3923
Sell Entry 4028 – 4031 (FVG)
SL 4036
TP 4022 – 4010 4000 – 3960
Buy Scalping
3926 – 3928
SL 3921
TP 3939 – 3955 3970 – 3990
Buy Bottom Zone 3900 – 3908
SL 3895
TP 3922 – 3945 3970 – 3988
Export to Spreadsheet
🧭 Fundamental View & Market Sentiment
The downward momentum is being driven by the following factors:
Monetary Policy: Fed official Williams' remarks supporting continued rate cuts seem to be reducing the safe-haven demand for Gold. Although rate cuts typically support Gold in the long term (due to "cheap money"), a slowing labour market is a short-term negative signal.
CPI News: The Bureau of Labour Statistics recalling staff to compile the CPI report amid a government shutdown highlights the importance of this data. If CPI is not as expected, it could cause significant volatility.
Market Sentiment: After the structure break, technical selling sentiment may dominate, especially if the price cannot quickly recover to the 4000 level.
📌 Conclusion & Recommendations
Gold has confirmed a short-term structure change to a downtrend. While the long-term trend is not yet clearly defined, the current priority is to seek Sell opportunities when the price retraces to key resistance and FVG areas (such as $4000 and $4030).
Advice: Always adhere to SL (Stop Loss) and prioritise risk reduction when the market shows reversal signals. DO NOT BUY when the downtrend structure is prevailing.
👉 Follow me for detailed updates and the latest trading plans during the session!

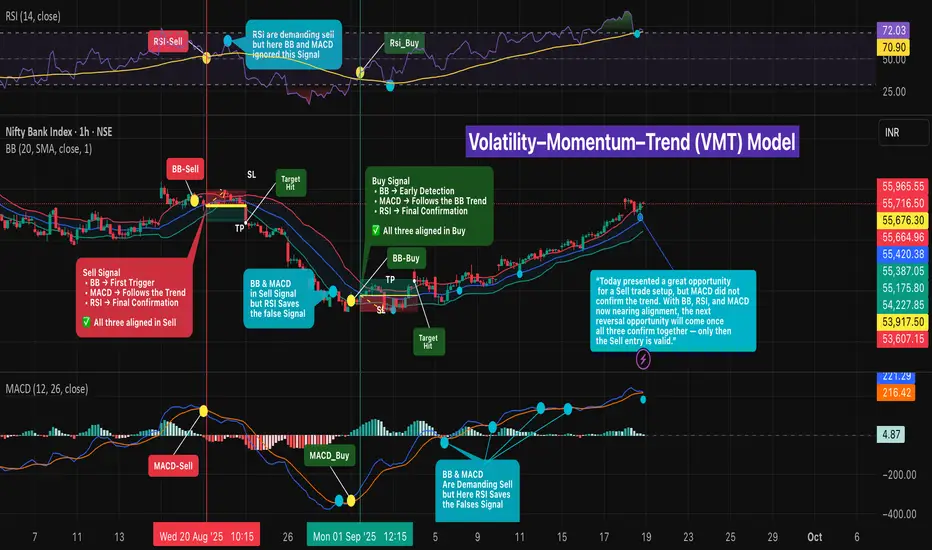
Volatility–Momentum–Trend (VMT) Model🔎 Intro / Overview
Three-indicator confirmation using Bollinger Bands (BB) , MACD , and RSI to align trend and price action.
BB often detects the move first (least lag), MACD follows the BB trend (mid reaction), and RSI confirms last (most lag).
This staged confirmation helps reduce false signals and keeps entries disciplined.
___________________________________________________________
📔 Concept
• Bollinger Bands (BB) → Early detector at volatility extremes.
– Buy : Price first moves outside the lower band , then a candle closes back above lower band → early bullish alert.
– Sell : Price first moves outside the upper band , then a candle closes back below upper band → early bearish alert.
• MACD → Momentum confirmer.
– Buy : MACD crossover above its signal line supports the bullish shift.
– Sell : MACD crossunder below its signal line supports the bearish shift.
• RSI → Final confirmation (filters traps).
– Buy : RSI crosses above its moving average, confirming bullish momentum.
– Sell : RSI crosses below its moving average, confirming bearish momentum.
✅ Only when BB + MACD + RSI all align in the same direction is the signal confirmed.
Notes:
- BB often reacts first (fastest, but prone to false starts).
- MACD provides mid-reaction confirmation.
- RSI lags but acts as the strongest filter against false trades.
Notes: Sometimes BB reacts immediately; MACD/RSI can prevent traps. At times BB+MACD demand a trade but RSI rejects (good filter); other times RSI demands but BB+MACD filter it.
___________________________________________________________
📌 How to Use
🔴 Sell Signal
1) BB: Price first extends outside upper band in an up-move, then a candle closes back under the upper band → BB sell signal.
2) MACD: Crossunder of MACD line below signal line.
3) RSI: RSI crosses below its moving average → final confirmation.
✅ All three aligned = Valid Sell.
🟢 Buy Signal
1) BB: Price first extends outside lower band in a down-move, then a candle closes back above the lower band → BB buy signal.
2) MACD: Crossover of MACD line above signal line.
3) RSI: RSI crosses above its moving average → final confirmation.
✅ All three aligned = Valid Buy.
___________________________________________________________
🎯 Trading Plan
• Entry → Only when all three confirm in the same direction.
• Stop Loss → - Stop-Loss → Near the structure swing that formed when BB first detected the signal (e.g., recent swing high for shorts / swing low for longs).
• Target → At least 1R ; scale/exit remainder using ATR, Fibonacci levels, or box trailing to ride trend.
___________________________________________________________
📊 Chart Explanation
Symbol/TF: BANKNIFTY · 1H
1) 20 Aug · 10:15 — SELL
• BB detected first, MACD mid-reaction (after ~2 candles), RSI confirmed last → Entry @ 55,676.30
• Target @ 55,387.05
• Stop-loss @ 55,965.55
• 🎯 Target hit on 22 Aug · 09:15 .
• Remaining lots can be trailed using ATR , Fibonacci levels , or Box Trailing to ride the extended trend
2) 29 Aug · 10:15 — FILTERED SELL
• BB and MACD demanded sell, but RSI did not confirm → No trade; RSI saved a false signal.
• 🦋 “The aqua dots represent false signals. At times, BB detects early entries but RSI and MACD do not confirm. Sometimes BB and MACD align, but RSI rejects the move. Other times BB and RSI confirm, yet MACD signals false. ✅ Only when all three align together is the signal valid.”
3) 01 Sep · 13:12 — BUY
• All three aligned long
• Entry @ 53,917.05
• Target @ 54,121.50
• Stop-loss @ 53,712.60
• 🎯 Target hit.
• Remaining lots can be trailed using ATR , Fibonacci levels , or Box Trailing to ride the extended trend
👉🏼 “A Sell setup looked promising today, but MACD did not confirm the trend ❌. With BB, RSI, and MACD now nearing alignment, the next reversal opportunity will be valid only when all three confirm together ✅.”
___________________________________________________________
👀 Observation
• BB provides the earliest cue; MACD validates momentum shift; RSI filters late-stage traps.
• Most reliable signals occur near key structure (support/resistance) with confluence.
• Not all alignments are equal—strength improves with decisive closes and supportive volume.
___________________________________________________________
❗ Why It Matters?
•A rule-based, three-step confirmation reduces noise and emotions.
•It clarifies when to enter , when to skip , and how to manage risk consistently across changing market conditions.
___________________________________________________________
🎯 Conclusion
BB → detect , MACD → follow , RSI → confirm .
When all three align, entries are clearer and risk is defined.
🔥 Patterns don’t predict. Rules protect. 🚀
___________________________________________________________
⚠️ Disclaimer
📘 For educational purposes only.
🙅 Not SEBI registered.
❌ Not a buy/sell recommendation.
🧠 Purely a learning resource.
📊 Not Financial Advice.
XAUUSD – Pennant Pattern Waiting for ConfirmationXAUUSD – Pennant Pattern Waiting for Confirmation
Hello Traders,
Gold started the week with a strong bounce of nearly 20 dollars after testing the ascending trendline. This move further confirms the Pennant Flag formation that is currently in play. The key now is to wait for a clear breakout from this structure to position trades effectively.
Bullish Scenario
A break above the upper trendline, with confirmation ideally above 3657, would signal continuation of the uptrend.
Best entry: around 3650, targeting 3680 in the short term.
Bearish Scenario
The 3627 level is critical. A breakdown below this zone, along with a close under nearby support, would validate the bearish case.
Traders can either enter directly on the break or wait for a retest around 3630 for a cleaner entry.
Downside targets could extend to 356x or even lower.
Medium-Term Buy Setup
The 3560 – 3564 zone remains an attractive area, aligning with an FVG and strong volume accumulation.
This is a medium-term buying opportunity, with stop-loss placed below 3544.
Requires larger account size (above $1000) due to wider stop distance, but offers higher reward potential while aligning with the broader bullish trend.
This is my outlook for gold today. Traders can take it as a reference and align it with their own setups.
If you trade gold regularly, you can follow me here and join my community to receive updates quickly when the price action changes.
👉 Wishing everyone a profitable and disciplined trading week with Gold.

Bearish Trade Setup for SOLUSDOverview:
This is a short position on SOLUSD, entering on the 1-hour chart with a well-defined risk-to-reward ratio. The trade is based on a downward trend confirmed by the price action and EMAs, making this a high-probability bearish scenario.
Key Levels and Indicators:
Entry Point: 186.6736
The entry is triggered when the price moves below the resistance level. This confirms the continuation of the downtrend.
Stop Loss: 202.2042
The stop loss is set above the most recent swing high to protect from any sudden price reversals. This level is designed to avoid a whipsaw and ensures the trade is kept within a reasonable risk range.
Target: 155.5356
The target is calculated based on a projected price movement in line with the current trend. Given the current market structure, this target provides an optimal reward-to-risk ratio.
Why is this a Bearish Setup?
Trend Confirmation:
The price has been consistently moving lower, showing strong bearish momentum. The EMAs (9 and 20) are also sloping downwards, reinforcing the likelihood of further downside movement.
Price Action:
The recent price action has formed lower highs and lower lows, a key indication of a strong downtrend.
EMA Alignment:
The 9-period EMA (188.6387) is below the 20-period EMA (192.3233), a classic bearish crossover that confirms the downward bias of the market.
Risk-to-Reward Setup:
The trade offers an excellent risk-to-reward ratio of approximately 1:3, which ensures that potential profits outweigh the risk taken on the trade.
Trade Management:
Entry Criteria: Enter the position when the price breaks below the support zone, ideally near the entry point.
Exit Strategy: Target is set at 155.5356, but keep an eye on the price action in case a trend reversal occurs before hitting the target. Always adjust the stop loss to lock in profits as the price moves in your favor.
Final Thoughts:
This is a well-structured bearish trade idea based on both technical analysis and price action. Always ensure that you follow proper risk management rules and adjust your stop loss or take profit levels based on market conditions.

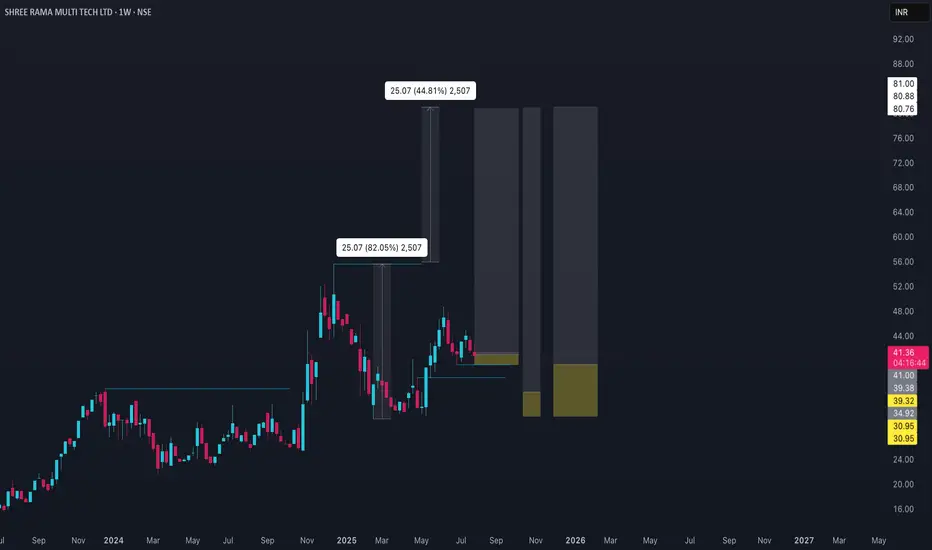
SHREERAMA Price ActionShree Rama Multi-Tech Ltd is currently trading around ₹41 as of late July to early August 2025. In the recent period, the stock has moved within a narrow range of ₹40.50–₹42.95, reflecting relatively low volatility. The short-term price trend appears positive, with upside targets ranging from ₹41.60 to ₹47.58 for the near-to-mid term. On the downside, support levels are seen near ₹40.06 and, more distantly, at ₹31.79 and below.
Fundamentally, the company has posted strong year-on-year sales growth, with March 2025 quarterly net sales up nearly 27% compared to the previous year. This operational momentum may be contributing to the positive sentiment around the stock, even as it consolidates near current levels. However, price targets over the next several months suggest modest gains rather than rapid appreciation, with resistance likely to emerge in the ₹44–₹48 range.
In summary, Shree Rama Multi-Tech Ltd offers a stable price trajectory with moderate upside potential. The outlook is supported by improved sales but tempered by significant resistance after the recent rally. The stock seems suitable for investors seeking gradual gains within the packaging sector, though the pace of growth may remain measured near term.
Liquidty is not so great yet, but stock is strong and trend is clearly up, now only thing is to find a right entry to catch our part of profit.
Flexing at All Time HighGrasim broke a cup & handle pattern and came down, again trying to break another trendline at top of the cup & handle pattern. if it breaks and sustain above the latest breakout with good volume, it'll move up for sure.
***This is only for educational purposes***
BTCUSD Long Setup – Trend Continuation Play📌 Trade Details
Entry: 113,256.5
Target: 115,317.7
Stop Loss: 111,874.4
📊 Trade Rationale
✅ Trend Continuation: Price has respected the ascending trendline multiple times, indicating strong buyer interest.
✅ Break of Structure: Recent higher highs and higher lows confirm bullish momentum.
✅ Support Flip: Zone around 113,050 acted as resistance earlier and is now being retested as support.
✅ Volume Confirmation: Rising volume supports the bullish continuation bias.
✅ Clean Risk–Reward: With SL below structure and TP near major resistance, this setup offers a favorable RRR.
🎯 Target Zone
The target aligns with the next strong supply zone at 115,300+, where sellers may re-enter.
⚠️ Risk Management
Always size positions wisely, as crypto remains highly volatile. Protect your capital first.
Disclaimer:
This idea is for educational purposes only and not financial advice. Do your own research before entering any trade.

BNB/USDT – Short Setup (1H Chart)BNB is showing weakness after repeated rejections and a break below short-term moving averages. Price action indicates selling pressure, and the recent structure suggests continuation to the downside.
🔹 Entry: 841.825
🔹 Target: 784.770
🔹 Stop Loss: 870.281
The risk-to-reward ratio looks favorable, with sellers gaining momentum as long as price remains below resistance. A breakdown from the current consolidation zone may accelerate bearish momentum toward the target zone.
⚠️ This is a short-term bearish trade idea based on technicals. Always manage risk and adjust positions as per market conditions.

Bearish Trade Setup for ETH/USDOverview:
The setup for this trade is based on a bearish outlook for Ethereum (ETH) against the US Dollar (USD) on the 1-hour chart. The entry, stop loss, and take profit levels are carefully defined to provide a balanced risk-to-reward ratio. Here's why this setup is a solid trade idea:
1. Trade Entry:
Entry Price: 4574.87
The entry point is set based on a recent price retracement within the prevailing downtrend. The price has shown signs of rejection from key resistance levels, and the trade is positioned to capitalize on further downside momentum.
2. Target Price:
Target Price: 4241.87
The target level is derived from technical analysis, where price is expected to move toward previous support levels, presenting a logical exit point for profits.
3. Stop Loss:
Stop Loss Price: 4741.37
The stop loss is placed above recent swing highs, ensuring the trade has enough room to breathe while minimizing the risk of false breakouts. This level is a protective measure to ensure that a reversal or unexpected price movement does not lead to unnecessary losses.
4. Risk-to-Reward Ratio:
RRR: The trade has an acceptable risk-to-reward ratio, where the potential reward outweighs the risk by more than 1:1. This is crucial for maintaining profitability over the long term.
5. Trend Analysis:
The market is currently in a bearish phase, as seen in the price action and the overall downtrend. The setup capitalizes on this momentum with a proper risk management strategy.
The use of indicators like moving averages can further confirm the downtrend, though they are not displayed here, they should align with the bearish trend.
6. Volume Confirmation:
The volume should ideally be decreasing during the retracement phase and increase during the move towards the target price, confirming the bearish continuation.
7. Conclusion:
This trade is well-positioned to take advantage of a continuation of the bearish trend. The entry, stop loss, and target are all logically placed based on key price levels and risk management principles. As always, ensure to monitor the trade, and be ready to adjust if market conditions change unexpectedly.

Bullish Position on BCHUSD (Bitcoin Cash/US Dollar)Overview:
This trade setup presents a strong bullish opportunity on BCH/USD, with a clear upward move anticipated based on price action and trendline analysis. The entry point, stop loss, and target are already marked on the chart.
Entry Point: 599.09
The entry is set at 599.09, where the market shows a solid break above the recent resistance level. The bullish move is supported by the trendline breakout and price action, indicating a potential upward continuation.
Stop Loss: 577.34
The stop loss is placed at 577.34, just below the recent swing low, providing a safe distance from any possible market pullback. This ensures we exit the trade in case the market moves against the position.
Target: 625.32
The target is set at 625.32, which is based on the recent resistance level and Fibonacci extension projections. A move towards this target is highly probable if the current bullish momentum continues.
Trade Rationale:
Trendline Breakout: Price has broken a descending trendline (indicated in blue) that has been holding the market in a bearish pattern. This breakout signals a shift in market sentiment, with a potential to ride the bullish wave.
Volume Surge: The recent price surge is supported by increasing volume, which further strengthens the case for continuation of the upward move.
Price Action Confirmation: The price is making higher lows and higher highs, which is characteristic of an uptrend, aligning with the bullish scenario.
Risk/Reward:
The risk-to-reward ratio is 1:1.42, which is a favorable setup for those aiming for a reasonable reward relative to the risk taken.
Conclusion:
This is a well-structured bullish trade setup with a clear entry, stop loss, and target. If the price continues to show strength and remains above the trendline, the trade is likely to hit the target at 625.32. Ensure to monitor the position regularly and adjust the stop loss as necessary to lock in profits if the price moves in your favor.

Bullish Trade Setup for XRP/USD - Pattern CompletionThis is a bullish setup based on a harmonic pattern completing, with the price approaching a key resistance zone. Our entry, stop-loss (SL), and take-profit (TP) levels are clearly marked on the chart.
Entry: 3.0628
The entry point is marked when the price reaches the ideal level for the pattern completion.
Take Profit (TP): 3.1832
This is the target area where the price is expected to move towards, as per the harmonic pattern and previous price action.
Stop Loss (SL): 2.9627
The stop-loss is placed below the low of the last structure to protect from unexpected price movement.
Technical Analysis:
Pattern Identification:
A clear bullish harmonic pattern is visible, with points X, A, B, C, and D forming a potential Bat or Gartley pattern. This type of setup has historically shown a high probability of reversal or continuation at point D.
Price Action Confirmation:
The price has already shown some signs of reversal at point C, with increasing buying volume at the current levels.
The market sentiment is strong, and we are entering at a point where the pattern completion aligns with the overall bullish market structure.
Volume:
There is a noticeable increase in volume as the price approaches the resistance zone (point X), supporting the idea of a bullish breakout.
Risk-to-Reward (RRR):
The setup offers a 1:2.56 RRR, which is well within an acceptable range, ensuring that the potential reward outweighs the risk taken on the trade.
Why This Trade Makes Sense:
Pattern Confirmation: The harmonic pattern is completing, and price action aligns with the expectations of a move higher.
Key Resistance Break: If the price breaks above the marked resistance, this could signify a strong continuation of the bullish trend.
Solid Risk Management: With a well-placed stop loss, the trade is risk-managed while giving the price room to move.
This setup provides a good risk-to-reward ratio and a high probability of success, based on the technical confluence of the harmonic pattern and price action.

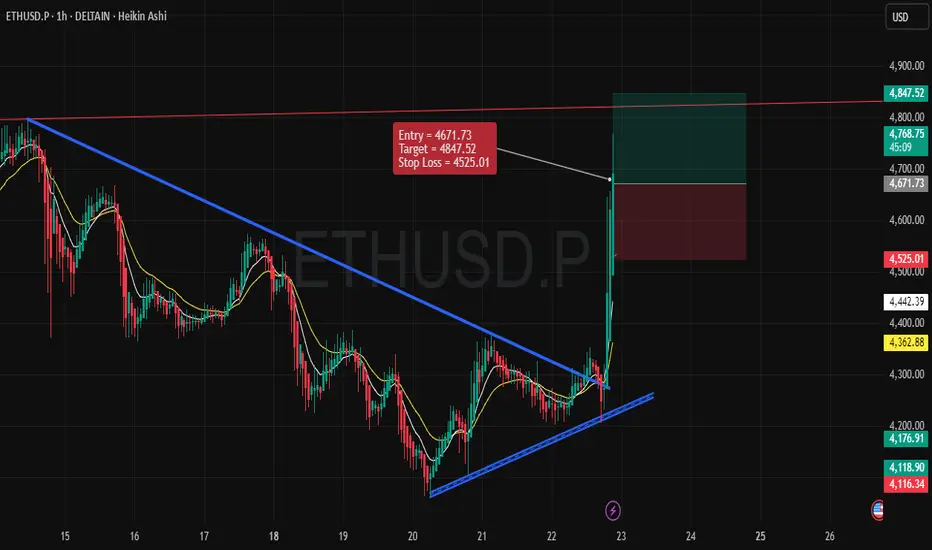
Bullish Scenario for ETH/USD (1-Hour Time Frame)Entry Point: 4671.73
Stop Loss: 4525.01
Target (Take Profit): 4847.52
1. Price Structure and Trend:
The price has been moving within a well-defined downtrend, but there has been a noticeable shift. The recent breakout above the blue trendline signals a potential reversal from a bearish to a bullish trend.
This breakout indicates increased buying interest, suggesting that ETH/USD might continue its upward momentum in the short term.
2. Key Levels:
Support Level: The price has recently bounced off a support zone near 4525, which acts as the stop loss level. A strong bounce from this point further validates the bullish outlook.
Resistance Level: The target price of 4847.52 is placed near a resistance zone, which represents the next major hurdle for ETH/USD.
3. Entry Strategy:
The entry point is placed at 4671.73, just after the breakout above the blue trendline, where the price is gaining upward momentum.
The market seems to have found new buying strength after consolidating, which strengthens the case for a potential move to the target level.
4. Risk-to-Reward Ratio (RRR):
The risk-to-reward ratio for this trade is favorable, with a potential gain of around 175 points (4847.52 - 4671.73) against a risk of approximately 146.72 points (4671.73 - 4525.01). This results in a solid 1:1.2 RRR, which is a reasonable expectation for this bullish trade.
5. Indicators and Confirmation:
The chart features moving averages (yellow and white lines) indicating a shift from a bearish trend to a bullish phase.
The price action shows strong buying pressure, especially with the recent candlestick pattern, confirming the breakout and trend continuation.
6. Conclusion:
With a confirmed breakout, an entry at 4671.73 offers a great opportunity for a bullish move towards the target of 4847.52. The stop loss is safely placed at 4525.01, considering recent support.
This trade setup appears well-aligned with the current market conditions and technical indicators, making it a logical and worthwhile trade idea.
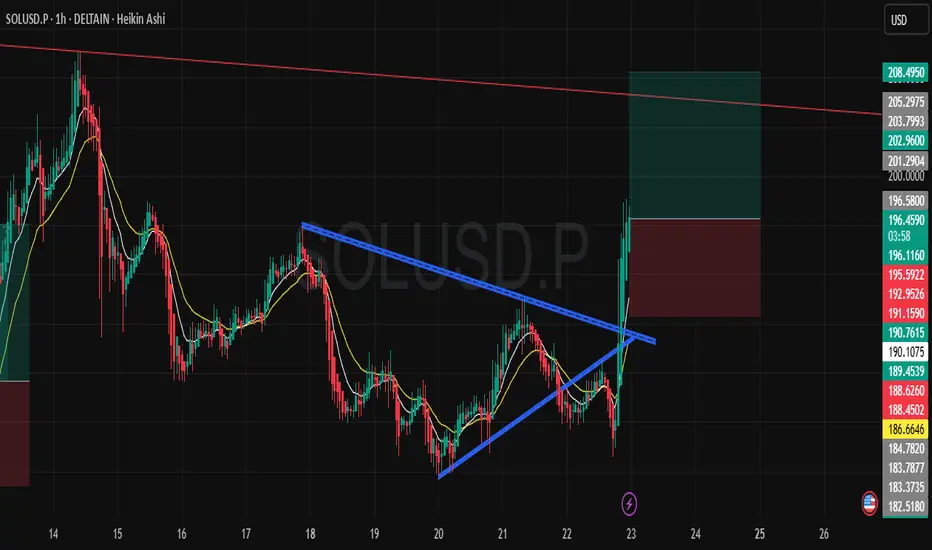
SOL/USDT – Bullish Breakout SetupOn the 1H chart, SOL has broken out of the falling wedge / descending trendline after consolidating for several sessions. The breakout is supported by strong bullish momentum and Heikin Ashi candles showing continuation strength.
Entry: Around current breakout levels (≈196.5)
Stop Loss: 191 (below recent swing low & structure support)
Target: 208 (first major resistance & fib confluence zone)
The risk-reward ratio is favorable, and as long as SOL holds above 191, the bias remains bullish with potential for further upside.
⚠️ This is not financial advice. Please manage risk accordingly.
XRP/USD Trade Setup: Bearish Position on Technical AnalysisTimeframe: 1 Hour
Entry Price: 3.0229
Take Profit (TP): 2.8769
Stop Loss (SL): 3.1199
1. Market Overview
XRP is currently in a bearish phase, and the price action indicates that a downward continuation is likely. The market has been rejecting higher levels, with strong resistance at the 3.1777 zone, and now the price appears to be moving lower.
2. Entry Criteria:
The entry point is set at 3.0229, just below the current price level, where we anticipate the market to continue its downward movement after facing resistance at higher levels.
The recent price action shows a clear rejection from the upside, and we are expecting further downside once the price breaks below the immediate support near the entry.
3. Technical Indicators:
Heikin Ashi Candles: The chart uses Heikin Ashi candles, which help smooth the price action. The red candles indicate a bearish sentiment, confirming the continuation of downward pressure.
Volume Analysis: The increase in volume during the recent selling phase is confirming that the bears are in control and the trend may continue to the downside.
4. Support & Resistance Levels:
Resistance: The price is facing resistance around 3.1777, which has proven to be a significant level of rejection.
Support: The main support zone is located near the 2.8769 level, which coincides with our take profit (TP). This is a logical target as it aligns with previous lower levels and current trend structure.
5. Risk-Reward Ratio:
The Stop Loss is placed at 3.1199, just above the recent swing highs and resistance level, ensuring we limit risk in case of a market reversal.
The Take Profit is set at 2.8769, offering a solid risk-reward ratio of 1:1.5. This level is where we expect the price to find support and potentially reverse after hitting the target.
6. Trade Management:
Monitor Resistance Level: If the price fails to break below the entry and starts moving upward, consider adjusting the stop loss or exiting the position to limit losses.
Trailing Stop: Once the price starts moving in your favor, consider implementing a trailing stop to lock in profits as the price moves lower.
7. Potential Risks:
False Breakdown: A false breakdown is always a risk, where the price could temporarily dip below the support and reverse, hitting the stop loss before continuing lower.
Market Volatility: Be mindful of the inherent volatility in the crypto market, which can lead to sudden reversals due to news or other external factors.
8. Conclusion:
This trade setup is based on a bearish market structure, where price is showing clear resistance and the potential for further downward movement. The setup is logical with a strong risk-reward ratio and a clear target for profits. As always, risk management is crucial, and it's important to monitor price action closely for any signs of reversal.
Good luck, and trade carefully!

M&M Short term Swing trade with 1:3.5 RRIf Nifty holds its current level of 24,600 and is not bearish for next two-three trading sessions then
there are high chances that this setup will work and buyers will take control in M&M.
It is a supply & demand + Trend + Liquidity Trap based setup.
The setup looks good but the only concern is the overall market sentiment so take your risk accordingly.
Good Risk to Reward for first Target is 1:3.5
Let me know if you have any questions or doubts.
Happy to help!
Gaurav.

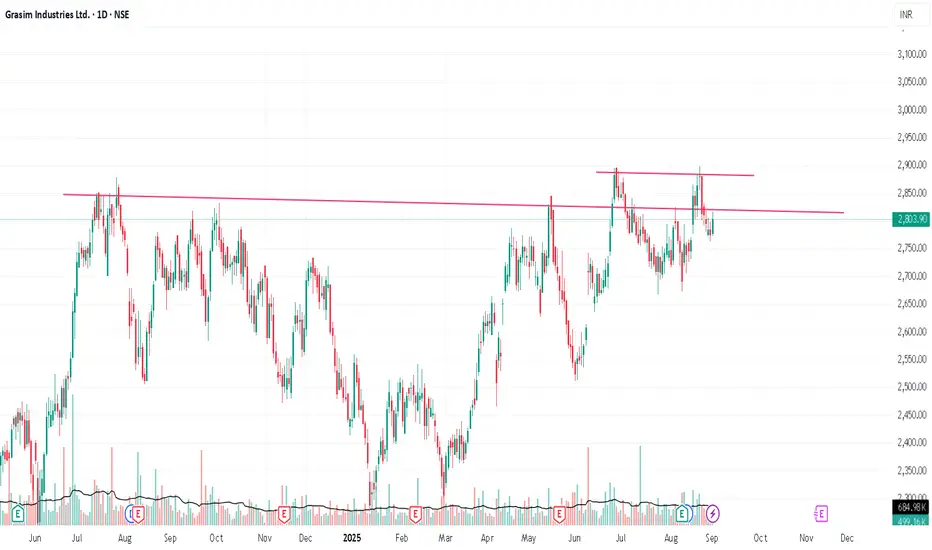
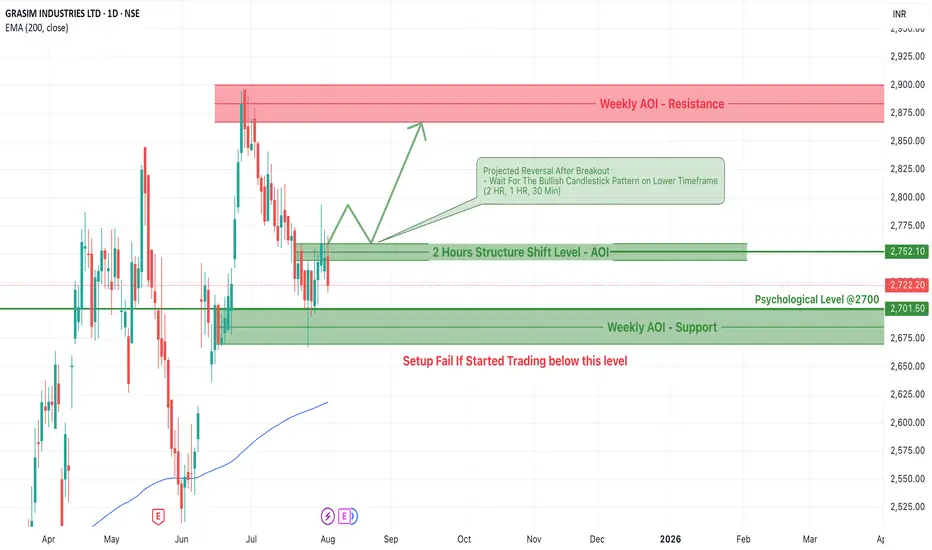
GRASIM Bullish Setup: Key AOI Levels and Reversal Trade PlanGRASIM Industries Ltd is currently forming a potential bullish reversal structure as it approaches a key structural AOI (Area of Interest) zone on the daily chart. This post outlines the complete trade setup, including price action analysis, important zones to monitor, trade plan, and conditions under which the setup could fail.
Key Observations
1. Weekly AOI – Support Zone
Range: Around ₹2,675 to ₹2,701
This green zone represents a strong weekly demand area, acting as a base for potential reversal.
Aligned with the psychological level of ₹2,700, this zone has historically acted as a strong pivot.
2. 2H Structure Shift AOI Zone
Level: ₹2,752.10
This level marks the intraday structure breakout zone on the 2-hour chart.
A successful breakout followed by a retest and bullish candlestick pattern may trigger confirmation for a long position.
Suggested lower timeframes for confirmation: 2HR, 1HR, and 30 Min.
3. Weekly AOI – Resistance Zone
Range: ₹2,875 to ₹2,925
The upside potential is capped at this resistance area, making it an ideal zone for partial or full profit booking.
Trade Plan Breakdown
Projected Move:
Price is currently hovering below the intraday structure shift.
If the price breaks above the ₹2,752 level, traders should wait for a pullback and confirmation in the form of a bullish candle on lower timeframes.
Post-confirmation, an upward move toward the weekly resistance zone is projected.
Entry Strategy
Trigger: Break and retest of the ₹2,752.10 level.
Confirmation: Bullish candlestick pattern (Pin Bar, Engulfing, or Morning Star) on 30 Min – 2HR timeframe.
Stop-Loss: Below the structure AOI or below ₹2,700.
Target 1: ₹2,875 (Near top of Weekly AOI – Resistance)
Target 2: ₹2,900+ (Aggressive target within resistance zone)
Setup Invalidation Level
If the price starts trading below ₹2,700, especially with strong bearish momentum, the setup fails.
In that case, price may revisit lower zones, and traders should refrain from taking long positions.
Technical Confluence
EMA 200 Support: Current price is significantly above the EMA 200 (₹2,618), indicating long-term bullish momentum.
Psychological Level ₹2700: Key psychological round number acting as a magnet and support.
Intraday structure shift: The break of lower timeframe structure adds strength to the setup
Risk Management Guidelines
Position Sizing: Do not risk more than 1-2% of capital per trade.
Wait for Confirmation: Avoid premature entries without bullish candlestick confirmation.
Trail Your Stop-Loss: After price moves into profit zone, trail SL to protect capital.
GRASIM Industries is showing signs of potential reversal and strength near the ₹2,700 zone. The structure shift on the 2-hour chart provides a bullish opportunity, but entry must be cautious and confirmation-based. With a solid risk-to-reward ratio, this could be a textbook breakout-retest trade if conditions align.
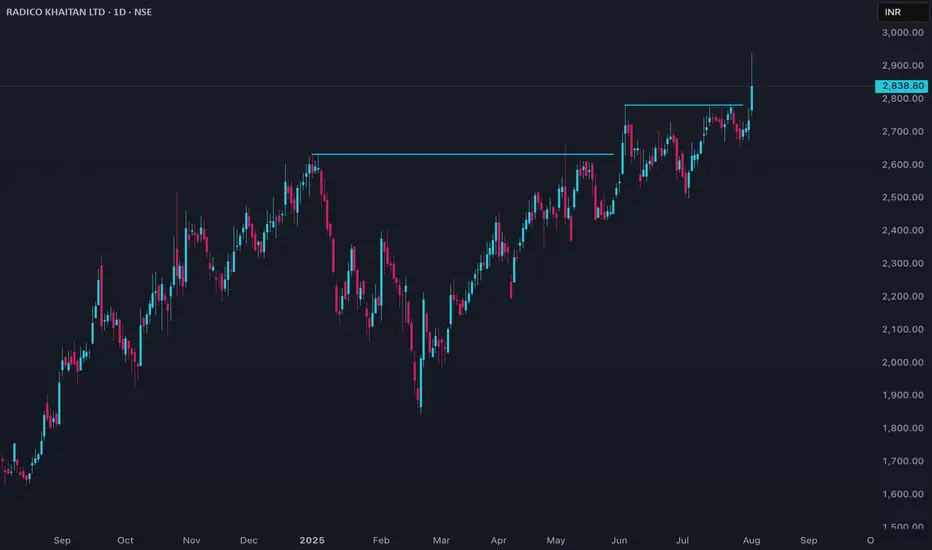
Radico Price ActionRadico Khaitan’s stock is trading around ₹2,840 as of early August 2025, having climbed sharply from about ₹2,700 in July and near ₹2,050 back in February. The share price hit an all-time high at the start of August and has more than doubled over the past 12 months, outperforming its peers in the spirit and beverages sector.
Recent price momentum has been driven by strong financial results: for the quarter ending June 2025, Radico reported net sales of over ₹1,500 crore, a year-on-year increase of more than 32%. Market capitalization is robust and the stock is actively traded, with volumes surging during rally periods. However, valuation is elevated: the price-to-book ratio is around 14 and price-to-earnings is at the high end for its segment, reflecting rich investor expectations.
Operationally, Radico maintains steady margins and has shown above-average revenue growth, consistently launching new premium products and expanding distribution. The company’s return on equity averages about 11–12% over three years, slightly below top FMCG performers but stable.
Technically, the stock is in a strong uptrend, trading well above major moving averages, but may be considered overbought in the very short term after recent rapid gains. Liquidity remains healthy, supporting continued volatility and trading opportunities.
In summary, Radico Khaitan is a high-growth, well-established spirits company with strong recent sales and a share price at historic highs. While fundamentals support continued strength, caution is warranted given expensive valuations and the potential for short-term corrections following such a swift rally.