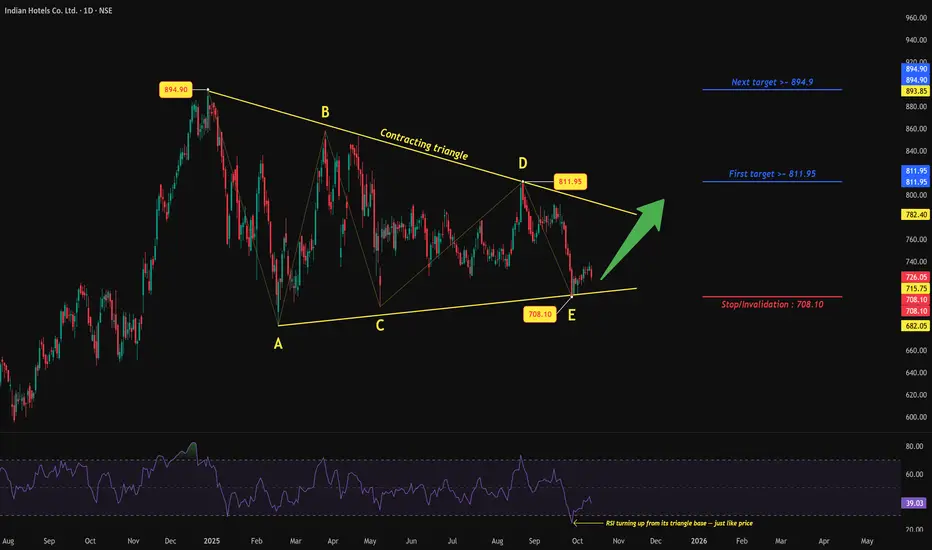
Indian Hotels: Post-Triangle Rally Taking ShapeChart Insight
Price action has been coiling within a clean contracting triangle, with the recent rebound from ₹708.10 likely marking the E-wave low . The broader structure fits neatly as a possible Wave (4) consolidation within the larger uptrend.
Momentum View
RSI has turned higher from the oversold region, mirroring price stability near the triangle base — an early hint that momentum is rebuilding.
Trade View
As long as ₹708.10 holds, a bullish bounce toward ₹811.95 and possibly ₹894.9 remains favored.
A break below ₹708.10, however, would invalidate this setup and point to a deeper correction.
Bias: Bullish — possible Wave (5) breakout from triangle consolidation
Risk Level: Moderate (tight invalidation)
Disclaimer : This analysis is for educational purposes only and does not constitute investment advice. Please do your own research (DYOR) before making any trading decisions.
Triangle
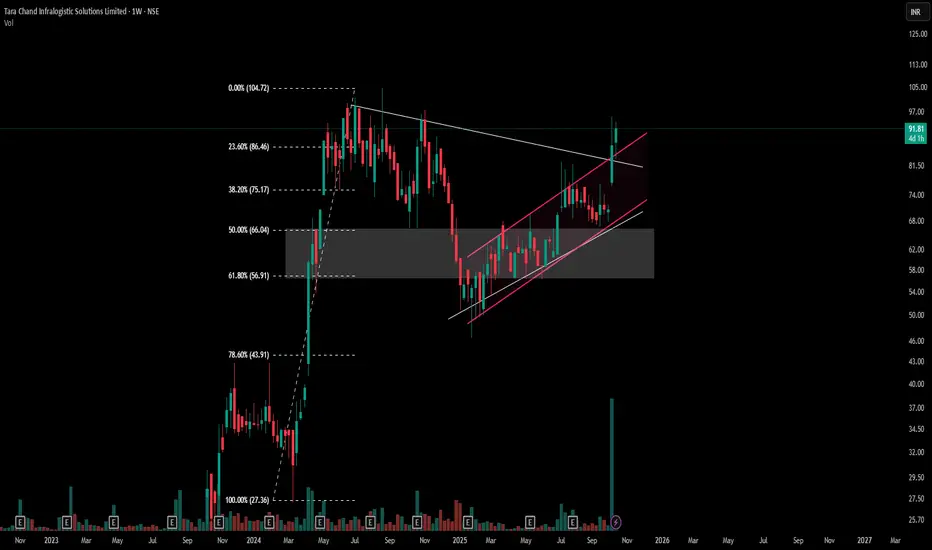
Symmetrical Triangle & Parallel Channel CoexistenceThis weekly chart of Tara Chand Infralogistic Solutions Ltd. serves as a case study in identifying and analyzing overlapping price action structures in 3 Main Points -
1) The chart highlights a well-defined symmetrical triangle pattern, with one white line representing the counter-trendline (CT) and another as the primary trendline (T), illustrating the process of volatility contraction.
2) Overlaid within the triangle, a clearly marked parallel channel (in pink) frames the intermediate price swings during the recent consolidation. The channel illustrates rotational movement within the broader consolidation envelope, mapping the climb and retracement cycles more granularly.
3) Volume, Fibonacci retracement levels, and the shaded value area further reinforce the chart’s impartial focus on structure, without implying directionality. This example serves as a valuable reference for recognizing multi-pattern contexts and appreciating how classical patterns—when viewed together—help decode complex phases of price organization.
- Disclaimer: Trading involves significant risk and is not suitable for all investors. Past performance does not guarantee future results. Always conduct your own research, consider seeking advice from a qualified financial advisor, and trade only with capital you can afford to lose.
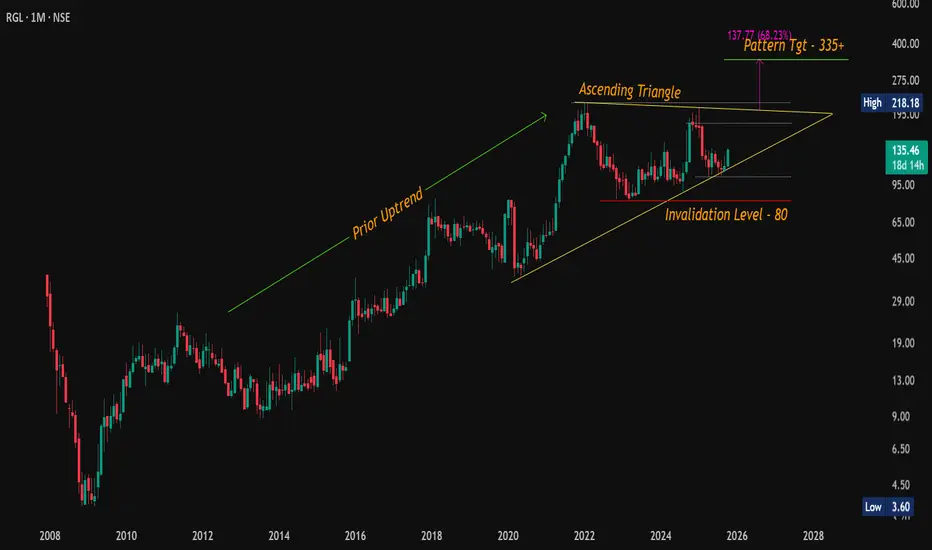
#RGL – Ascending Triangle Breakout Loading?CMP: 135.50
Setting up for a potential bullish breakout with a classic Ascending Triangle pattern on the monthly chart , following a strong prior uptrend.
🔹 Overhead Resistances: 146 / 177 / 207
🔹 Breakout Confirmation Level: 218
🔹 Support Zone: 103 – 99
🔹 Pattern Target: 335+
🔸 ~68% upside from breakout level
🔸 ~150% upside from CMP (135)
📉 Pattern Invalidation Level: 80 MCB
📈 A sustained breakout above 218 (monthly close) may open the gates for a strong move towards 335+. Patience is key on monthly patterns, but reward could be worth the wait.
#RGL | #RenaissanceGlobal | #AscendingTriangle | #ChartPatterns | #LongTerm
📌 Disclaimer: This analysis is shared for educational purposes only. It is not a buy/sell recommendation. Please do your own research before making any trading decisions.
#Nifty | Will Nifty Break Free? Triangle Says Soon!#Nifty Daily Outlook:
CMP: 25,285
Pattern: Symmetrical Triangle ▶️
A Symmetrical Triangle pattern is forming on the daily timeframe , following a strong uptrend , a classic bullish continuation setup .
🟣 Breakout Level: A daily close above the falling trendline from the all-time high (ATH) ( marked in purple ) will confirm the breakout.
🎯 Pattern Target: 26,700
🔒 Pattern Invalidation: Close below 24,337 DCB
Price action is compressing tightly within the triangle, indicating a potential volatility expansion soon.
Breakout confirmation could reignite momentum toward new highs.
✅ Dips into support zones can be used for positioning, with proper risk management.
📌 Support & resistance levels remain the same as shared in the tagged weekly post.
#Nifty | #Nifty50 | #SymmetricalTriangle | #ChartPatterns | #SwingTrading | #PriceAction
📌 Disclaimer: This analysis is shared for educational purposes only. It is not a buy/sell recommendation. Please do your own research before making any trading decisions.

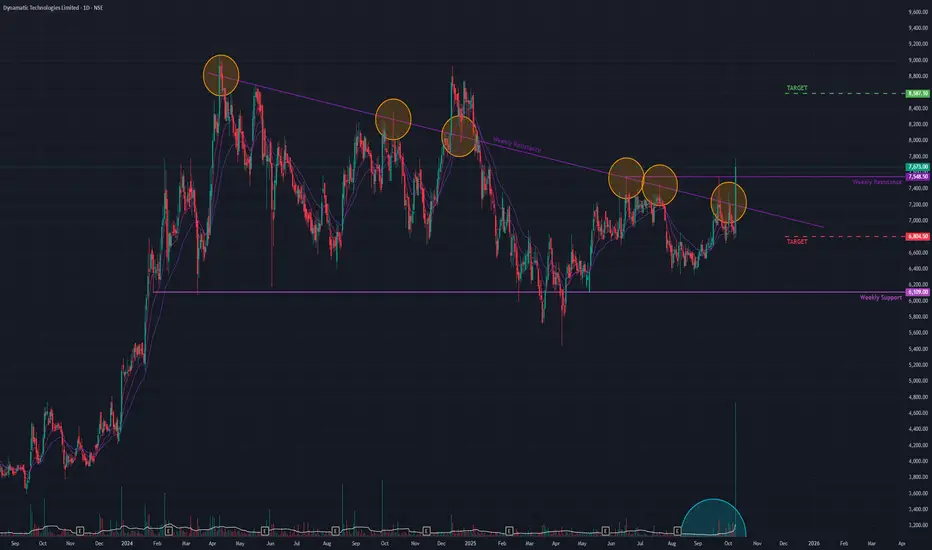
Dynamatic (D) - Double Breakout Signals Trend ContinuationAfter consolidating since its all-time high in April 2024, Dynamatic Technologies has delivered a powerful and technically significant breakout, suggesting its previous uptrend is ready to resume.
The Consolidation Pattern
For the past several months, the stock has been trading within a Triangle Pattern . This is a classic continuation pattern, indicating a pause in the trend rather than a reversal. While there have been several attempts to breach the upper descending trendline of this pattern in the past, all have failed, highlighting the strength of the resistance.
Today's Decisive Breakout
Today's session was exceptionally bullish and stands out from previous attempts for two key reasons:
1. Powerful Surge: The stock surged +12.19% , decisively breaking out of the triangle pattern's angular resistance.
2. Dual Confirmation: Critically, the move also pushed the stock's closing price above a key horizontal resistance level that has been in place since June 2025.
Breaking two distinct and significant resistance levels on the same day provides strong confirmation that this is a genuine breakout, not another "fakeout."
Outlook and Key Levels
With the consolidation phase likely over, the path of least resistance appears to be upward.
- Bullish Target: If this bullish momentum is sustained, the next logical target for the stock is the ₹8,590 level.
- Key Support: Should the momentum fade, the recently breached horizontal resistance near ₹6,800 is now expected to act as the primary support level.
The key confirmation to watch for in the coming days is sustained trading above the breakout zone. A successful retest of this area as support would further validate the bullish outlook.
BlackbuckSymmetrical triangle breakout with 3 rejections on hourly chart. Took an entry at 654 post-confirmation with strong volume support with SL near 645.

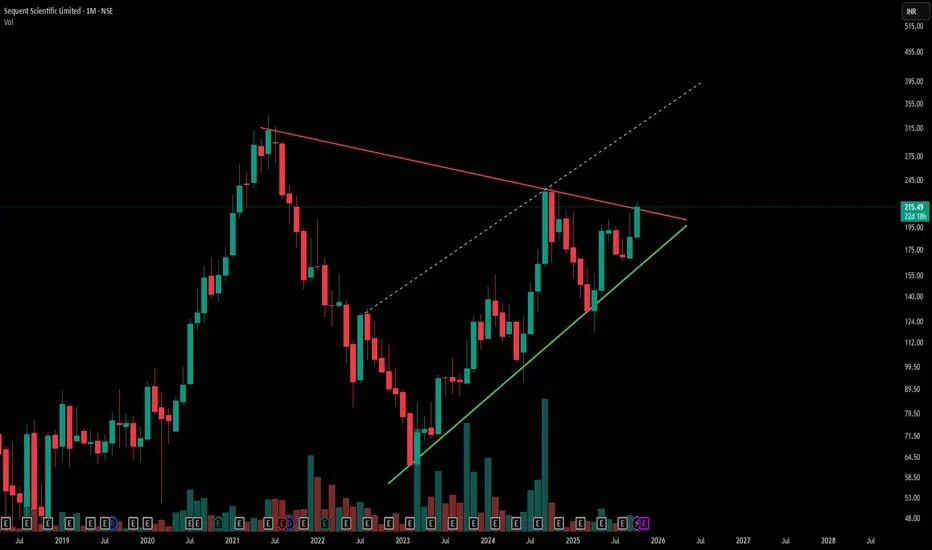
Symmetrical Triangle Breakout Watch | Sequent Scientific-Red line marks a key counter trendline (resistance) from previous swing highs, acting as a short-term ceiling.
-Green line indicates the primary trendline (support) from recent swing lows, showing steady price strength.
-Hidden dashed lines reveal underlying resistance zones, adding complexity to potential breakout levels.
-The overall chart displays a large symmetrical triangle pattern—a classic consolidation setup, Simple .
- Disclaimer: Trading involves significant risk and is not suitable for all investors. Past performance does not guarantee future results. Always conduct your own research, consider seeking advice from a qualified financial advisor, and trade only with capital you can afford to lose.
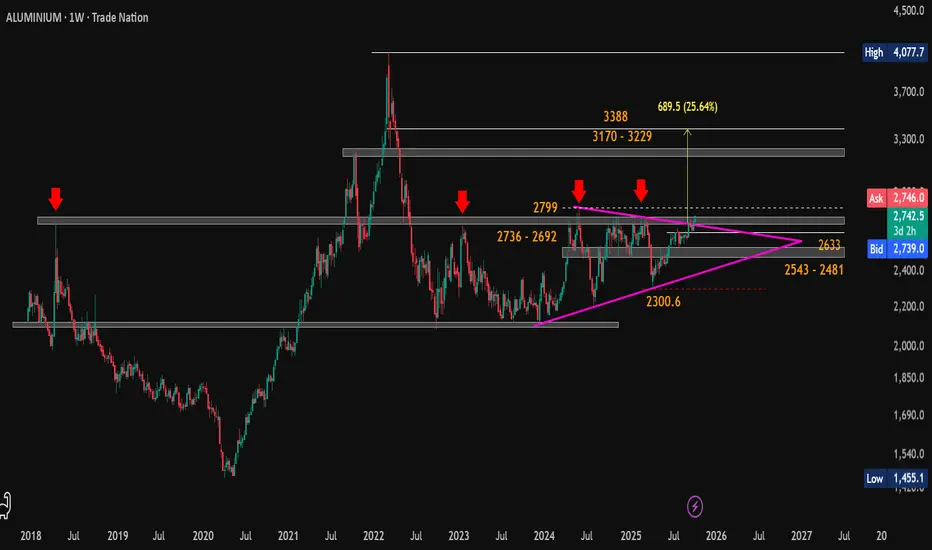
Triangle Breakout Alert: Aluminium Bulls Waking Up?CMP: $2743
Aluminium is breaking out of a symmetrical triangle on weekly timeframe after months of consolidation.
📍 Breakout Zone: $2736 – $2799
📉 Support Levels: $2633 / $2543 – $2481
📈 Resistance Zones: $3170 – $3229, then $3388
🎯 Symmetrical Triangle Pattern Target: ~$3378 (+23% from CMP), which aligns closely with the major resistance zone between $3229 – $3388 .
A weekly close above $2736 – $2799 could support further upside momentum.
If price pulls back within the triangle , dips toward the support zone around $2633 - $2481 may be worth watching for possible reactions.
👀 Watch for price action in the coming weeks, could confirm or invalidate the breakout.
#Commodities | #Aluminium | #BaseMetals | #Breakout | #ChartPattern | #SymmetricalTriangle | #TechnicalAnalysis | #PriceAction
📌 Disclaimer: This analysis is shared for educational purposes only. It is not a buy/sell recommendation. Please do your own research before making any trading decisions.
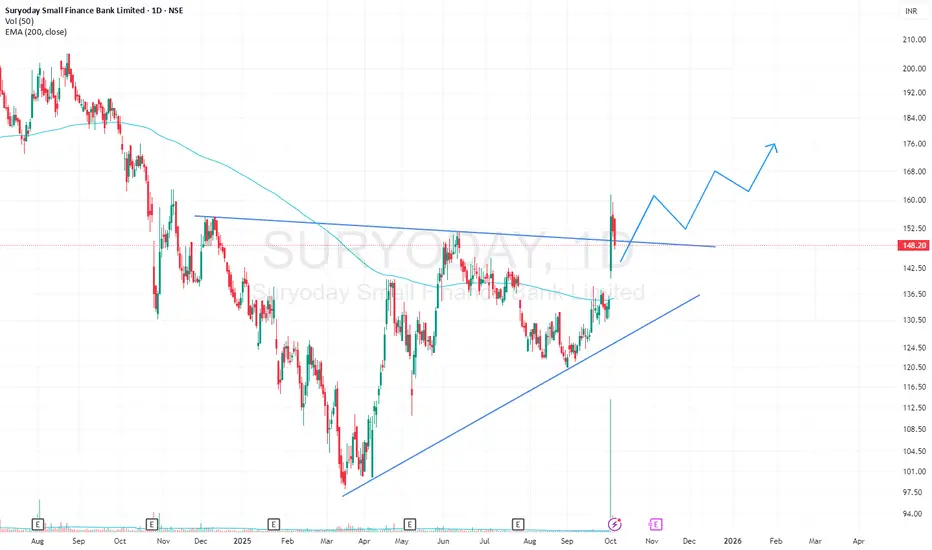
SURYODAY SFB Triangle BreakOutSuryoday SFB has given a breakout from a Triangle pattern with high volumes on 1D timeframe. The stock is apparently retesting its resistance trendline. The stock is also trading above its 200EMA.
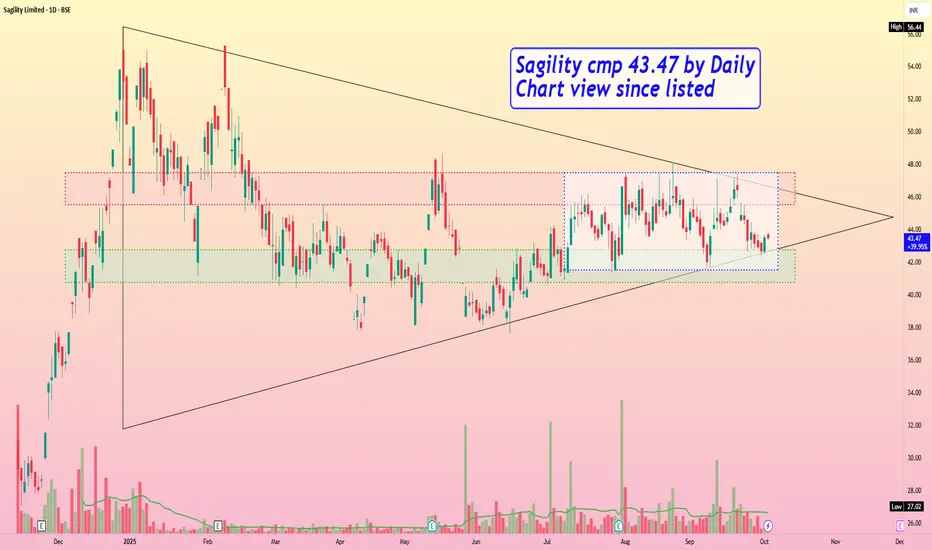
Sagility cmp 43.47 by Daily Chart view since listedSagility cmp 43.47 by Daily Chart view since listed
- Support Zone 40.75 to 42.75 Price Band
- Resistance Zone 45.50 to 47.50 Price Band
- Price traversing inside Symmetrical Triangle pattern
- Support Zone repeatedly tested rested since month of July 2025
- Price trending in Darvas Box range 41.50 to 47.50 and awaiting Breakout
- Price rejection seen by frequent selling pressure at Resistance Zone upper band
- Fresh Breakout possible basis supportive Volumes based closure above 47.50 price level for few days
BEL (Bharat Electronics Ltd) – Technical SetupPattern: Symmetrical Triangle breakout visible on the daily chart.
Breakout Confirmation: Price has moved above the triangle resistance trendline with rising volume.
Targets (Fibonacci-based):
1st Target: ₹435
2nd Target: ₹480
3rd Target: ₹512
Stoploss: ATR-based, below support zone (~₹395–₹400).
---
🔎 Multi-Timeframe Check
Daily: Strong breakout setup with RSI > 60, MACD crossover supportive.
Hourly: Needs sustained close above breakout for confirmation.
Weekly: Still consolidating → needs alignment for a stronger positional view.
---
🌍 Macro Drivers
Sector Theme: Defense + Infrastructure remain in focus.
Policy Tailwind: “Make in India” defense push supportive for long-term growth.
Global Context: Rising defense spending globally adds sentiment support.
---
📝 Reflection / Post Context
"BEL is showing a symmetrical triangle breakout on the daily chart, backed by volume and positive momentum. While hourly/weekly charts are yet to fully align, the macro backdrop of defense and infrastructure support the bullish bias. ATR-based stoploss below ₹400, with upside targets at ₹435, ₹480, and ₹512."


SRFSRF is exhibiting a triangle breakout, supported by a reversal and currently trading above a key support level. The stock has formed a strong bullish candle, indicating positive sentiment.
It's advisable to monitor the next trading session for confirmation of continued upward momentum. If the bullish trend persists, further price appreciation can be expected.
Given the current technical setup, there is a high probability of sustained upward movement. However, to manage risk effectively, implementing a stop-loss strategy remains essential.

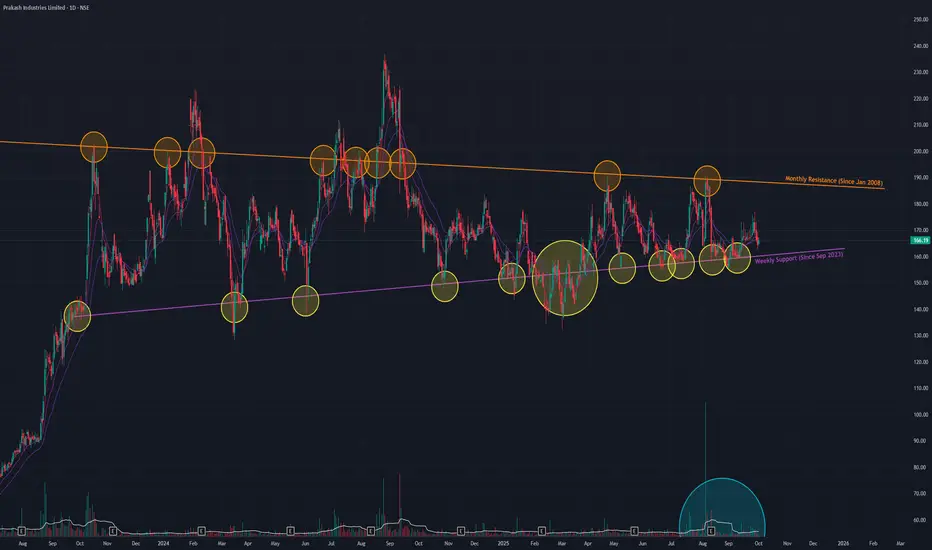
Prakash Ind (D) - Coils in Major Triangle Pattern, Nearing ApexPrakash Industries is currently in a prolonged consolidation phase, trading within a large Triangle pattern that has been forming since September 2023. This pattern typically acts as a continuation of the prior trend, which in this case was a strong uptrend that began in April 2023.
The stock is now approaching the apex of this triangle, suggesting a significant price move could be imminent. The key boundaries to watch are:
- A formidable long-term resistance trendline dating back to January 2008 . This level has triggered several "fake breakouts" in the past.
- A strong support trendline established since September 2023.
Outlook: A Breakout Awaits Confirmation
The stock is likely to remain range-bound in the immediate short term. A decisive move will only occur upon a breakout or breakdown from the existing pattern, which must be confirmed by a significant increase in trading volume.
- Trading Range: Within the current pattern, the stock could oscillate between the upper resistance near ₹187 and the lower support level around ₹160 .
- Breakout Scenario 📈: A sustained breakout above the multi-year resistance on high volume would signal a continuation of the primary uptrend.
- Breakdown Scenario 📉: Conversely, a breakdown below the support trendline would invalidate the bullish continuation thesis and could lead to a significant correction.
AU Bank Ltd 720 Triangle BOAU Bank Ltd 720 dated 18-9-2025
1. Triangle BO @ 722
Buy above 722 SL 700 target 728-735-
740-745-750-755-760
It is just a view, please trade at your own risk.

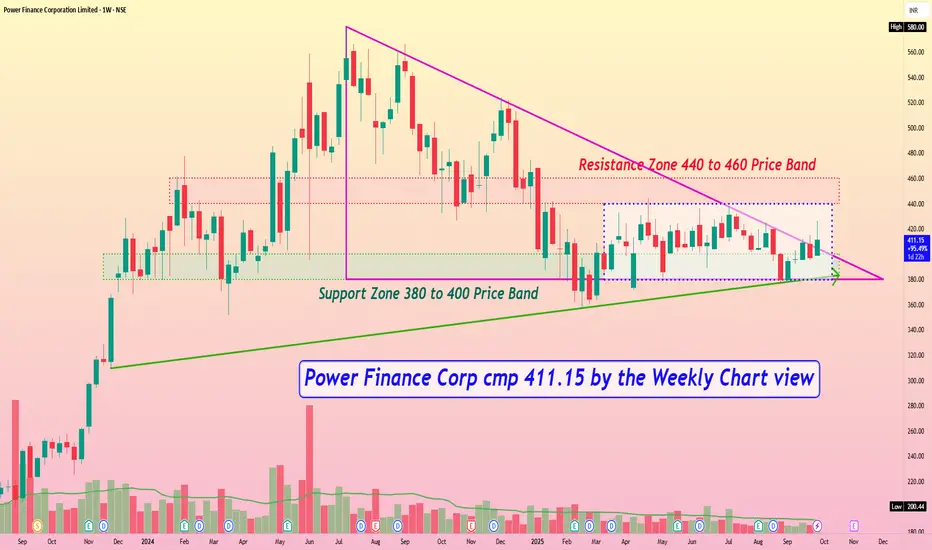
Power Finance Corp cmp 411.15 by the Weekly Chart viewPower Finance Corp cmp 411.15 by the Weekly Chart view
- Support Zone 380 to 400 Price Band
- Resistance Zone 440 to 460 Price Band
- Price traversing within Descending Triangle pattern after ATH
- Rising Support Trendline well respected by touch points since close to 2 years
- Price seen majorly trending inside Darvas Box since Mar 2025 in a range of 380 to 440
- Volumes in close sync with avg traded qty on Daily Chart and in steady stream by Weekly Chart
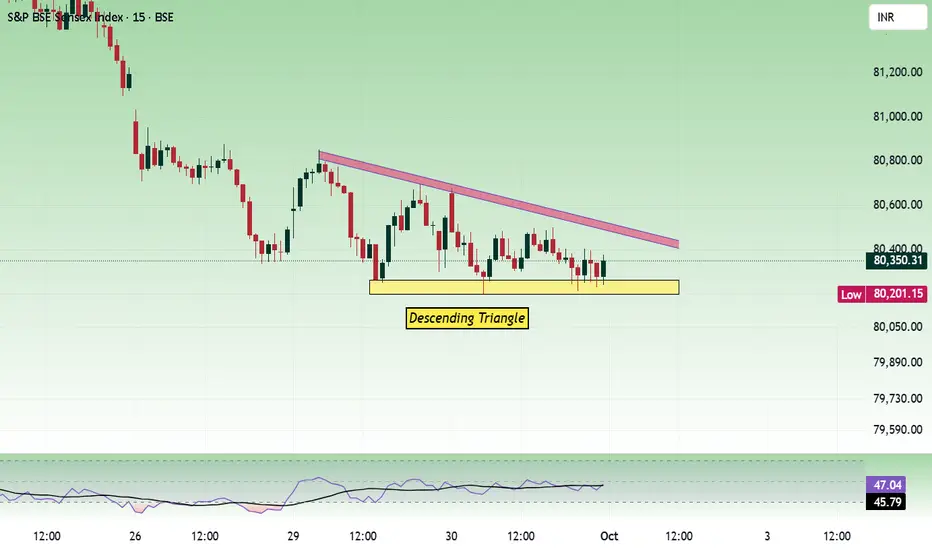
Sensex - Expiry day analysis Oct 1For the past two days, the price has been moving within the range of 80200 to 80800. And today's movement has formed a triangle pattern. Unless the range is broken, the movement can be choppy. Nearby support is seen at 80000. If 80k is broken, the next support is at the 79750 to 79820 zone.
Buy above 80320 with a stop-loss of 80200 for targets of 80400, 80520, 80640, 80760, and 80880.
Sell below 79960 with a stop-loss of 80100 for the targets 79840, 79760, 79640, 79520, 79400, and 79240.
If the price does not gain strength, we can expect a range move between 80k and 80700.
Nifty As per the chart pattern, 24500-24550 is very crucial support zone. Bearish move will persist if Nifty closes below 24500. Next 2-3 days we need to watch carefully. If it reverse from this zone, strong bull case scenario will be there. Trigger point will be RBI policy and earning season

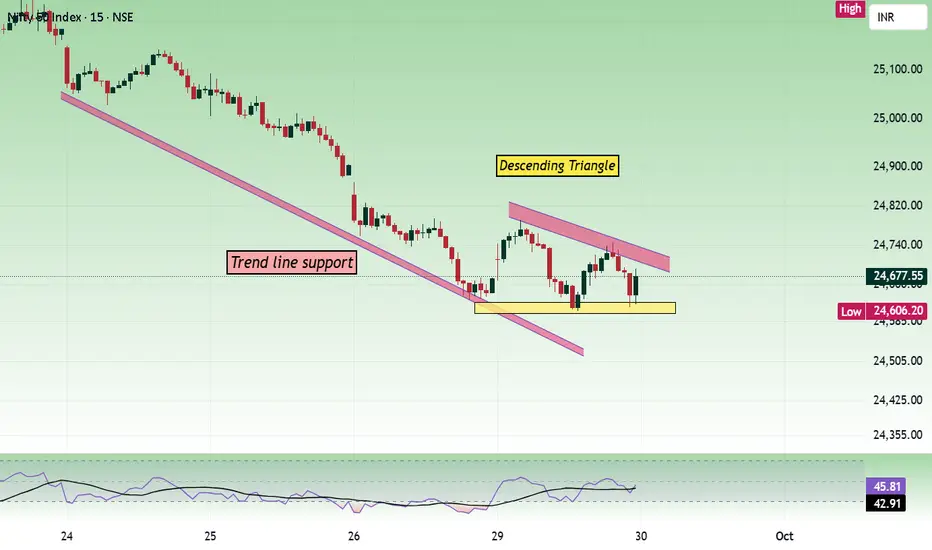
Nifty - Monthly Expiry Day Analysis Sep 30The price was holding the support at the 24600 zone and moved within the range of 24600 to 24800 today, forming a descending triangle in the process. 24600 is the trend direction deciding zone now.
Buy above 24660 with the stop loss of 24610 for the targets 24700, 24740, 24800, 24840, and 24880.
Sell below 24580 with the stop loss of 24620 for the targets 24540, 24500, 24460, 24420, and 24380.
Nearby support is at 24500, and resistance is at 24800. If the price does not gain strength, it will remain within this range of 24500 to 24800.
Expected expiry day range is 24400 to 24900.
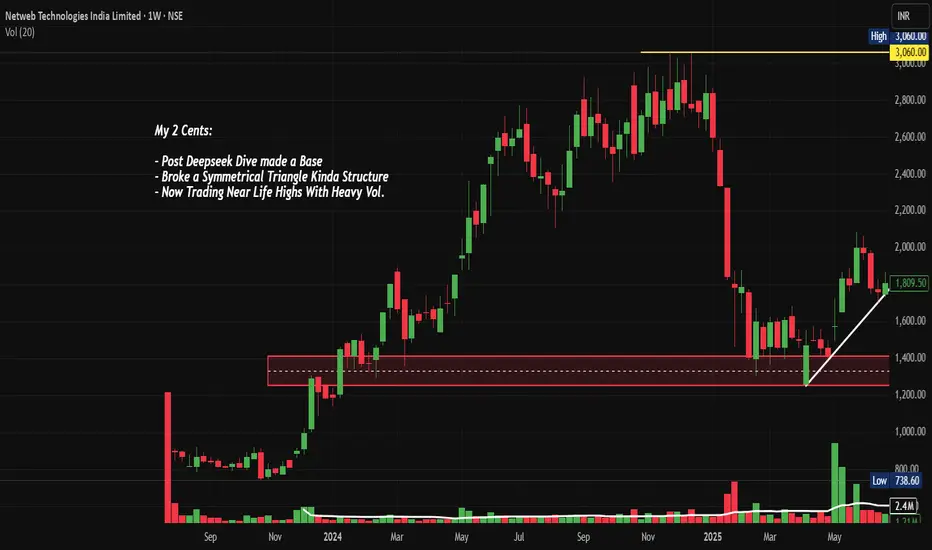
NETWEB: AI Infrastructure Goldmine ? Chart of the MonthNSE:NETWEB MarchingTowards 4,000: Is This the AI Infrastructure Goldmine You've Been Waiting For? Let's analyze in the "Chart of the Month".
As per the Latest SEBI Mandate, this isn't a Trading/Investment RECOMMENDATION nor for Educational Purposes; it is just for Informational purposes only. The chart data used is 3 Months old, as Showing Live Chart Data is not allowed according to the New SEBI Mandate.
Disclaimer: "I am not a SEBI REGISTERED RESEARCH ANALYST AND INVESTMENT ADVISER."
This analysis is intended solely for informational purposes and should not be interpreted as financial advice. It is advisable to consult a qualified financial advisor or conduct thorough research before making investment decisions.
Price Action Analysis:
- Current Price: ₹3,695.40
- 52-Week Range: ₹738.60 - ₹3,745.00
- Recent Performance: +64% gain in a Month with strong momentum
- Price structure shows consistently higher highs and higher lows pattern
- Stock has demonstrated remarkable resilience with a 380% rally from its 52-week low
Volume Spread Analysis:
- Volume surge visible during recent breakout phases
- High volume of 24.25M shares traded, indicating institutional participation
- Volume expansion coinciding with price breakouts confirms genuine buying interest
- Strong volume accumulation during consolidation phases suggests smart money positioning
Chart Patterns Identified:
- Symmetrical Triangle Breakout: Successfully broken above the triangle pattern
- Ascending Triangle: Multiple resistance tests followed by decisive breakout
- Flag and Pennant Patterns: Short-term consolidation after sharp moves
Key Technical Levels:
Support Levels:
- Immediate Support: ₹3,200 (recent consolidation zone)
- Strong Support: ₹2,800 (previous resistance turned support)
- Major Support: ₹2,400 (trendline support and psychological level)
- Critical Support: ₹2,000 (long-term ascending trendline)
Resistance Levels:
- Immediate Resistance: ₹3,745 (52-week high)
- Next Resistance: ₹4,000 (psychological round number)
- Extended Resistance: ₹4,400 (measured move projection)
- Long-term Resistance: ₹5,000
Base Formation:
- Primary Base: ₹1,200-₹1,600 range (established during deep consolidation)
- Secondary Base: ₹2,400-₹2,800 range (recent re-accumulation zone)
- The stock has clearly established a strong foundation above the ₹2,400 levels
Technical Indicators Assessment:
Momentum Indicators:
- RSI is in overbought territory but showing positive divergence
- MACD showing bullish crossover with expanding histogram
- Stochastic indicates strong upward momentum
- ADX suggesting strong trending behaviour
Moving Averages:
- Price trading well above all major moving averages
- 20 EMA, 50 EMA, and 200 EMA in perfect bullish alignment
- Strong uptrend confirmed by ascending moving averages
- No signs of trend reversal in the near term
Sectoral and Fundamental Backdrop:
AI Infrastructure Sector Outlook:
- India's IndiaAI Mission with ₹10,372 crore budget creating massive opportunities
- Government's push for sovereign AI infrastructure benefiting domestic players
- Global demand for AI computing infrastructure is experiencing exponential growth
- Limited domestic competition in the high-end computing solutions space
Company-Specific Fundamentals:
- Netweb's supercomputers have appeared 15 times across three entries in the global Top 500 supercomputers ranking
- The company is almost debt-free with a market cap of ₹20,936 crore
- Recent order wins worth ₹1,734 crore for IndiaAI Mission and ₹450 crore additional order
- Order pipeline of ₹4,142.1 crore as of June 2025, excluding new mandates
Key Growth Catalysts:
- Delivery of servers built on NVIDIA's Blackwell Architecture for India's Sovereign AI System
- Expanding presence in high-performance computing and AI systems
- Strong relationships with global technology partners
- Beneficiary of the government's Digital India and AI initiatives
Financial Performance Metrics:
- Strong revenue visibility from a large order book
- Improving profit margins due to premium product offerings
- Healthy cash flows supporting future expansion
- Zero debt structure providing financial flexibility
Strategic Outlook:
- Expect continued momentum driven by the AI infrastructure theme
- News-driven volatility possible around order execution updates
- Sector rotation into a technology infrastructure play is expected
- Quarterly results will be the key catalyst for sustained momentum
- India's AI infrastructure buildout is a multi-year opportunity
- The company is well-positioned to capture significant market share
Risk Factors to Monitor:
Technical Risks:
- Overbought conditions may lead to profit-taking
- High volatility expected given the stock's momentum
- Any break below ₹3,000 would signal trend weakness
Fundamental Risks:
- Execution risk on large government orders
- Competition from global players in AI infrastructure
- Technology disruption risks in a rapidly evolving sector
- Dependence on government spending cycles
Market Risks:
- Overall market correction could impact high-beta stocks
- Sector rotation away from technology themes
- Global supply chain disruptions affecting component availability
My 2 Cents:
NSE:NETWEB presents a compelling technical setup with strong fundamental support from India's push for AI infrastructure. The stock's breakout from multiple chart patterns, combined with substantial order wins and sector tailwinds, creates an attractive risk-reward proposition. However, position sizing and disciplined risk management remain crucial given the stock's high volatility and premium valuation.
Full Coverage on my Newsletter this Week
Keep in the Watchlist and DOYR.
NO RECO. For Buy/Sell.
📌Thank you for exploring my idea! I hope you found it valuable.
🙏FOLLOW for more
👍BOOST if you found it useful.
✍️COMMENT below with your views.
Meanwhile, check out my other stock ideas on the right side until this trade is activated. I would love your feedback.
As per the Latest SEBI Mandate, this isn't a Trading/Investment RECOMMENDATION nor for Educational Purposes; it is just for Informational purposes only. The chart data used is 3 Months old, as Showing Live Chart Data is not allowed according to the New SEBI Mandate.
Disclaimer: "I am not a SEBI REGISTERED RESEARCH ANALYST AND INVESTMENT ADVISER."
This analysis is intended solely for informational purposes and should not be interpreted as financial advice. It is advisable to consult a qualified financial advisor or conduct thorough research before making investment decisions.
Silver Bullish Breakout on Monthly & Weekly CharPattern Formed: Symmetrical Triangle (Long-Term Consolidation)
Breakout Type: Bullish Breakout on Monthly & Weekly Chart
Volume Confirmation: Strength in breakout with price expansion
Measured Move Target: ~$44 (based on triangle height projection)
Immediate Resistance Zone: $44.11 (Historical supply zone)
Support Levels Post-Breakout:
Immediate Support: $34.78
Strong Support: $33.28

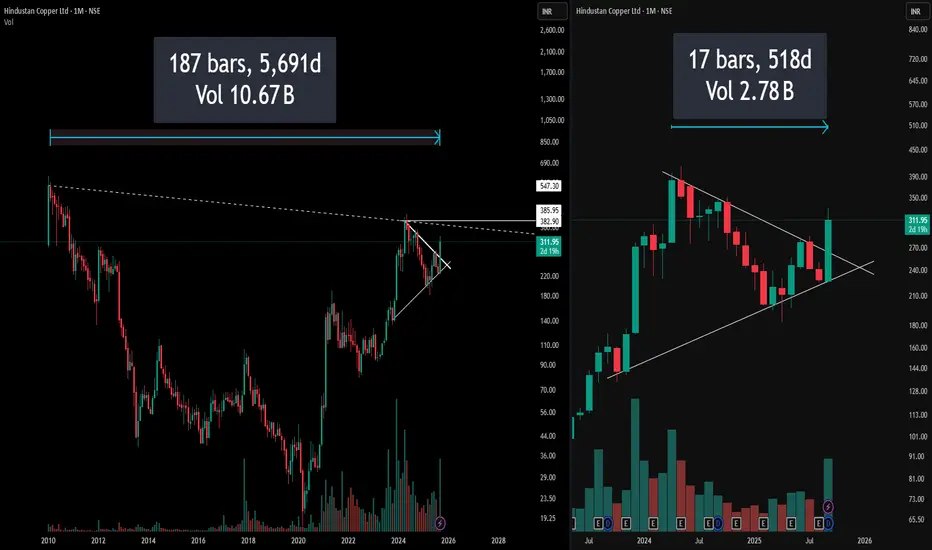
5000 Days vs 500 Days of Data : Which is better ?Most traders jump straight into attractive chart patterns and impulsively take trades, ignoring the bigger picture. Here’s a powerful case study
Left Side: Full Monthly Chart with Hidden Resistance
On the left, the chart captures over a decade of price action, immediately drawing attention to a long-standing downward-sloping resistance stretching from all-time highs. This hidden resistance line is not visible on the usual zoomed-in view, yet it presents a formidable barrier that traders often neglect.
(Pro Insight: Always extend trendlines and resistance zones till the inception of the instrument for real swing perspective)
(Risk Reminder: What looks like a clear breakout on a recent timeframe may actually be approaching a multi-year resistance trap)
Right Side: Symmetrical Triangle – The Pattern Focus
The right segment restricts focus to the last few years, zooming in on a visually perfect symmetrical triangle. While the setup looks neat and promising—indicating contraction and likely expansion ahead—this trimmed view risks obscuring the bigger, hidden resistance directly overhead.
Disclaimer: This post reflects technical views for educational purposes only, not investment advice. Always perform your own due diligence before trading.
SCHWSCHW has recently delivered a Triangle Pattern breakout within the context of a long-term parallel channel that has been forming over several years. This convergence of patterns suggests a potential shift in momentum and a likely resumption of the broader trend.
The breakout from the triangle indicates emerging bullish sentiment, but a decisive breakout above the 2-year high is still pending. This level is a critical resistance, and once breached, it could confirm the breakout’s strength and initiate a more sustainable upward move.
Following such a breakout, a retest of the breakout zone would be a healthy technical development and could provide an ideal entry point for long-term investors.
Looking ahead, if the breakout holds and the stock maintains its trajectory, SCHW may attempt to reach the upper boundary of the outer parallel channel over the next 2–3 years, offering a favorable risk-reward setup for position traders and long-term investors.
Summary:
Pattern Identified: Triangle breakout within a long-term parallel channel
Key Resistance: 2-year high (yet to be broken)
Potential Entry: On breakout and subsequent retest
Medium/Long-Term Target: Upper edge of the outer parallel channel
Outlook: Bullish with long-term growth potential over 2–3 years
