Muthoot finance uptrend stocks Muthoot finance id good In this Sector. That's good fundamentals company'. It's in uptrend in 45Min chart . It's taking support at every fall. It's going up with ema.
We can take Position with SL. U can easily book 3 -5% in this stock .keep SL of 3 -5%. Means 1 :1 R :R. THEN trial SL .
Uptrending

Buy Mankind Pharma for 15% short term Mankind Pharma
Take entry Near 2600Rs
Target will be 3055( almost 16% upside)
Invest more at 2477
Mankind look likes very bullish
Double bottom pattern perform on up trendline.

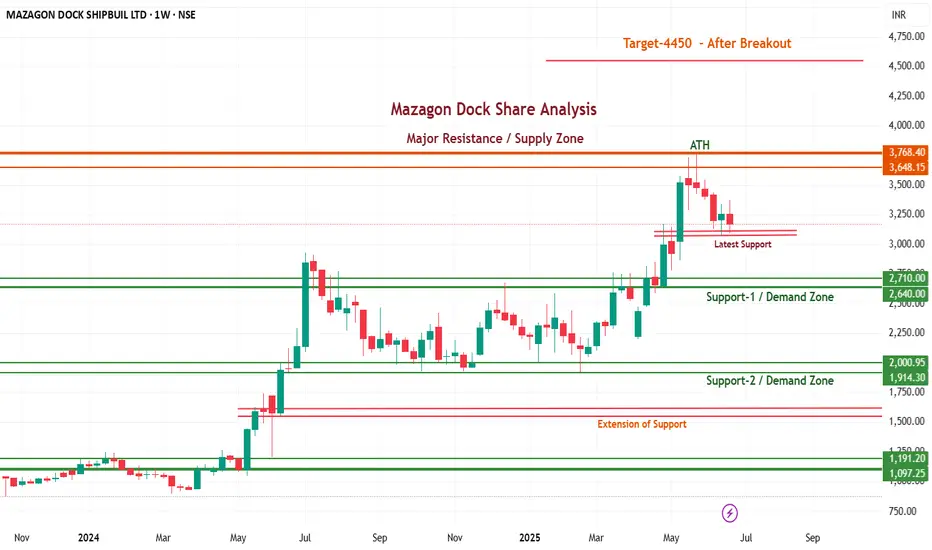
Mazagon Dock Share Price Analysis: Strong Technical Levels
Demand Zones – Ideal for Long-Term Investors
Demand zones are crucial areas where buying interest is strong, often due to institutional or big investor activity. Mazagon Dock has two well-marked demand zones:
Support-1 / Demand Zone: ₹2,640 – ₹2,710
Support-2 / Demand Zone: ₹1,914 – ₹2,000
Strategy: Long-term investors should look to accumulate or add quantity near these zones, especially if the stock sees a pullback. Historically, the price has shown strong reversal signals from these areas.
Latest Support – Swing Traders’ Focus
Current Swing Support: Around ₹3,100
This zone is crucial for swing traders. If the price holds this level and forms a bullish candle pattern, short-term upward movement may follow. However, a breakdown could lead to testing lower demand zones.
Supply Zone – Major Resistance for Breakout
Major Supply Zone: ₹3,648 – ₹3,768 (also near ATH – All-Time High)
This zone is where profit booking usually happens. Big investors often exit partial holdings near this level, awaiting a strong breakout confirmation. A successful breakout above ₹3,768 can initiate a move toward the next target of ₹4,450.
Extension of Support – Trap or Opportunity?
Levels: ₹1,400 – ₹1,500
In many cases, stocks break demand zones and trap retailers in a false breakdown. This zone is often used by smart money to accumulate quietly. A bounce from this level is a possible re-entry opportunity post-fake breakdown.
What’s the News?
Mazagon Dock has acquired a controlling stake in Colombo Dockyard (Sri Lanka) for ₹452 crore. This marks the company’s first major international acquisition, opening doors for cross-border defense and commercial shipbuilding collaboration.
Mazagon Dock’s strong technical structure and strategic international acquisition position it as a powerful stock for both investors and swing traders.
Stay Ahead in the Market!
If you found this analysis helpful, don’t forget to like, comment, and follow for more such chart updates.
Want regular updates on support/resistance zones, breakouts, and swing trading setups? Save this chart and turn on notifications.- Gift a TradingView Subscription
Polygon long-term analysis, Total potential profit +416% ROIPolygon is currently supported and trading within a channel pattern. The first target is the top of this channel, offering a potential profit of +79% ROI. A breakout above the channel could lead to a second target of $1.56 USD, with a potential profit of +179% ROI. If the market closes above this second target, a significant price movement in Polygon is expected. The third target of this analysis is $2.8900 USD, offering a total potential profit of +416% ROI. This is a long-term analysis, and it's essential to follow trend continuation techniques. This presents a significant opportunity, good luck!
MLong

Bangkok Bank, Next Target is the Channel TOP, Gain +78% PROFITBangkok Bank has been Trading within a Channel Pattern for the past 24 years. A Rising Wedge Pattern formed within the Channel, and last year, it Breakout of the Wedge Pattern and Reached its Target. The market is now continuing its Uptrend, with the NEXT TARGET being the Top of the Channel Pattern, around 280 THB, although this may vary depending on the timing.
Take advantage of this Great Opportunity to Earn a Potential Profit of +78% ROI. As this is a Long-Term Analysis, it's important to follow Trend continuation techniques.
I want to help People to Make Profit all over the "World".

VISHNU - 1.5 Years Downtrend Breakout Vishnu Chemicals Ltd
1) Time Frame - Daily.
2) The Stock has been in a Downtrend since (September, 2022). Now It has given a Downtrend / Consolidation breakout & Closed with good volume & good bullish momentum candle in Daily Time Frame.
3) The next resistance would be it's Previous Life Time High (434 - 16.60% from the price 372.10).
4) Recommendation - Strong Buy .

EPACK - 5 Months Downtrend Breakout Epack Durable Ltd
1) Time Frame - Daily.
2) The Stock has been in a Downtrend since (January, 2024). Now It has given Downtrend breakout & Closed with good volume & good bullish momentum candle in Daily Time Frame.
3) The next resistance would be It's Previous Life Time High (224.50 - 8.90% from the price 206.10).
4) Recommendation - Strong Buy.

Analysis 1) stock at up trend momentum
2) 96 is the resistance level for the stock
3) this up trend supported by volume
4) volume building like mountains
5) 2022 APR "55-60" this zone act as resistance for the stock
6) after this breakout stock give 68% rally
7) 68% rally with in one months likely 22 sessions
8) same move can accepting from this stock
9) crossing sentimental and main resistance for the stock and must sustain above
10) stock give 25% move from present level
11) no recommendation for buy and sell

SPANDANA - Will Uptrend Continues ?Detailed View about this Breakout:
Consolidation days : 175+ days
I Post educational chart for 3 Swing / Potential Stocks Everyday.
Check Related Ideas section for more Swing Stock analysis.

Shilpa Medicare Showing signs of recovery1. Buy or Sell at your own risk
2. Don't risk more than 1%-2% of your capital as stop loss
3. Position Size formula: - Stop Loss Amount/(Buy Price - Initial Stop Loss Price)
4. Sell on initial Stop Loss hit or RSI close below 40
5. Some other ways to sell stocks can be
a. 25% or 50% up in three weeks or less
b. Weekly tailing tops with high volume
c. Exhaustion gaps
d. Heavy daily volume without further upside
e. Largest one day price drop
After a long downtrend since July 2021, NSE:SHILPAMED is now showing signs of recovery. It's a buy with a stop at ₹244
Disclaimer: I am not SEBI Registered. Do trade or invest at your own risk, I am not responsible for any losses and won't claim anything from your profits either. Take financial advice from your advisors before jumping in.

trendline Trading: SudarshanNSE:SUDARSCHEM is again taking the support at the monthly timeframe trendline.

SAIL - SWING TRADING - 21.07.2022 - BAHAVAN CAPITALSAIL Above 74 for a Target 112.
As per the Below Data
18.07.2022 FII Net Holding 156.08 Cr DII Net Selling 844.33 Cr
19.07.2022 FII Net Holding 976. 40 Cr DII Net Selling 100.73 Cr
I Anticipated FII Participation to increase and stock to move uptrend as per my post on 19.07.2022 and indeed its good to see FII everyday increased holding.
20.07.2022 FII Net Holding 1780.94 Cr DII Net Selling 230.22 Cr
21.07.2022 FII Net Holding 1799.32 Cr DII Net Selling 312.29 Cr
I only Share my opinions on the shares which i will buy and not for the sake of only publishing and not entering in any stock. Sail had crossed above 74 and Iam holding Sail as per my own buy call.
Happy Profitable Trading to All.

Zodiac Clothing looks Technically PromisingZodiac Clothing successfully broke out an Inverse H&S pattern in the last trading session. Buy the stock above 113 with SL 107 with a target of 130 within one to 4 weeks

GOOD DOUBLE BOTTOM Forming GOOD Double Bottom and Strong Support @ 1.30000 - 1.30200...
Good Buy Now & SL @ 1.29800 Level
MAKE USE OF IT ...ITS A GOOD BOTTOM

EURUSD GOING UP ON DAILY BASES EURO IS STILL GOING UP BUT WE NEED WAIT FOR OPENING LONGER POSITION OUR TARGET IS THE RESISTANCE 1.21700 IF IT BRAKE THEN WE SEE A NEW TREND TO UPSIDE AND IF THERE IS ANY HUGE SELL HAPPEN THEN OUR TARGET IS 1.20900.
Don't Forget to comment to share your opinion.

Uptrend Continuation- Triveni EngineeringHello all,
I am here again with one more strong stock. The purpose is not to give you any call but to make you learn how to analyze a stock:)
The stock after giving a good uprun, went into correction mode. Interestingly, it formed a rounding bottom during this price as well as time correction. The volumes as you can see were almost dead during the declining phase of the rounding bottom while the volumes shot up as the stock moved towards the completion of the pattern.
Today, it has finally broken the previous high created on 6th July with volumes. An entry at this point would give a good RR.
SL can be kept at previous pull back which is around 192 (see on line chart).
Takeaways:
1) Develop your eyes to see any pattern formation.
2) Keenly observe the price action. (in this case, the price correction from 6th July to 28th Sept was covered by just three green bars).
3) Focus on volumes as well with price.
4) Also observe the previous trend (in this case the stock is in a strong uptrend and is hence likely to continue it's journey)
I hope you will all reflect on this analysis and learn.
Do share your feedback/suggestions/advice with me in the comments section:)
Happy Trading!

First Source Solution : A hidden gemFundamental Aspect:
First Source Solution is an IT company and has a decent market cap. The stock has been witnessing a huge volume since June. Just compare the size of red vol candles vs the green vol candles. FII's increased their shareholding in June quarter and promoter pledging is zero.
The debt to equity ratio is low. Also, the result season is around the corner and going by the previous quarters sales record the company is expected to do well.
Technical Aspect:
The stock is in momentum and after a sharp upside rally made a 28% correction from the high. It now seems to be ready for the next leg. Hovering at a crucial point, a sustainable break above this level would lead the stock towards next rally.
It is a positional bet.
Like I always say, read out the description to learn and not just to follow it blindly. Just look at the pointers mentioned while analysing this stock and start thinking on similar terms:) Trust me, this is the best way to learn.
The plan is to make everybody independent and not dependent:)

SIMPLE AND EFFECTIVE TRADE SETUP ON VARUN BEVERAGESFew pointers about my analysis of VARUN BEVERAGES :
1.The stock has been in a continuous uptrend with lots of bullish continuation patterns ,which is good for healthy upward trend, higher the no. of valid patterns better it is.
2.The stock just broke out of an ascending triangle pattern , which is again is a continuation pattern.
3.Volume spurt : breakout supported by decent volumes, supporting bullishness.
4.RSI breakout on daily chart and trading above 60.
Short term view : Bullish
Timeframe used : Daily
Target : Use trailing SL or 50day MA
Take away: entry has not yet been triggered , ideally one should wait for retest to enter.
Disclaimer : This idea was to just give you an insight about my own view and personal observations. Please do your own research or consult an investment advisor before doing any investment or trading.

Why I am bullish on Airtel - Macro trend analysisThis is a long-term analysis for the telecommunications giant - Bharti Airtel .
There are two primary market trends in the broad perspective :
1. Uptrend/downtrend
2. Accumulation/ Distribution.
The accumulation phase is the boring phase , when smart investors accumulate positions and get in early. the uptrend/mark-up phase is the euphoria phase when the retail market participation increases, indicated by surge in volume, and smart investors slowly start unloading their positions, until the uptrend momentum has subsided, followed by a new accumulation phase and another possible mark-up, or a distribution phase followed by a downtrend, which is also known as a bear market. Till the time price has moved away from the range it has been trading in, we do not know whether the range is accumulative or distributive in nature.
As you can see in the chart, Bharti Airtel has been in an accumulation range for more than 10 years, and it seems as though we have finally successfully managed to break away from the range to the upside. The longer a stock has been in accumulation, the stronger the momentum once price breaks away from the range.
Let us see a stock that has done something similar. It is none other than, Reliance Industries .
You can clearly see how quickly the trend progressed after leaving the accumulation range.
Key takeaway points from the analysis and comparison
1. Airtel has been range bound for a longer period of time as compared to Reliance. This implies that Airtel has spent more time in the accumulation phase.
2. Airtel broke out of the range in early 2020, but threatened to fall back into the range, only to deviate back above and hold the range-high as support for several months. Deviation and reclaim as support is considered a strong bullish sign, indicating that buyers are stepping in to defend the range high as support.
3. Reliance never back-tested its range high as support before its second mark-up phase. Airtel back-testing range high as support is giving buyers more confidence that the stock is ready for price-discovery mode.
4. Volume analysis - Airtel has a better volume profile, with depleting low volume during accumulation phase and a surge in volume upon breakout attempt, and is showing continued volume strength. This setup was not seen in Reliance.
Conclusion
With this we can conclude that Airtel is giving us a nice bullish setup for a long term trend change shift and tackling new all time highs. The Indian stock market has been in a bull run ever since the year 2000, with corrections along the way (two major corrections in 2008 and 2020). As long as this macro bullish structure of the Indian market continues, we can expect Bharti Airtel to perform strongly in the coming years and have a similar run up as compared to Reliance Industries.
Thank you. Do leave a like/comment if you enjoyed the analysis.
Note: This is not financial advise. It is for educational/entertainment purposes only

MPHASIS LONGASCENDING TRIANGLE formation , making higher lows.
prior uptrend established.
breakout above 2760 and view invalid if it breaks the trendline as well as the horizontal green area of support.

Glenmark - Uptrend breakout tradePrice breaks the pattern and reached the top to break the trend line. Its completely in uptrend - buy on lows !!!

GUJALKALIES | DESCENDING TRENDLINE BREAKOUTGUJALKALIES has break out the trendline resistance.
Upside Target- 480
Entry Around- 450
Stop Loss- 400
Timeframe: Positional View

MPHASIS TRENDLINE BREAKOUT- 15MINSBUY MPHASIS AROUND- 2060
BUY TARGET- 2130
INTRADAY VIEW
MPHASIS HAS BREAKEN OUT TRENDLINE IN 15MINS TIME FRAME.
