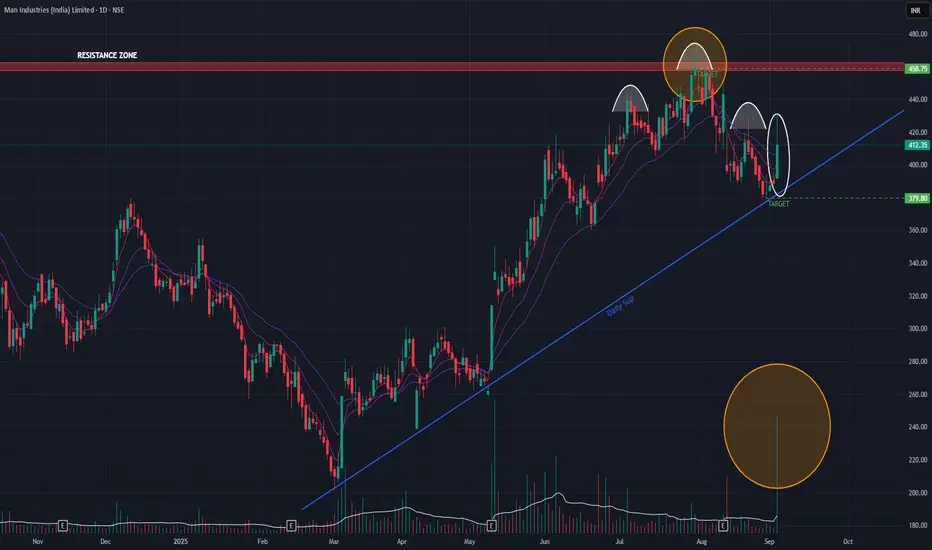
Man Industries (Daily Timeframe) - Upside or Downside??Man industries has been on an uptrend since March 03, 2025 and it tried to BreakOut of the key resistance zone, but invain. Today the stock gained 6% with huge volume. Since March 03, 2025, the stock has been respecting the angular support trendline while making Higher Lows. If we observe carefully, an H&S pattern is formed at the top which indicates a bearish trend. Short-term EMAs are also in Negative Cross-over state.
If the stock gains momentum on the upside, then it may rise to the range of 458. On the downside, the stock may reach the immediate support of 379.
To monitor.
Volumespike
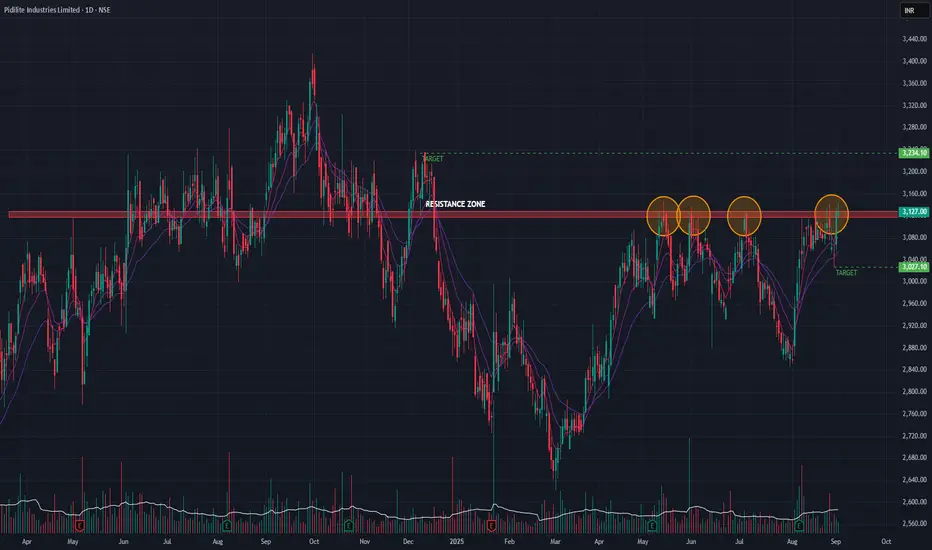
Pidilite Industries (Daily Timeframe) - Potential BreakOut??Pidilite, though with good earnings in the past quarter has not been able to BreakOut of the support turned resistance zone. Few attempts has been made but none of them were successful. The recent past, the stock has been making Equal Highs and Higher Lows. Volume has been decent though. Short-term EMAs are in Positive Cross-Over state.
On upside, the target may be around 3234 & on downside it may go upto 3027.
Monitor the price action in the coming days.
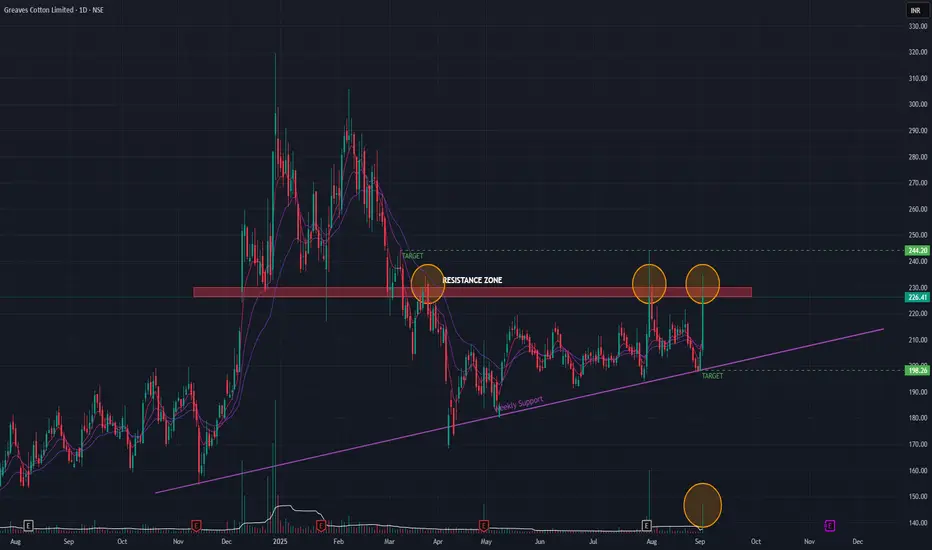
Greaves Cotton (Daily Timeframe) - Will it BreakOut or Not?Greaves Cotton since it's Double-Top formation has been in a downtrend. A key support level has become a resistance zone, which it's been trying to BreakOut few times. The stock has been forming Higher Lows for a while now. Few attempts to BreakOut has been futile. The recent BreakOut attempts been with huge volume spikes. Short-term EMAs are in positive cross-over state.
If it's able to BreakOut then the possible upside target is around 244. If not, we can expect the stock to go down to 198 levels.
Keep monitoring.
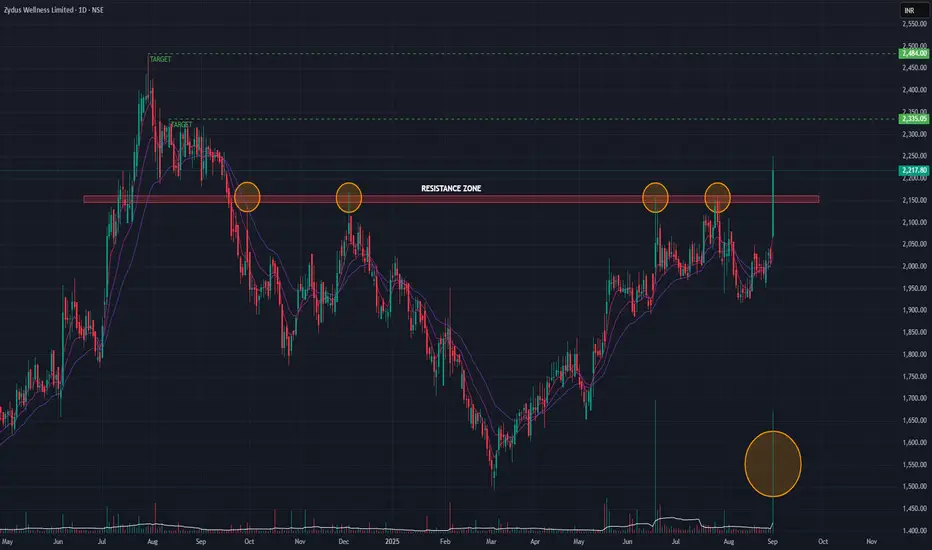
Zydus Wellness (Daily Timeframe) - Will it make new ATH?Zydus Wellness, ever since it made the All Time High, the stock was in a downtrend and then sideways for more than a year. Though it tried to breakout a key resistance level (as marked) multiple times, it could not breach the resistance zone. Today, it brokeout of the resistance zone with huge volume burst. The next few days of the stock moves in a positive direction, then it may reach 2335 levels which could be the first target.
Checking the weekly timeframe, we can see an inverted H&S pattern and without today's breakout, the stock has broken out of the H&S neckline. If we consider H&S pattern breakout, then the stock may reach new ATHs.
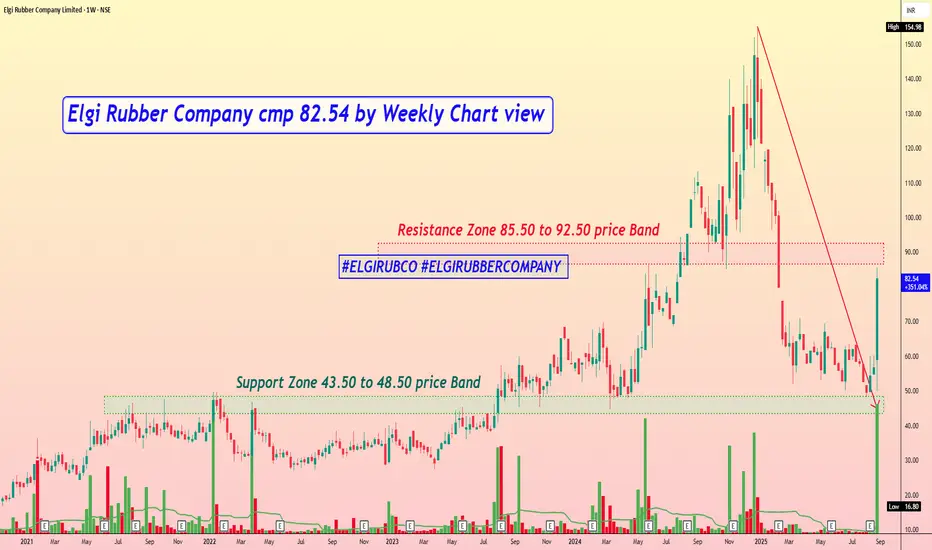
Elgi Rubber Company cmp 82.54 by Weekly Chart viewElgi Rubber Company cmp 82.54 by Weekly Chart view
- Support Zone 43.50 to 48.50 price Band
- Resistance Zone 85.50 to 92.50 price Band
- Price actively reversed from 4 years long past old Support Zone
- Heavy Volumes surged over the last week by demand based buying
- Falling Resistance Trendline Breakout sustained by bullish momentum
- Common Technical Indicators BB, EMA, MACD, RSI are trending positively
ABCAPITAL(cup& handle)My analysis is large capital company with good returns.
Key piont is Make cup and handle pattern look into chart how was possible to Target reach . Road map create for our target is 230, 300 but .. respect to SL .. LIKE ME .
Company has delivered good profit growth of 47.2% CAGR over last 5 years
Shareholding pattern (%)
As On Dec-23
Promoter 69.0 %
DII 8.4%
FII 10.6 %
Others 12.0 %
for MORE check in my TradingView ID
If You LIKE👌👌 MY Idea ......Boost.🔥🔥🔥.. its.
"Disclosure : I am not Sebi-registered." This channel is for only educational purpose. Any profit/loss, I am not responsible.
Before taking any trade on our charts / calls, please consult your financial advisors. Thanks🙏

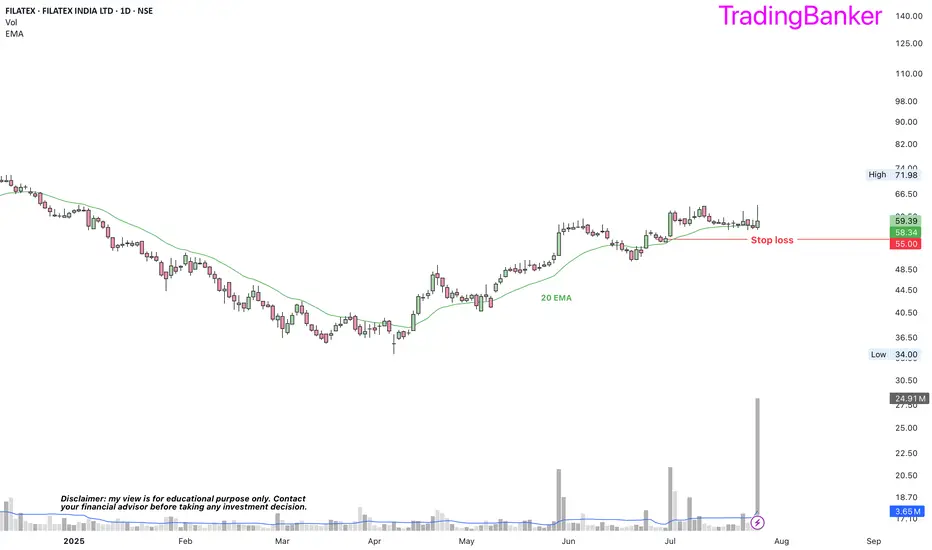
FILATEX: a probable long➡️decent RS rating
➡️improvement in EPS YoY, cash cycle and operating cash flow
➡️promoter holding at 65%
➡️trading above 20 EMA
➡️entered with a stop loss of 55
➡️huge volume spike
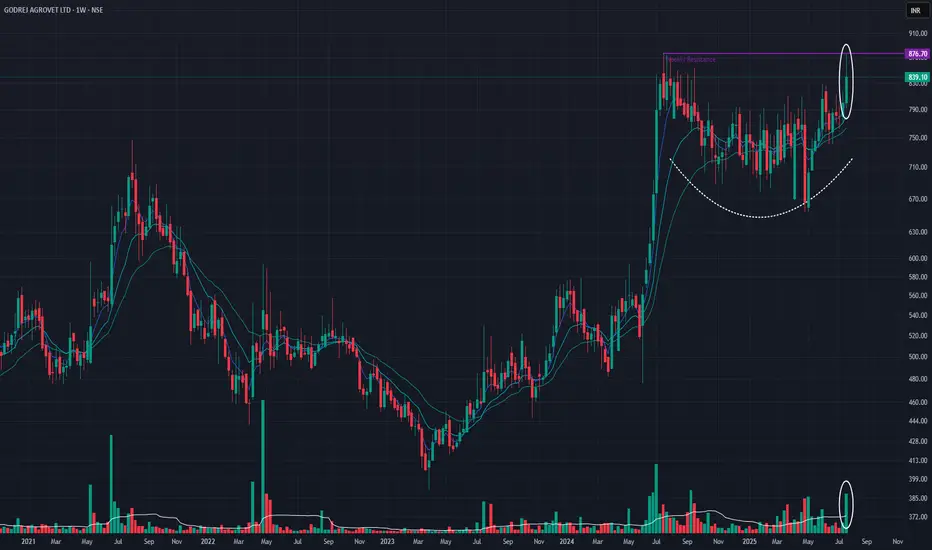
Godrej Agrovet Ltd (Weekly Timeframe) - Potential BreakoutSince the All Time High on Jul 15, 2024, the stock is in a Accumulation phase , and last week it tried to breach the ATH with Huge Volume . The stock may BreakOut of the Resistance Zone if Good Volume is available. If it is able to breach the resistance zone, then it may go to 1070 levels.
It is also possible that there could be some profit booking which means the stock could come down as well.
Keep monitoring.
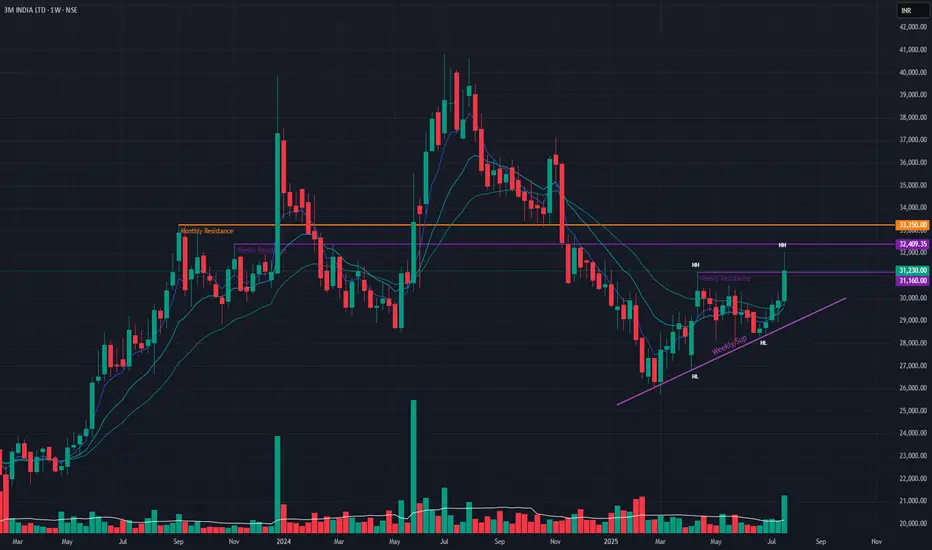
3M India Ltd (Weekly Timeframe) - Potential BreakoutPast few weeks, the stock has been in an uptrend and has breached the short-term weekly resistance during this week with HUGE VOLUME . Next target for the stock is to breach the weekly resistance zone near 32,405. During the week, a positive cross-over of EMAs has been established, indicating positive signs. With this week's bullish candle, the stock has made Higher Highs (HH) while breaching the short-term weekly resistance.
Keep a watch on the stock for next week.
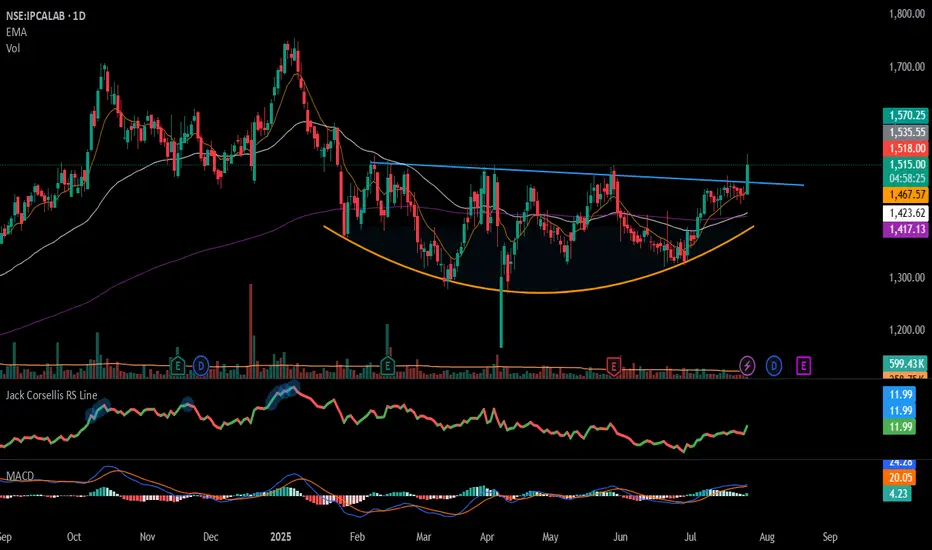
#IPCALAB - Rounding Bottom Breakout in DTF/ Keep in WL📊 Script: IPCALAB
Key highlights: 💡⚡
📈 Rounding Bottom Formation in Daily Time Frame
📈 Price consolidating near Resistance, then Breakout
📈 Volume spike during Breakout
📈 MACD Bounce
📈 Can go for a swing trade
BUY ONLY ABOVE 1535 DCB
⏱️ C.M.P 📑💰- 1514
🟢 Target 🎯🏆 – 12%
⚠️ Stoploss ☠️🚫 – 6%
⚠️ Important: Market conditions are Okish, Position size 50% per Trade. Protect Capital Always
⚠️ Important: Always Exit the trade before any Event.
⚠️ Important: Always maintain your Risk:Reward Ratio as 1:2, with this RR, you only need a 33% win rate to Breakeven.
✅Like and follow to never miss a new idea!✅
Disclaimer: I am not SEBI Registered Advisor. My posts are purely for training and educational purposes.
Eat🍜 Sleep😴 TradingView📈 Repeat 🔁
Happy learning with MMT. Cheers!🥂
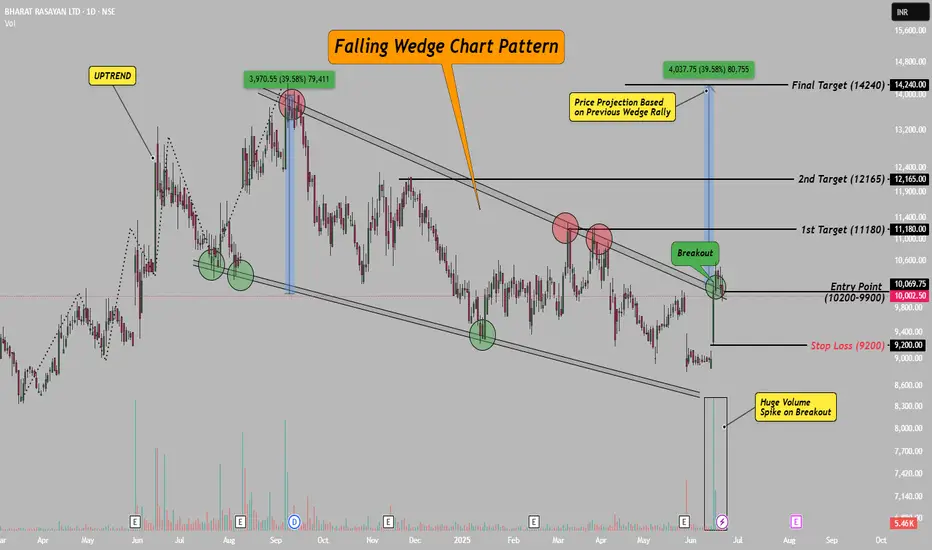
Bharat Rasayan–Falling Wedge Breakout with 39% Upside Potential!Hello Everyone, i hope you all will be doing good in your life and your trading as well! Today i have brought a post which is on Bharat Rasayan – a classic case of a falling wedge breakout.
After staying in a falling wedge pattern for nearly 10 months, the stock has finally broken out with a strong bullish candle and a clear volume spike. This breakout zone (9900–10200) also aligns with the downtrend line, making it even more valid.
The best part? This has participated in rally yet, means there is a lot remain in this stock, please check chart above for entry, stop loss and targets.
This setup is based on price action, chart structure, and previous pattern behavior. If you’re a swing or positional trader, this one’s worth watching!
If you liked this idea, don’t forget to LIKE & FOLLOW for more clean, technical setups.
Disclaimer: This idea is for educational purposes only. Do your own research before taking any trade.
Aarti Drugs Ltd (Daily Timeframe) - Potential BreakOutThe resistance zone (560-570) was breached only once , and thereafter, the stock was in a downtrend for a prolonged duration. Recent past, the stock has been forming Higher Lows & a buildup in volume in the past few days. The stock gained almost 19.5% over the last few days, assisted by huge volume. On Jul 15, the stock BrokeOut of a major resistance with huge volume, and today it tried to breach the long-term resistance.
The Short-term EMAs are in PCO state as well as a Golden Cross-over has formed few days back, which indicates further uptrend.
We should monitor the stock in the coming days for its price action to take a call.

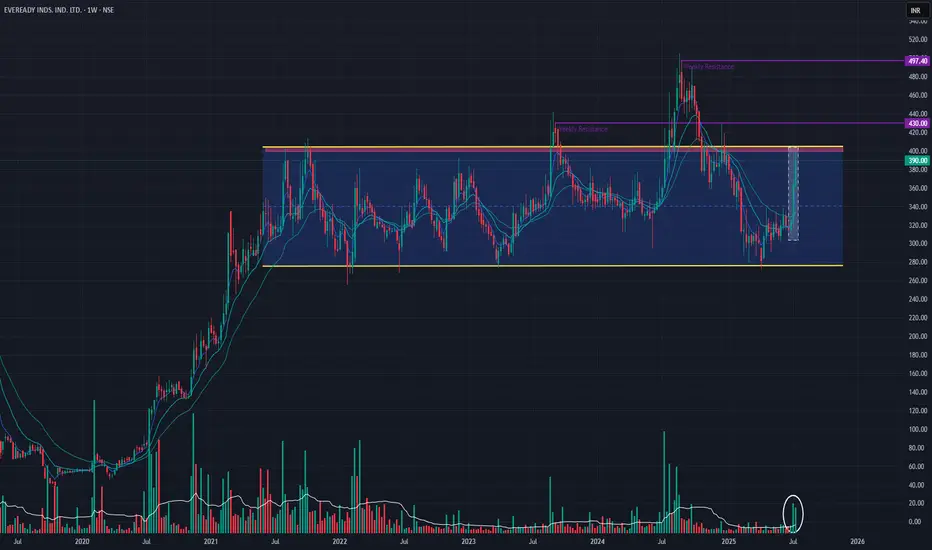
Eveready Inds. Ind. Ltd (Weekly Timeframe) - Potential BreakOutThe stock has been in a range since 2021, with couple of BreakOuts (2023 & 2024) which did not sustain momentum. Past 3 weeks the stock has gained appox: +29% with huge volume buildup . The short-term EMAs are in PCO state, indicating an uptrend . The stock may BreakOut of the resistance zone (398 - 406), if buyers show interest in the stock to take it further up.
Watchout for next week's price action!!
Greenply Industries Ltd (Weekly Timeframe) - Potential BreakOutGreenply was in a downtrend since Aug 2024 and since Feb 2025, the stock has been in an uptrend forming Higher Lows . Last week it has BrokenOut a major resistance with +9.01% gain including a huge spike in volume . If the momentum continues, it may BreakOut the next key resistance at 365.
To be monitored !!

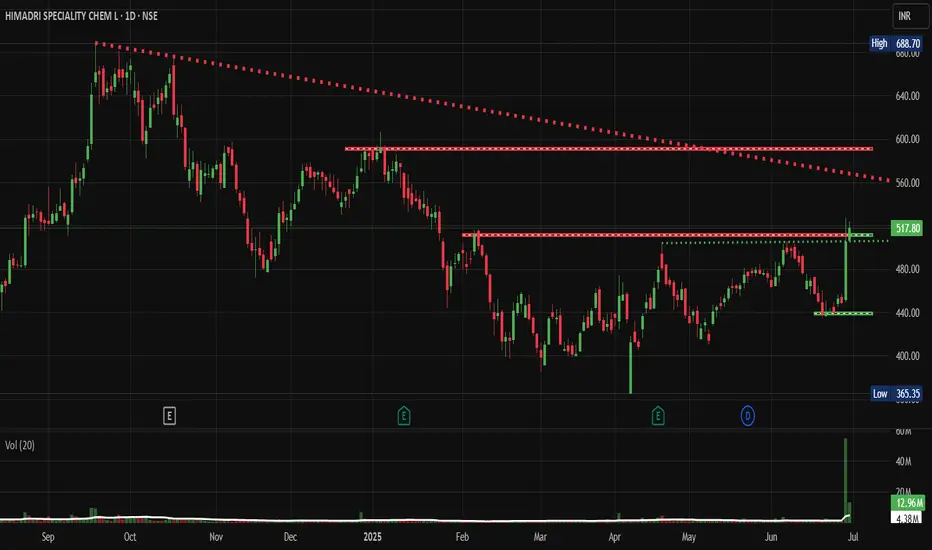
HSCL: A Classic Breakout Story in the MakingNSE:HSCL : A Classic Breakout Story in the Making
Price Action Analysis:
- Stock has formed a strong uptrend from September 2024 lows around 365 levels
- Current price of 517.80 represents a significant +41% move from the base
- Recent breakout above the 500 resistance level with strong volume confirmation
- Price action shows a classic accumulation pattern followed by a markup phase
Volume Spread Analysis:
- Significant volume spike visible in recent sessions (12.96M vs average 4.38M)
- Volume confirmation during breakout above 500 levels
- Accumulation pattern evident with higher volume on up days
- Volume trend supports the bullish price action
Base Formation & Key Levels:
- Primary Base: Formed between 400-520 levels from December 2024 to May 2025
- Secondary Base: 440-480 consolidation zone during March-April 2025
- Base Duration: Approximately 6 months of sideways consolidation
- Base Characteristics: Multiple retests of support levels with decreasing volatility
Key Support & Resistance Levels:
- Immediate Support: 480-500 zone (previous resistance turned support)
- Strong Support: 440-460 zone (multiple bounce levels)
- Major Support: 400 psychological level
- Immediate Resistance: 520-530 zone
- Next Resistance: 580-600 zone (measured move target)
- All-time High Resistance: 688.70
Technical Chart Patterns:
- Cup and Handle Pattern: Visible from October 2024 to June 2025
- Ascending Triangle: Formed during the consolidation phase
- Bullish Flag: Recent consolidation before the breakout
- Higher Highs and Higher Lows: Established uptrend structure
Trade Setup & Strategy:
Entry Strategy:
- Primary Entry: 515-520 on any pullback to the breakout zone
- Aggressive Entry: Current levels around 517-518
- Conservative Entry: Wait for retest of the 500 support level
- Scale-in Approach: 50% at 515, 30% at 505, 20% at 495
Exit Strategy:
- Target 1: 560-570 (Risk-Reward 1:2)
- Target 2: 600-620 (Risk-Reward 1:3)
- Target 3: 650-680 (Risk-Reward 1:4)
- Trailing Stop: Use 480 as a trailing stop once Target 1 is achieved
Risk Management:
- Stop Loss: 475-480 (below breakout support)
- Position Size: Maximum 2-3% of portfolio
- Risk per Trade: Not more than 1% of total capital
- Time Stop: Exit if no progress in 3-4 weeks
Position Sizing Guidelines:
- Conservative Investor: 1-1.5% portfolio allocation
- Moderate Risk: 2-2.5% portfolio allocation
- Aggressive Trader: 3-4% portfolio allocation (with tight stops)
- Swing Trading: 2% with wider stops at 460 levels
Fundamental & Sectoral Backdrop:
Company Overview:
- NSE:HSCL is a leading manufacturer of coal tar pitch and advanced carbon materials
- Key products include coal tar pitch, carbon black feedstock, and speciality carbons
- Strong presence in aluminium, graphite electrode, and speciality chemical sectors
Sectoral Dynamics:
- The speciality chemicals sector is showing strong growth momentum
- Increased demand from the aluminium and steel industries
- The government focus on Make in India and import substitution
- Rising demand for advanced materials in electric vehicles and renewable energy
Fundamental Catalysts:
- Capacity expansion plans and new product launches
- Strong demand from end-user industries
- Improved margin profile due to product mix optimization
- Debt reduction and improved financial metrics
- ESG initiatives and sustainable product development
Market Conditions:
- Overall market sentiment is positive for chemical stocks
- Sectoral rotation favours speciality chemicals
- Export opportunities in global markets
- Raw material cost stabilization supporting margins
Risk Factors:
Technical Risks:
- Failure to sustain above 500 levels could lead to a retest of the 440 support level
- High volatility is expected given the breakout nature
- Overbought conditions in the short term may cause profit booking
Fundamental Risks:
- Raw material price volatility (coal tar and petroleum products)
- Environmental regulations affecting production
- Competition from global players
- Economic slowdown affecting end-user demand
- Currency fluctuation impact on exports/imports
My Take:
My analysis suggests a positive technical setup with strong breakout potential, supported by favourable sectoral trends and improving fundamentals. However, proper risk management and position sizing remain crucial for successful execution.
Keep in the Watchlist.
NO RECO. For Buy/Sell.
📌Thank you for exploring my idea! I hope you found it valuable.
🙏FOLLOW for more
👍BOOST if you found it useful.
✍️COMMENT below with your views.
Meanwhile, check out my other stock ideas on the right side until this trade is activated. I would love your feedback.
Disclaimer: "I am not a SEBI REGISTERED RESEARCH ANALYST AND INVESTMENT ADVISER."
This analysis is intended solely for informational and educational purposes and should not be interpreted as financial advice. It is advisable to consult a qualified financial advisor or conduct thorough research before making investment decisions.
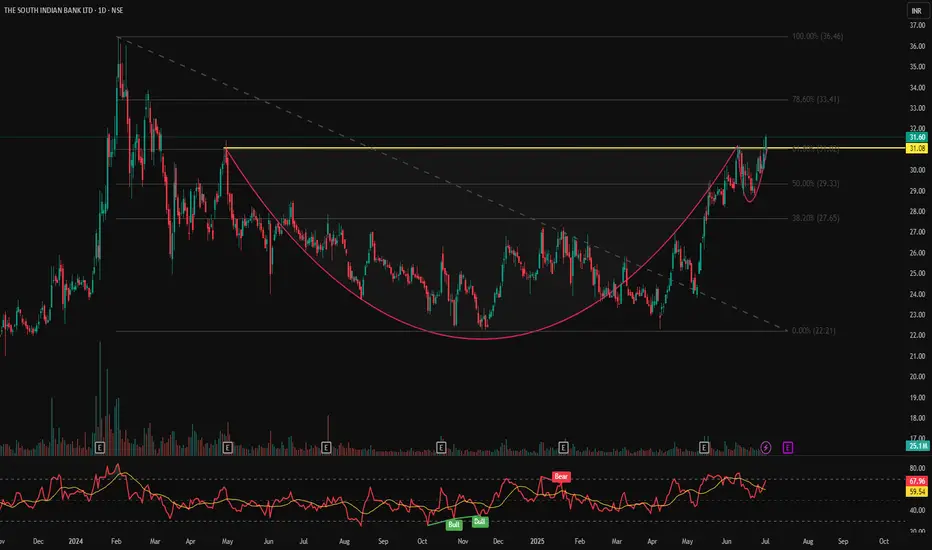
SOUTHBANK – Breakout From Cup & Handle | Daily Chart📊 SOUTHBANK – Breakout From Cup & Handle | RSI Bullish | High Volume | Fibonacci Levels | Daily Chart
📅 Chart Date: July 2, 2025
📍 CMP: ₹31.60 (+2.63%)
📈 Symbol: NSE:SOUTHBANK
🔍 Technical Breakdown
✅ Cup & Handle Breakout
A perfect cup & handle pattern breakout is visible
Price breaks out above the neckline at ₹31.08, which was a strong resistance zone
Breakout supported by rising volume (25.1M) adds conviction
📊 RSI Momentum
RSI (14) reading at 67.96 signals bullish strength, approaching overbought but not yet extreme
RSI crossover and previous bullish divergence helped initiate the move
📐 Fibonacci Retracement Levels (Swing: ₹22.21 to ₹36.46)
38.2% – ₹27.65
50.0% – ₹29.33
61.8% – ₹31.08 ✅ (Breakout zone)
78.6% – ₹33.41
100% – ₹36.46 🎯
🏁 Key Levels
Breakout Zone (Neckline): ₹31.08
CMP: ₹31.60
Resistance Levels: ₹33.41 → ₹36.46
Support Levels: ₹29.33 → ₹27.65
💡 Trade Idea
Entry: Above ₹31.10 on volume confirmation
SL: Below ₹29.30
Targets: ₹33.40 → ₹36.40+
Momentum + Breakout = High Conviction Setup
⚠️ Disclaimer
This analysis is for educational purposes only. Always do your own research and consult a registered advisor before investing.
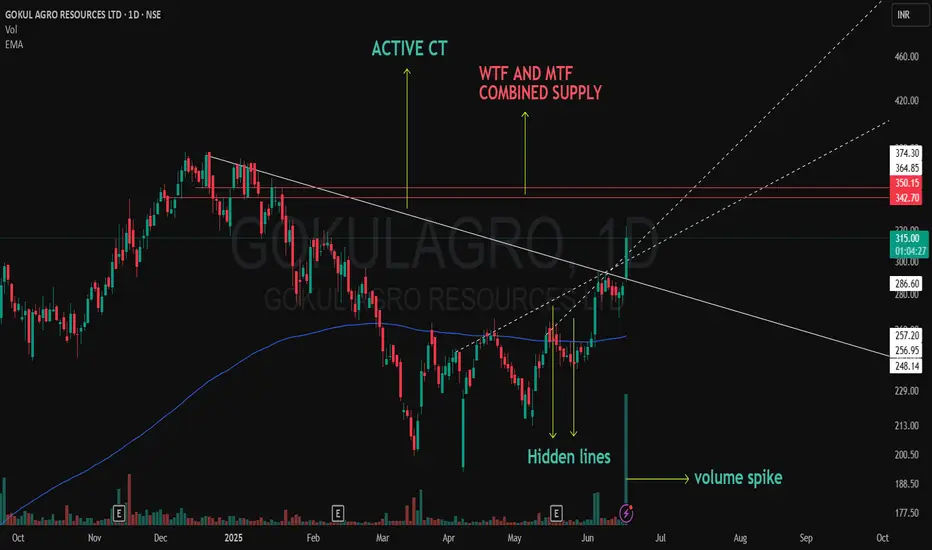
CT Breakout Live on GOKULAGRO! Supply Zone Just Ahead 📌 CT Breakout In Play | GOKULAGRO
A strong breakout just happened on the Daily chart of GOKULAGRO.
🟢 The Active CT (green) has been cleanly broken today with a strong bullish candle.
🟢 Multiple hidden resistances were also taken out during the breakout – marked in green as they’ve now turned into potential support.
🟢 A healthy volume spike confirms strong participation – not massive, but convincing enough to validate the move.
🔴 The next major supply lies just ahead – a combined Weekly + Monthly resistance zone (marked in red). This could act as a temporary pause or reversal zone if not cleared with momentum.
This is not a forecast or a buy/sell recommendation — just a structured observation of price action and context.
Watching how it behaves near the higher timeframe supply. Will it reject or absorb?
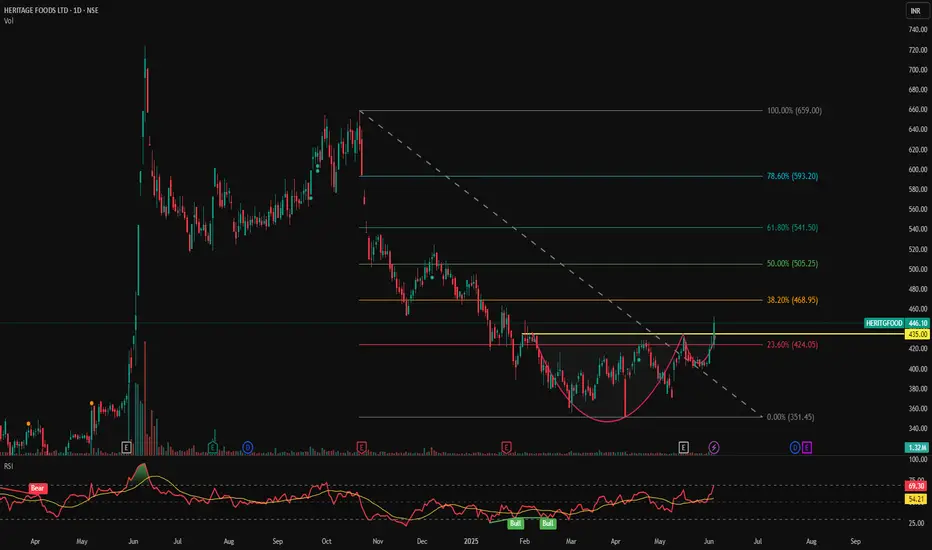
HERITGFOOD - Cup & Handle Breakout with RSI Confirmation | Daily📊 HERITAGE FOODS LTD (HERITGFOOD) – Cup & Handle Breakout with RSI Confirmation | Daily Chart
📅 Chart Date: June 5, 2025
📈 CMP: ₹446.10 (+5.94%)
📍 Ticker: NSE:HERITGFOOD
🔍 Technical Analysis Overview
☕ Cup & Handle Pattern Breakout
HERITGFOOD has successfully broken out of a Cup & Handle pattern, signaling the end of a long downtrend and a potential start of a new bullish wave. The breakout zone lies around ₹435–₹440.
💥 Breakout Volume: Supported by a strong surge in volume (~1.32M), adding conviction to the breakout.
📉 RSI Indicator:
RSI is at 69.30, just below overbought territory, indicating strong momentum.
RSI crossover above signal line confirms bullish strength.
📍 Key Price Levels
✅ Breakout Zone: ₹435–₹440
🚀 Upside Targets (based on pattern projection and past resistance):
₹470 – minor resistance
₹510 – medium-term swing target
₹550+ – extended target if momentum sustains
🛡️ Support Levels:
₹435 – breakout retest zone
₹415 – minor base
₹390 – handle bottom (critical invalidation)
🔻 Stop Loss Zone: Below ₹415–₹420 for risk-managed swing positions
🛠️ Trading Strategy
Entry: After confirmation candle above ₹440 or on pullback to retest breakout zone
Stop Loss: Below ₹415
Targets: ₹470 → ₹510 → ₹550+
Risk/Reward: Attractive R:R setup with confirmation indicators
⚠️ Disclaimer
This chart is for educational and analysis purposes only. Please consult a SEBI-registered financial advisor before taking any trading decision.
SURAJEST : Short Term Trade (1-3 Months)#SURAJEST #parallelchannelbreakout #breakoutstock #trendingStock #Momentumstock
SURAJEST : Short Term (1-3 Months)
>> Parallel Channel Breakout
>> Breakout Candidate
>> Trending Stock in Momentum
>> Good Strength in Stock
>> Recent Volume Buildup
>> Good Upside Potential
Swing Traders can lock profit at 10% and keep trailing
Disc : Stock charts shared are for Learning purpose and not a Trade recommendation.
Pls consult a SEBI Registered Advisor before taking position in it.

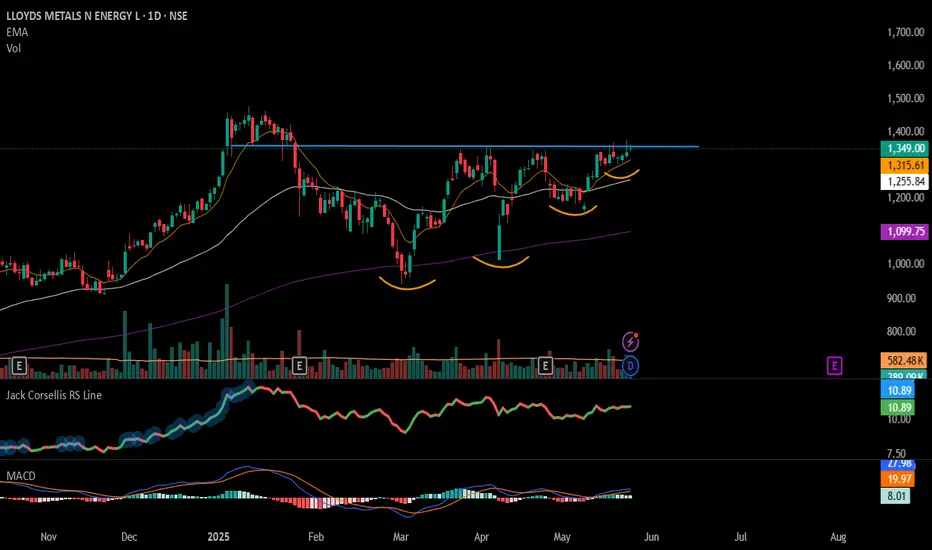
#LLOYDSME - BreakOut Soon Candidate📊 Script: LLOYDSME
Key highlights: 💡⚡
📈 VCP BreakOut in Daily Time Frame.
📈 Price consolidating near Resistance.
📈 Wait for Volume spike during Breakout
📈 MACD Bullish
📈 Can go for a swing trade
BUY ONLY ABOVE 1405 DCB
⏱️ C.M.P 📑💰- 1349
🟢 Target 🎯🏆 – NA%
⚠️ Stoploss ☠️🚫 – NA%
⚠️ Important: Market conditions are Okish, Position size 50% per Trade. Protect Capital Always
⚠️ Important: Always Exit the trade before any Event.
⚠️ Important: Always maintain your Risk:Reward Ratio as 1:2, with this RR, you only need a 33% win rate to Breakeven.
✅Like and follow to never miss a new idea!✅
Disclaimer: I am not SEBI Registered Advisor. My posts are purely for training and educational purposes.
Eat🍜 Sleep😴 TradingView📈 Repeat 🔁
Happy learning with MMT. Cheers!🥂
Hidden Channel SHATTERED – Explosive Breakout on SHILPA MEDICARE✅ Breakout from a well-defined Weekly Counter Trendline (white thick line) with strong bullish candle.
⚡ Hidden Broadening Channel Formation (dotted white lines) was also broken in the same move—double breakout confirmation!
💥 Volume spike — first major surge in weeks, indicating institutional participation.
📌 Consolidation just below major resistance (MTF orange line) played out perfectly. Price broke above previous swing highs.
🧱 Next Resistance: ₹898.05 (Monthly TF resistance). With current momentum, a clean test is highly probable.

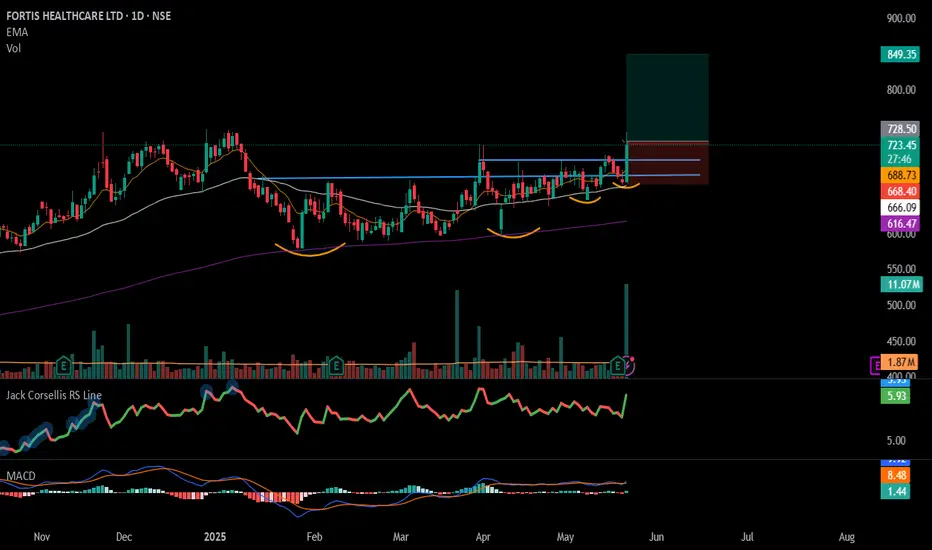
#FORTIS - VCP BreakOut in Daily Time Frame📊 Script: FORTIS
Key highlights: 💡⚡
📈 VCP BreakOut in Daily Time Frame.
📈 Price consolidated near Resistance.
📈 Volume spike seen
📈 MACD Crossover
📈 Can go for a swing trade
BUY ONLY ABOVE 728 DCB
⏱️ C.M.P 📑💰- 722
🟢 Target 🎯🏆 – 16%
⚠️ Stoploss ☠️🚫 – 8%
️⚠️ Important: Market conditions are Okish, Position size 50% per Trade. Protect Capital Always
⚠️ Important: Always Exit the trade before any Event.
⚠️ Important: Always maintain your Risk:Reward Ratio as 1:2, with this RR, you only need a 33% win rate to Breakeven.
✅Like and follow to never miss a new idea!✅
Disclaimer: I am not SEBI Registered Advisor. My posts are purely for training and educational purposes.
Eat🍜 Sleep😴 TradingView📈 Repeat 🔁
Happy learning with MMT. Cheers!🥂
PARAMOUNT COMA LTD📊 PARAMOUNT COMA LTD (1D) – CMP ₹60.08
📅 Date: May 20, 2025
📈 Exchange: NSE
📌 Ticker: PARACABLES
🧠 Technical Analysis Overview
✅ Bullish W-Pattern (Double Bottom):
Price has formed a strong W-pattern, also known as a double bottom, indicating a potential trend reversal. The neckline breakout above ₹58.00 confirms bullish momentum.
✅ Downtrend Breakout:
The long-term falling trendline has been broken decisively with strong bullish candles and increasing volume – a classic reversal signal.
✅ Volume Spike:
Breakout has occurred with significant volume (1.98M), confirming the strength of the move and hinting at potential institutional entry.
✅ Fibonacci Retracement Levels:
🔶 38.2% – ₹65.69
🟩 50.0% – ₹72.36
🟩 61.8% (Golden Ratio) – ₹79.03
💡 Price Action Strategy
🧱 Key Support & Resistance Levels
🟩 Support
₹58.00 – Previous neckline breakout level
₹50.00 – Mid-range base level
🟥 Resistance (Fibonacci-based)
₹65.69 – 38.2%
₹72.36 – 50%
₹79.03 – 61.8% Golden Ratio
📌 Conclusion
PARAMOUNT COMA LTD has triggered a strong breakout after forming a W-pattern and clearing a key trendline. With volume confirmation and upside potential toward Fibonacci levels, this could be a promising swing trade setup. Retesting ₹58 zone could offer a perfect entry opportunity.
📌 Disclaimer:
This is for educational purposes only. Not financial advice. Always do your own research or consult a financial advisor.
