Divis Labs-Breakout of a good investment stock Divis labs is looking strong for a weekly breakout.
A monthly closing above 4000 can bring good momentum in the stock.
Pharma sector is bullish and we can see ATH levels in this stock soon
Weeklychart

BAJAJFINSV - Breakout after 2 years BAJAJFINSV - Breakout on the weekly timeframe after 2 years.
The stock has been trading in a the same range for around 2 years and finally out of the zone and expected to finally give a good upside rally in the coming weeks, months.
Those who are looking for a medium - long term investment opportunity in a well established company, this is an ideal option.
Please do you OWN RESEARCH before making your buy/sell decision, these views are my personal views only.

HEIDELBERG CEMENT - CUP AND HANDLE PATTERN The stock has formed CUP AND HANDLE pattern
on the WEEKLY chart.
Wait for strong breakout with good volumes
One can enter above 248 with a strict Stoploss of 212
Target 1 - 284
Target 2 - 310
Target 3 - 340
#SWINGTRADE
What is your view please comment it down and also boost the idea this help to motivate us. All views shared on this channel are my personal opinion and is shared for educational purpose and should not be considered advise of any nature.

NIFTY 50 BULLISH FLAG PATTERNkeep eye on the nifty 50 chart its making bullish flag pattern on weekly time frame.
#powerofchartpattern
#technicalanalysis
#weeklytimeframe
#bullishflag

MULTIBAGGER AT WEEKLY SUPPORTSNSE:POONAWALLA proved out to be a multi-bagger with 4X returns in last 24-30 months. Stock has corrected and is now available at support. Strong promoters and growth can give more returns.

ELGIEQUIP - Ready for the next swingELGIEQUIP - Ready for the next swing with an upside potential of 20% in the next few weeks. The stock has been trading in the channel for the last 4+ years, with a steady upside trend. The stock is also backed with good fundamentals and overall at a good spot to leverage for a nice swing trade.

Muthoot Finance - Risky 1:3 RR bet based on BO1. Volumes are low
2. Risk of BO failure
3. For now prices are sustaining above the BO level that's a good sign
4. Below Dz will be the best area to go long.
5. Trade with 10% SL
- Stay tuned for further insights, updates and trade safely!
- If you liked the analysis, don't forget to leave a comment and boost the post. Happy trading!
Disclaimer: This is NOT a buy/sell recommendation. This post is meant for learning purposes only. Please, do your due diligence before investing.
Thanks & Regards,
Anubrata Ray

Hindalco 108 weeks breakout.for educational purpose :
cmp - 649-650
1st target 728-732 (12%)
time frame - 30-45 days
will update as per the movement
note: not a trading idea plz consult your financial advisor

SBICARD - At support levels SBICARD is at support levels and looks like it is ready for its next swing, the company has good fundamentals and as per the chart it has a good upside potential of up to 50% growth from the current levels. Overall it shows a very good Risk:Reward.

SHAREINDIA - Weekly breakout and retest SHAREINDIA - Weekly breakout and retest successful. The stock shows a very healthy growth both fundamentally and technically. Great place to enter with a handsome risk: reward.
Note: It's important to note that these observations reflect my personal views, and I recommend conducting thorough research before making any buying or selling decisions.

CYIENT LTD - Swing Trade Analysis - 3rd April #stocksCYIENT LTD (1W TF) - Swing Trade Analysis given on 3rd April, 2024
Pattern: FALLING WEDGE BREAKOUT
- Weekly Trendline Resistance Breakout - Done ✓
- Volume buildup at Resistance - Done ✓
- Demand Zone Retest & Consolidation - In Progress

BPCL | Weekly Chart | 6 years BO | Chart analysis on Weekly time frame:
Analysis:
1. Resistance zone is tested 5 times before final BO making it very critical resistance zone.
2. Before BO, consolidation happened supported by volume build up which eventually indicates that the stock accumulation is happening.
Breakout: Consolidation phase BO happened on 2-Feb-2024 followed by BO supporting candle.
Trade setup:
Entry price: If price closes above 577.85.
Stop loss: Below 522.3
Target 1: 667.7
Target 2: 813.1
Target 3: 855.9
Disclaimer:- Please always do your own analysis or consult with your financial advisor before taking any kind of trades

Snowman Logistics - Short TermThis Logistics company has formed cup and handle formation on weekly charts. Technical Indicators show strength for the short run. Buy @ 74.40 with SL @ 62.58 and Tgt @ 93.24

TIMETECHNO - Weekly breakout and retestTIMETECHNO - Weekly breakout and retest of breakout level after 4 years. The stock has been in a good bullish trend and has very good fundamentals.
I would keep a tight SL (155) and a 1:2 risk reward.

Aarti Drugs - Momentum CallThis stock is looking for a break out from the Inverse Head and Shoulder Pattern on the weekly charts. Further, RSI is showing bullish Trend. Buy this stock at Current Market Price @ 538 with a stop loss of 490 and a Target of 700 for the Short Term

MSUMIThis Auto Ancillary stock has been under consolidation for a while. But technical indicators shows strength for a run. Further, it has been taking support at the 200 DEMA. One can buy at Rs. 61.45 with a target of Rs. 65.80 and closing above could run to Rs. 67.80. Keep Stop Loss of Rs. 58.69.

EXIDEIND | Weekly Chart | 5.5years Multiyear BO | ATH BOChart analysis in Weekly time frame:
Pattern: Basing pattern is formed in 5.5 years.
Breakout: BO of ATH and Basing pattern and re-test of breakout is also performed.
Volume: Volume spike is there during BO and the volume is above Moving Average.
Trade setup:
Entry price: 345.7
Stop loss: Below previous ATH 304.7
Target 1: 369.3
Target 2: 407.55
Target 3: 469.4
Disclaimer:- Please always do your own analysis or consult with your financial advisor before taking any kind of trades

DEEPAKSP - Multi-year weekly breakout DEEPAKSP - Weekly breakout completed and the stock is currently retesting its breakout level;
The stock has broken out after a huge consolidation and has a good upside potential.

Hindustan UniliverThis FMCG Alpha is looking good for a short run. On daily charts there is a rounding bottom formation. While on technical Indicator front 20 DEMA is crossing above 200 DEMA and RSI is trending bullish, which shows strength in the stock. Buy at 2608 with a targets of 2730 and Stop Loss of 2450.

Atul flag breakout-DO NOT MISSAtul is one of the major stock of chemical sector which has been correcting since past many months.
We have seen a reversal in chemical stocks and similar reversal pattern is visible in Atul as well.
A clear flag breakout in weekly TF is visible. Confirmation is above 7600
Stock can even touch ATH if the rally continues for an year.
Keep this in watchlist.

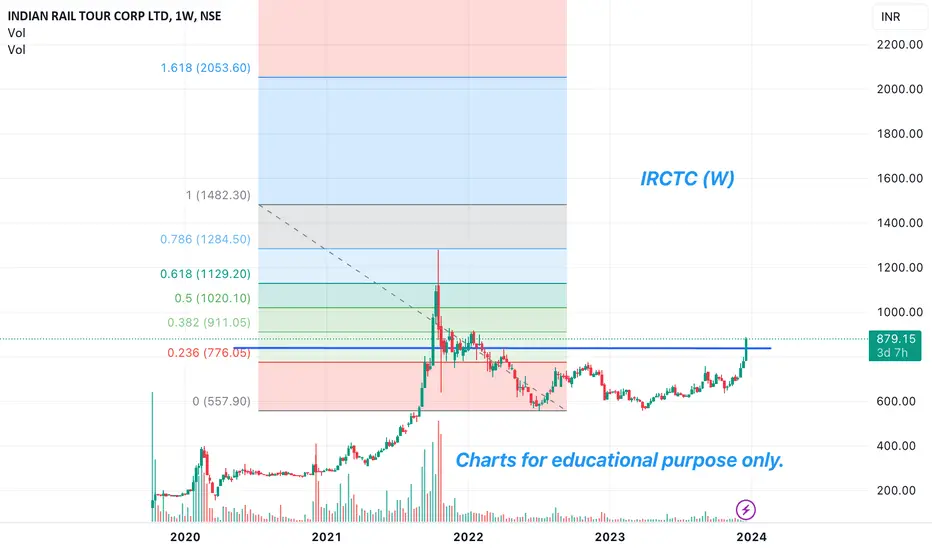
IRCTC (Looks Good On Chart)IRCTC has given a breakout at the 840 level. Closing above 840 (W) might open gates for 911, 1020, 1129, and 1284 levels.
Disclaimer: I am not a SEBI registered analyst. All the stocks are for educational purposes. Investors must consult a financial advisor before making any investment. It is not a buy or sell recommendation.
Cup n Handle Pattern Lovable Weekly Chart : Cup and Handle Pattern formation,
CMP 158.85
Target : 399.15
SL : 110
Risk is yours and Reward is too yours totally.
Reward : Risk Ratio = 6.17 : 1,
Time Frame : 1 to 3 years.
View is educational purpose only.

WHEELS INDIA - Potential Weekly breakout - Add to watchlistWHEELS INDIA, as observed in the weekly chart, is currently exhibiting a compelling technical pattern, suggesting the possibility of a significant breakout. The stock has been forming a symmetrical triangle pattern over the past several weeks, indicating a period of consolidation and tightening price movements.
Price Targets:
In the event of a confirmed breakout, traders might consider setting price targets based on the height of the triangle pattern. TARGET 1 & TARGET 2 mentioned in the chart.
