Real Time example - TRIPLE ZIGZAG (Bullish)Let's talk about each waves of Triple Zigzag:
Wave W (5-3-5) impulsive: ((a)) = ((b)) at 17709 which is close actual low 17613. Its a sharp zigzag.
Wave 1X corrective: Wave ((b)) 3-3-5, Running Correction which is little complex.
Wave Y (5-3-5) sharp: ((a)) = 0.786 ((b)) at 16824 which, is very near actual low as 16782
Our first question is, What is the Zigzag?
In chart, a, b and c is zigzag which very easy to understand by picture.
Its really easy to understand this wave counting if you read just below basic rules and Characteristics of Zigzags. The main question, What is going on in nifty? This Triple Zigzag is bullish pattern. Really market is follow this pattern? - Wait and Watch...
Characteristics of Zigzags:
— labeled a-b-c
— subdivide 5-3-5
— typically occur in wave 2 position
— ‘b’ wave does not approach ‘a’ wave origin
— ‘c’ wave ends beyond ‘a’ wave extreme
— belong to ‘sharp'
Rules:
- Wave A always subdivides into an impulse or leading diagonal.
-Wave A always subdivides into an impulse or leading diagonal.
- Wave B always subdivides into a zigzag, flat, triangle or combination.
- Wave C always subdivides into an impulse or diagonal triangle.
We can use channel for zigzag. The Wave C often ends upon reaching the extreme of the channel.
Zigzag

Nifty is still is in corrective mode, Elliott Wave analysisCheck the chart
Trade not recommended
trade at your own risk
Share your views


#Gayatri Project #Gayatri Project
Looks good for short to medium term from current levels of 39
SL 26
Target 48
Looks as a money bagger to me

Reliance: The ride of an Impulsive wave.It looks like the correction Phase is complete at wave (c).
focus on key levels will be beneficial. we are going to ride on wave 3.
wave 4 can't exceed the starting point of wave 1.
There is invalidation below 2044.
I will upload Lower Timeframe analysis.

#MCXCOPPER #COPPER correction completeMCX Copper has just traced out a pattern that can be interpreted as a A-B-C Zigzag from recent highs. All 5 subwaves of the final C wave seem to be in place. This now means the uptrend should be back in force to new highs. Hold longs with Stop at recent lows.

USDINR #Elliot Wave AnalysisVIEW:
USDINR appears to be poised for an up move as per Elliot Wave Analysis.
STRUCTURE:
Impulse(1-2-3-4-5)+Correction Sequence
Trading Plan:
Entry -- as nearer as possible to invalidation point with proper risk management according to one's risk appetite.
Exit -- at or near or in the target zone as shown in the chart.
Stop Loss -- Invalidation point
Good luck--Happy trading


Nifty Heading towards 12300NSE:NIFTY
Target - 12300
Disclaimer: Author may enter in trade so take your own decision. This is an trading idea not an trading or Investment advice.

Finolex industriesAdded 25% of total qty with SL 435 on WCB
Next Buy Range = 490-460
Reason to buy:-
1. Trading above 50 RSI
2. Trading above 200 EMA
3. Weekly zig-zag brkout.

HDFC Updated Chart & Trade Setup ! DONT MISS !!TREND ANALYSIS & TRADE SETUP
GARTLEY HARMONIC PATTERN !!
Follow Chart Instruction.
Do not be Hurry for entry.
Wait for Proper Entry Setup.
Buy/Sell with Best Risk Reward.
Educational Chart Only.
August Series Option can be traded.
Wait for entry setup, if available then Long/short.
Reward is 8-10 Times
DO NOT MISS ENTRY IN AUGUST EXPIRY !


View on Reliance IndustriesAfter a good rally in RIL, it getting high price rejection from overbought levels. We can 50 % of its upmove as a retracement.
Target should be somewhere 1300. BSE:RELIANCE [/s ymbol]


EUR/USD Technical analysisThe Weekly chart of EUR/USD has formed a Full Elliot waves Pattern
The Pair after completed (12345) Elliot waves now it is the formation of making corrective waves (ABC)
Short after the correction wave B for the another bearish impulse move on the cards.

Nifty Forecasting - Bullish Up Correction and Then Down MoveNifty would give bullish correction towards 10700 - 10850 range which is 50 to 61.8% Fib Retracement from where it might again start its down correction towards 10,000.
Happy Trading!!

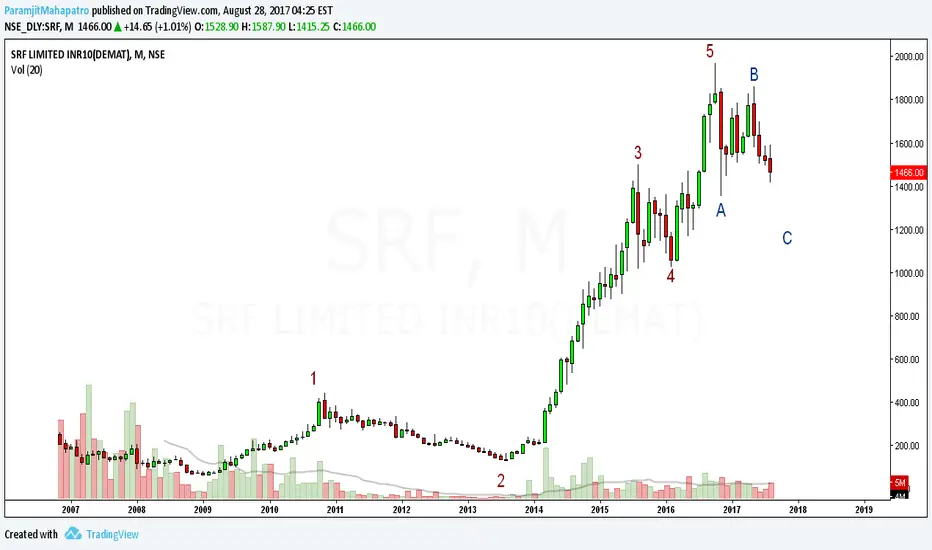
SRF EW analysis - sub wave C of wave (2) is going on here.In monthly, ew count shows that sub wave C of wave (2) is going on here.
Here are the fractals of wave (2) in daily,
fibo extension of sub wave C. . 1(1251), 1.272(1085) quite possible here.
fibo retracement levels for wave (2). .382(1235), .5(1000) quite possible here.
ZIG ZAG corection in TVS motorThe pattern formed in TVS motors suggests that it is undergoing a zig zag correction. Wave A and Wave B of the correction is already over. I am expecting wave C to be either 100%, 138% or 161.8% of wave A. Also it can be noticed that the support line in wave B is broken. The complete pattern assumption becomes invalid, if the high 380 is broken. Let's wait and watch the development.

Infosys in a Zig Zag correction in the daily chart ??In the daily chard Inforsys is about the complete the wave a of the corrective sequence. It is at the last phase of finishing the fifth wave A in a ending diagonal. One can expect the corrective wave B which can retrace 56% of wave A as shown. In the short term ne can look for long intraday positions. In the medium term one can ride the wave C in the short side.

SBI - Breaks out Previous Resistance, Wave 3 ProgressIt is been observed that ABC Zig Zag correction completed and Wave 1 and Wave 2 structured well that shows higher high. Now I observe that Wave 3 is in progress and it shall go upto 261 and retrace back to Wave 4 and then shall again move higher from 261 levels to make Wave 5. It is wise to buy after retracement or near Wave 4 levels.
As per technical pattern formation, you may also notice a "Head n Shoulder" pattern formation that retrace back to previous resistance level at 256 or Wave 4.
