EURUSD - Breakout retest - A+1. Breakout of resistance
2. candles retraced to previous support area
3. Entry can be planned after red candle high break - Volume time (london session)
4. Target next resistance zone or 1:2
Forex market

GBP/JPY Bearish Breakdown – Further Decline Ahead?📉 GBP/JPY Daily Chart Analysis
🔍 Overview:
The chart shows GBP/JPY on the 1D timeframe.
A bearish outlook is suggested with a projected price decline.
The 200 EMA (193.295) is acting as resistance.
Current price: 191.906, slightly below the 200 EMA.
📊 Technical Breakdown:
Bearish Pattern Formation:
Price broke down from a rising wedge (bearish pattern).
After a brief retest, it's rejecting the 200 EMA, confirming weakness.
Support & Resistance Levels:
Resistance: 193.295 (200 EMA).
Support zones: 188.000, followed by 184.000.
Expected Price Action:
The bearish projection suggests further decline towards 188.000 & 184.000.
If price reclaims 193.295, it could invalidate the bearish scenario.
🎯 Conclusion:
⚠️ Bearish bias as long as the price stays below the 200 EMA. A drop to 188-184 seems likely unless buyers reclaim key levels.
📌 Watchlist:
✅ Break below 190.000 = Strong sell signal
✅ Reclaim of 193.295 = Bullish invalidation
🚨 Trade cautiously & manage risk! 🚨

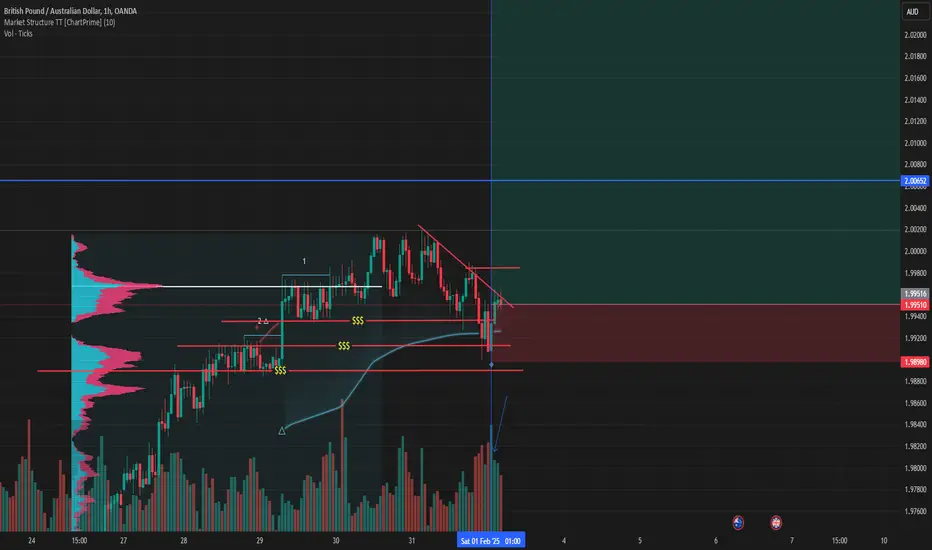
GBP/AUD after sell side liquidity purgeGBP/AUD after sell side liquidity purge during London Session


FakeoutGBPUSD May move further upwards as charts showing signals for upmove and this recent breakout may turn as a fakeout and take the price further up to the target of 1.2550.

EURUSD NEXT POSSIBLE MOVE SAXO:EURUSD
s of February 5, 2025, the EUR/USD pair is trading near 1.0320, reflecting ongoing market reactions to recent geopolitical developments, including the U.S. administration's imposition of additional tariffs on imports from China.citeturn0news10
**Technical Overview:**
- **Current Price:** .0320- **Resistance Levels:** .0400, 1.0500- **Support Levels:** .0300, 1.0200
**Technical Indicators:**
- **Trend:** he pair is currently in a bearish trend, with recent declines bringing it close to key support levels.- **Relative Strength Index (RSI):** he RSI is approaching oversold territory, suggesting potential for a corrective rebound.- **Moving Averages:** he price is trading below both the 50-day and 200-day moving averages, reinforcing the bearish outlook.
**Trade Recommendation:**
iven the current technical indicators and market conditions, initiating a **buy** position could be considered if the price shows signs of stabilizing above the 1.0300 support level.
- **Entry Point:** uy at 1.0330- **Take Profit (TP):** .0450- **Stop Loss (SL):** .0280
**Risk Management:**
his trade setup offers a 2.4:1 reward-to-risk ratio.nsure that your position size aligns with your risk tolerance and overall trading strategy.iven the current volatility, it's crucial to employ strict risk management practices.
**Conclusion:**
he EUR/USD pair is approaching key support levels, and technical indicators suggest a potential for a corrective rebound.raders should monitor price action closely and manage risk appropriately.
*Disclaimer: Trading forex carries a high level of risk and may not be suitable for all investors. Ensure you fully understand the risks involved and seek independent advice if necessary.*

GBPJPY to give a short term breakout.After trying 6 times to break the zone of 193.100-193.200, now GBPJPY is following the trendline and may give a high volume breakout and look forward to the given targets in the chart.

LONG POSITIONEntry Price: 10.95170
Stop-Loss (SL): 10.913059 (likely a typo, should be 10.913059 or 10.913059?)
Take Profit (TP): 11.26930
Trade Analysis:
Risk-Reward Ratio:
Risk: Entry - SL = ~0.03864
Reward: TP - Entry = ~0.3176
Risk-reward ratio = ~1:3.2 (good risk management).
Key Levels to Watch:
Support: 10.91 - 10.95 zone.
Resistance: 11.27 (major psychological level).
Fundamental Factors to Monitor:
US Economic Data: Fed policy, inflation, and job reports.
Swedish Krona Strength: Watch Riksbank policy, inflation, and GDP trends.
Market Sentiment: Risk-off moves could strengthen USD.

USDCHF spot outlook USDCHF spot looks bullish spike possible from 0.9050 to 0.9150.
Any breakout below 0.9050 may hit SL and settle down at low ...
If get raise above 0.9050 chances to hit TGT 0.9150

analysisPrice action trading is a technique where traders make decisions based on the price movements of a financial asset, rather than relying on technical indicators. It involves analyzing historical price data to identify patterns and trends that can indicate future price movements.

EURUSD NEXT POSSIBLE MOVE SAXO:EURUSD
As of February 4, 2025, the EUR/USD pair is experiencing significant volatility, primarily due to recent geopolitical developments, including the U.S. administration's imposition of tariffs on imports from Mexico, Canada, and China. These actions have led to heightened market turbulence and a notable decline in the euro.
**Technical Overview:**
- **Current Price:** 1.0277
- **Resistance Levels:** 1.0300, 1.0350
- **Support Levels:** 1.0200, 1.0150
**Technical Indicators:**
- **Trend:** The pair is currently in a bearish trend, having broken below key support levels.
- **Relative Strength Index (RSI):** The RSI is approaching oversold territory, indicating potential for a corrective rebound.
- **Moving Averages:** The price is trading below both the 50-day and 200-day moving averages, reinforcing the bearish outlook.
**Trade Recommendation:**
Given the prevailing bearish momentum, initiating a **buy** position carries significant risk. However, if you anticipate a corrective rebound, consider the following cautious approach:
- **Entry Point:** Wait for a confirmed break above the immediate resistance at 1.0300 before entering a buy position.
- **Take Profit (TP):** 1.0400
- **Stop Loss (SL):** 1.0200
**Risk Management:**
This trade setup offers a 1:1 reward-to-risk ratio. Ensure that your position size aligns with your risk tolerance and overall trading strategy. Given the current volatility, it's crucial to employ strict risk management practices.
**Conclusion:**
The EUR/USD pair is currently under significant bearish pressure due to geopolitical factors and technical breakdowns. While a corrective rebound is possible, any buy positions should be approached with caution, and traders should be prepared for potential further declines.
*Disclaimer: Trading forex carries a high level of risk and may not be suitable for all investors. Ensure you fully understand the risks involved and seek independent advice if necessary.*

NZDUSD MULTI TIME FRAME ANALYSISHello traders , here is the full multi time frame analysis for this pair, let me know in the comment section below if you have any questions , the entry will be taken only if all rules of the strategies will be satisfied. wait for more price action to develop before taking any position. I suggest you keep this pair on your watchlist and see if the rules of your strategy are satisfied.
🧠💡 Share your unique analysis, thoughts, and ideas in the comments section below. I'm excited to hear your perspective on this pair .
💭🔍 Don't hesitate to comment if you have any questions or queries regarding this analysis.

AUD/JPY Bearish Outlook: Potential Breakdown Toward 83.516?1. Chart Pattern: Descending Wedge/Channel
The chart shows a clear downward sloping channel, indicating a bearish trend.
Price has been making lower highs and lower lows, suggesting selling pressure.
2. Key Levels
Resistance: The upper boundary of the descending channel acts as resistance.
Support: The lower boundary of the descending channel serves as support.
Major Target: The projected price movement (indicated by the arrow) suggests a drop toward 83.516, which appears to be a strong support level.
3. Moving Average (EMA 200)
The 200 EMA (94.639) is being tested.
If price breaks below the 200 EMA, it could signal further downside.
4. Recent Price Action
The price is currently at 95.848, having dropped -1.43% in the latest session.
If it fails to hold this zone, a breakdown could accelerate selling pressure.
5. Bearish Breakdown Scenario
A break below 95.000 could trigger further selling.
If price follows the projected path, a move to 83.516 is possible.
Conclusion
Bearish bias in the medium term.
Watching for a breakdown below 94.639 (200 EMA) for confirmation.
If the lower channel support holds, a bounce could occur.
Traders should look for confirmation signals before entering a position.

NZD/JPY Bearish Breakdown | More Downside Ahead?📉 NZD/JPY Technical Analysis (Daily Chart)
Key Observations:
Downtrend Dominance ⬇️: The pair has been in a clear downtrend since mid-2024, with lower highs and lower lows forming consistently.
200 EMA Resistance 🚨: The red 200-day EMA at 90.088 is acting as a major resistance level, reinforcing the bearish outlook.
Bearish Breakout Pattern ⚠️: A descending structure is forming, suggesting a continuation of the downtrend.
Projected Drop 📉: The black arrow on the chart indicates a potential drop toward 82.00 - 80.00 levels in the coming weeks.
Trading Strategy:
🔴 Bearish Bias: Traders might look for short opportunities on lower highs, especially near 87.00 - 88.00 resistance.
✅ Target Zones: 84.00 (first support) and 80.00 (major support).
🚨 Invalidation Level: A break above 90.00 (above 200 EMA) could signal trend reversal.
What’s your trade plan? 🎯📊

GBPUSD - READY FOR ANOTHER FALL ?Symbol - GBPUSD
The GBPUSD is currently testing the resistance level within its downtrend, but the price lacks the momentum to break through this range. Anticipation of upcoming news could further reinforce the downward movement. On the daily chart, the price is also exhibiting a false breakdown at a relatively significant level, reinforcing the notion that the market remains within the selling zone. The upcoming Federal Reserve meeting is expected to maintain the current interest rate, but the key focus will be on Chairman Powell's speech. Should his remarks lean towards a hawkish stance, which seems the most probable scenario, the US dollar may strengthen, potentially exerting downward pressure on the GBP.
From a technical perspective, the most substantial price movements typically occur following false breakouts.
Resistance levels: 1.2490
Support levels: 1.2415, 1.2380
A retest of the trend resistance resulting in a false breakout, followed by consolidation below the resistance line, could lead to further downward momentum. A break below the support level at 1.2415 would likely trigger additional selling. In the absence of unexpected news, the currency pair may decline towards the 1.2240 level.
I will be looking to enter a short trade in the 1.2480 - 1.2520 range, with a stop loss at 1.2550 and a target of 1.2340.

USDCHF - CONTINUATION OF BULLISH TREND?Symbol - USDCHF
The USDCHF pair is currently entering the realization phase following an extended period of correction. A favorable environment has been established by the ongoing uptrend and the strengthening of the dollar. The technical outlook on the daily timeframe is positive. After breaking through trend resistance, the price retested the previously breached level. Following a false breakout, the pair successfully consolidated above this key point, establishing an interim low and signaling potential for further gains.
From a technical perspective, attention is now focused on the resistance level at 0.9110. Should the bulls manage to surpass this zone and establish a sustained break above it, the pair could potentially rise toward 0.9180–0.9300
Resistance levels: 0.9110
Support levels: 0.9050
Prior to breaking through the resistance, the currency pair may test the support level at 0.9050, driven by liquidity beneath this area. However, a decisive move above 0.9110 could serve as the catalyst for further upward momentum.

EURUSD NEXT POSSIBLE MOVE SAXO:EURUSD
As of February 3, 2025, the EUR/USD pair has experienced a significant bearish movement, opening with a strong bearish gap that pushed the price to touch the extended target at 1.0220. This decline is attributed to recent geopolitical developments, including the U.S. administration's decision to impose tariffs on Canada and Mexico, with potential expansion to European Union countries.
**Technical Overview:**
- **Current Price:** 1.0220
- **Resistance Levels:** 1.0300, 1.0325
- **Support Levels:** 1.0220, 1.0100
**Technical Indicators:**
- **Trend:** The pair is currently in a bearish trend, having broken below key support levels.
- **Relative Strength Index (RSI):** The RSI is approaching oversold territory, indicating potential for a corrective rebound.
- **Moving Averages:** The price is trading below both the 50-day and 200-day moving averages, reinforcing the bearish outlook.
**Trade Recommendation:**
Given the current market conditions and technical indicators, initiating a **buy** position carries significant risk due to the prevailing bearish momentum. However, if you anticipate a corrective rebound, consider the following cautious approach:
- **Entry Point:** Wait for a confirmed break above the immediate resistance at 1.0300 before entering a buy position.
- **Take Profit (TP):** 1.0400
- **Stop Loss (SL):** 1.0200
**Risk Management:**
This trade setup offers a 1:1 reward-to-risk ratio. Ensure that your position size aligns with your risk tolerance and overall trading strategy. Given the current volatility, it's crucial to employ strict risk management practices.
**Conclusion:**
The EUR/USD pair is currently under significant bearish pressure due to geopolitical factors and technical breakdowns. While a corrective rebound is possible, any buy positions should be approached with caution, and traders should be prepared for potential further declines.
*Disclaimer: Trading forex carries a high level of risk and may not be suitable for all investors. Ensure you fully understand the risks involved and seek independent advice if necessary.*

GPB/USD big sell for long timeafter receiving information about the imposition of trade taxes. USD has strengthened significantly, and xxx/USD pairs have dropped sharply.
We wait for the price to fill the gap and look for a sell signal

EURUSD LONGEurusd coming toward buying zone in 4hr time frame. wait for to enter zone use 15mins confimation for entry

BUY GBPAUD 3/2/2025+ AB currency
+ D1 uptrend
+ H1 get liquidity + price return to GAP
+ H4 pattern inside bar
GPB/USD continues sell for Big trend shortThe price has recovered to test the previous downtrend and currently, time D1 + H4 is showing significant weakening signals. Continue to watch for sell in line with the trend at time W and look for sell signals in line with the trend at time H1 + M15.

USDCHF MULTI TIME FRAME ANALYSISHello traders , here is the full multi time frame analysis for this pair, let me know in the comment section below if you have any questions , the entry will be taken only if all rules of the strategies will be satisfied. wait for more price action to develop before taking any position. I suggest you keep this pair on your watchlist and see if the rules of your strategy are satisfied.
🧠💡 Share your unique analysis, thoughts, and ideas in the comments section below. I'm excited to hear your perspective on this pair .
💭🔍 Don't hesitate to comment if you have any questions or queries regarding this analysis.

GBPUSD MULTI TIME FRAME ANALYSISHello traders , here is the full multi time frame analysis for this pair, let me know in the comment section below if you have any questions , the entry will be taken only if all rules of the strategies will be satisfied. wait for more price action to develop before taking any position. I suggest you keep this pair on your watchlist and see if the rules of your strategy are satisfied.
🧠💡 Share your unique analysis, thoughts, and ideas in the comments section below. I'm excited to hear your perspective on this pair .
💭🔍 Don't hesitate to comment if you have any questions or queries regarding this analysis.
