GBPAUD, TURTLE SOUPSwept the equal High, broken the structure downside.
waiting for the 15m fvg fill..
FOR THE SHORTS
Forex market

EURUSD: Continuing to search for new bottoms!The EUR/USD pair is recovering some lost ground below the 1.0800 level in early Asian trading on Tuesday. The pair's recovery is driven by the modest decline of the US dollar and lower US Treasury bond yields.
In the short term, there are expectations of an increase, but when looking at the longer-term trend, the weakness of this currency pair has not yet stopped. It has just surpassed the support level of 1.085 and still aims to find momentum around the 1.075 level. If that price level continues to be broken by the bearish side, EURUSD still has another opportunity at the 1.066 level as it is a significant support level that has helped EURUSD rebound strongly in the recent past. The currency market is fully priced in.

GBPUSD: POST MARKET ANALYSIS 30.1.24In the 15 min tf, the price was already making lower lows and lower highs and thus the orderflow was bearish. the 1 hour time frame liquidity was not yet taken. As soon as the new york killzone started, there was an accumulation manipulation and the distribution to the downside. the entry was taken in a bearish order block in the and the 1 hr liquidity was chosen as the target


EURNZD SWING (BULLISH TRADE) Eurnzd is bullish because we are holding a bullish falling wedge pattern on 1D or its breakout is about to happen or we are holding a bullish falling wedge pattern on 4H until breakout is left

NZDCHF BULLISHNZDCHF :- Bullish falling wedge pattern is forming on 4h time frame and it's breakout and wait for pullback
entry= 0.53024
tp= 0.54224
sl=0.52664

EURJPY BULLISH EURJPY :-Ascending triangle pattern breakout and retest
Entry =159.200
Sl=158.200
Tp=162.200

EURAUDGreetings!
Welcome traders.
By choosing to "Follow", you can stay updated with the latest information promptly. Kindly consider clicking "Boost" as well.
Wishing you a pleasant day.

GBPAUDGreetings!
Welcome traders.
By choosing to "Follow", you can stay updated with the latest information promptly. Kindly consider clicking "Boost" as well.
Wishing you a pleasant day.

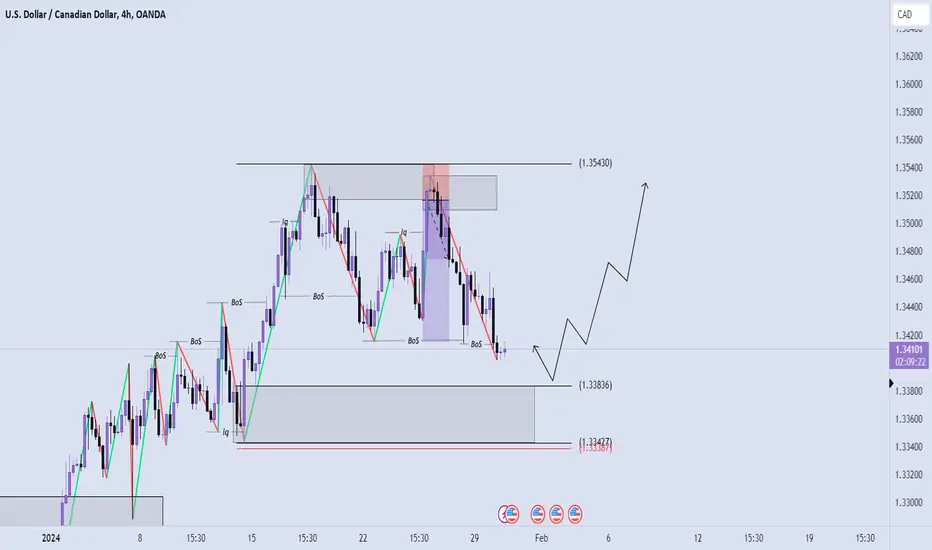
USDCAD TRADE IDEApossible USDCAD trade scenario enter with ltf confirmation if taken direct entry manage your risk properly 1:2-3 RR as this week is full of HIGH IMPACT NEWS enter at your own risk
indicator based SMC approach. follow and like for more such setups
NZDCHF TRADE IDEApossible NZDCHF trade scenario will look for entry from above zone
enter with ltf confirmation if taken direct entry manage your risk properly 1:2-3 RR
Indicator based SMC approach. follow and like more such smc setups

USDJPY: Continue to reduce as the new week begins!Dear friends, USDJPY started the session today with a slight decline, trading around 147.75 and losing 0.25% throughout the day as it remains in a corrective wave despite its short-term upward trend.
In this context, the Japanese Yen attracts some safe-haven flows amid deepening political tensions. The USD maintains stability below its monthly peak and may support USD/JPY. Traders can also anticipate the important FOMC meeting in the face of uncertainty regarding interest rate cuts.
Any further price slide is likely to attract buyers near the round figure of 147.00, which would help limit the downside of the USD/JPY pair near the 146.45 area or last week's low level. A convincing break below the following level could shift the short-term trend favorably for bearish traders and push the spot price down to the horizontal support level at 146.700.

USDJPY: Price slippage after a good week!Dear friends, as anticipated, UJ has broken free from its previous short-term recovery trend at 147.80. At the time of writing, the price is trading below the resistance level of 147.45, with immediate support at 147.30.
The downward trend is strong as it has been unable to extend its potential for price increase above 148.00. Additionally, the 34-day and 89-day EMA continue to reinforce the bearish momentum of this currency pair. This decline is evident.
Currently, the Japanese Yen is attracting some safe-haven flows due to deepening political tensions, while the US Dollar remains weak in anticipation of the Fed's decision. The focus now shifts to the US employment data later in the day.
My target after the USDJPY tests the resistance level at 147.66 (which coincides with the testing of the 34-day and 89-day EMA) is a further decline with a target of 147.08, followed by a breakthrough and touch of the final support level at 146.66.
Wishing you successful trading!

EURUSD tests falling wedge ahead of Eurozone GDPEURUSD stays pressured within a three-week-old falling wedge bullish chart formation as the pair traders await the first readings of German and the Eurozone Gross Domestic Product (GDP) for Q4 2024 early Tuesday. In doing so, the quote fades the previous day’s corrective bounce off the stated pattern’s bottom line while portraying a third consecutive weekly loss so far. It’s worth noting, however, that the recently downbeat RSI and MACD signals suggest weakness in the bearish trend and hence a quick run-up on the upbeat prints of GDP can’t be ruled out. In that case, the previous support line stretched from early November, now resistance around 1.0880, will restrict the immediate upside of the Euro pair. Following that, the falling wedge’s top line surrounding 1.0900 and the 200-SMA level of 1.0935 will be crucial to watch as the final battle points for the bears before giving control to the buyers.
Alternatively, the aforementioned wedge’s lower line of around 1.0800 puts a floor under the EURUSD price. Following that, the 61.8% Fibonacci retracement of the November-December upside, near 1.0760, will precede the 78.6% Fibonacci ratio surrounding 1.0650 to act as the last defense of the pair buyers. In a case where the quote remains bearish past 1.0650, the pair’s lows marked in November and October, respectively near 1.0515 and 1.0450, will lure the sellers.
To sum up, EURUSD portrays a bullish chart formation ahead of the bloc’s key growth data.

EURAUD DAY SELL PROJECTION 29.01.24 Reason Behind the Sell
1. Double the Time Bearish Engulfing In Day Candle
2. Obey the Parallel Downtrend Line
Overall Possible Outcomes
EURAUD SELL 1.6389
SL 1.6470
TP 1.6170

TRIANGLE PATTERN BREAKEDin GBPAUD
A good break out occurred
It will be down for few days
Grab it all forex user good opportunity

USDTHB Price is respecting the supply level and market has retested this zone. Now after the proper breakout of the trendline and breakout of the recent low will look for a short position.

GBPUSD: POST MARKET ANALYSISthe mean threshold of the 1-hour bullish order block was my entry area, but the price moved up as soon as it touched the ob. and my target was the ob in the supply area but the price turned its direction as soon as it touched the 1 hour 0.5 level . this happened in the london session. the new york session capitalised on the reversal and ran down to hunt the 1 hour sellside liquidity

NZDCADGreetings!
Welcome traders.
By choosing to "Follow", you can stay updated with the latest information promptly. Kindly consider clicking "Boost" as well.
Wishing you a pleasant day.

Sell Trade in GBPJPYBased on various data analysis like fib, structure etc. I see a potential sell opportunity in GBPJPY at the marked area.
Kindly do follow your own analysis as this not a trade recommendation.

GBPUSD: Keep bullish faith!Dear friends, The GBP/USD pair is trading steadily around the psychological level of 1.2700 in the early Asian trading hours on Friday. The optimistic GDP growth figures from the United States have boosted the greenback against its rivals.
Next, traders will be monitoring the GfK consumer confidence in the United Kingdom for January. The focus will then shift to the Core Personal Consumption Expenditures (Core PCE) price index of the United States on Friday, expected to increase by 0.2% MoM and 3.0% YoY. Traders will take cues from these numbers and seek trading opportunities around the GBP/USD pair.

GBPUSD: Buy or Sell?Hello dear friends, what do you think will happen to GBPUSD in the near future?
Today, this currency pair is still maintaining a prolonged sideways trend, with short-term prices favoring buying. However, there is still a lack of momentum for this pair to break out of the range as investors shift their focus towards monetary policy announcements from the Federal Reserve and the Bank of England, which are expected to provide the latest direction for GBPUSD.

EURUSD: Price wedge widening, what is the next trend?Dear readers, EUR/USD has once again dropped to a low of 1.0850 as the currency pair continues to fluctuate within familiar levels this week. The downward price trend has pushed the Euro lower against the US Dollar following the ECB's decision to maintain interest rates and better-than-expected US GDP data.
On the 4-hour chart, the currency pair is trading near the lower end of an ongoing consolidation process around the 1.0890 level, indicating a period of consolidation. Support is seen at 1.080. On the other hand, upward price movements may attempt to reach the 1.090 level, but prices could decline further from this area as it completes a test of the EMA 34, 89.
