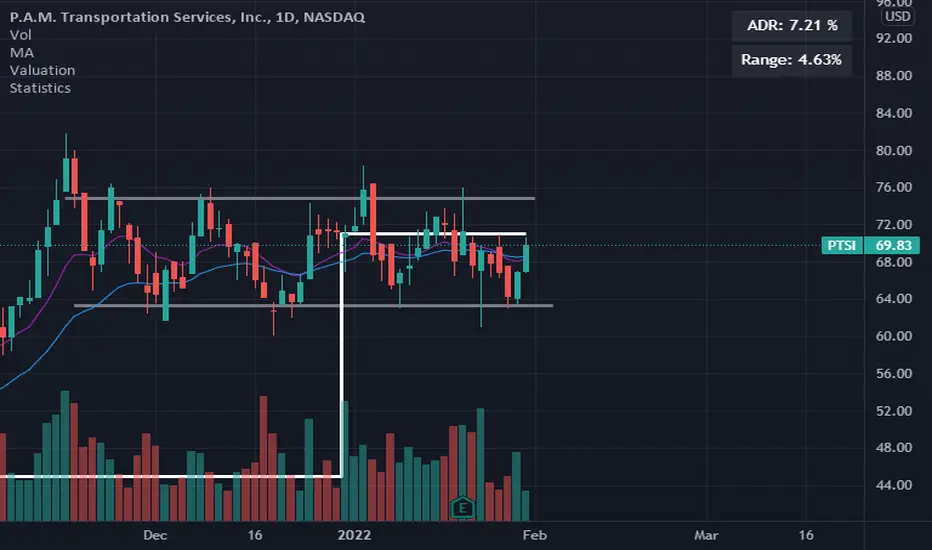
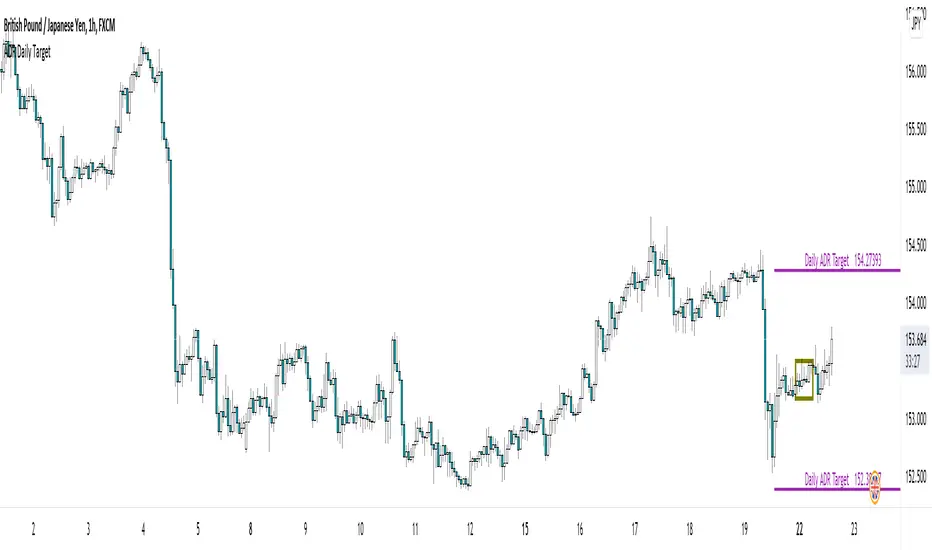
Average Daily Range (ADR) (Multi Timeframe, Multi Period)Average Daily Range (ADR)
(Multi Timeframe, Multi Period, Extended Levels)
Tips
• Narrow Zones are an indication of breakouts. It can be a very tight range as well.
• Wider Zones can be Sideways or Volatile.
What is this Indicator?
• This is Average Daily Range (ADR) Zones or Pivots.
• This have Multi Timeframe, Multi Period (Up to 3 Levels) and Extended Target Levels.
Advantages of this Indicator
• This is a Leading indicator, not Dynamic or Repaint.
• Helps to identify the reversal points.
• The levels are more accurate and not like the old formulas.
• Can practically follow the Buy Low and Sell High principle.
• Helps to keep minimum Stop Loss.
Who to use?
• Highly beneficial for Day Traders
• It can be used for Swing and Positions as well.
What timeframe to use?
• Any timeframe.
When to use?
• Any market conditions.
How to use?
Entry
• Long entry when the Price reach at or closer to the Green Support zone.
• Long entry when the Price retrace to the Red Resistance zone.
• Short entry when the Price reach at or closer to the Red Resistance zone.
• Short entry when the Price retrace to the Green Support zone.
• Long or Short at the Pivot line.
Exit
• Use past ADR levels as targets.
• Or use the Target levels in the indicator for breakouts.
• Use the Pivot line as target.
• Use Support or Resistance Zones as targets in reversal method.
What are the Lines?
Gray Line:
• It the day Open or can be considered as Pivot.
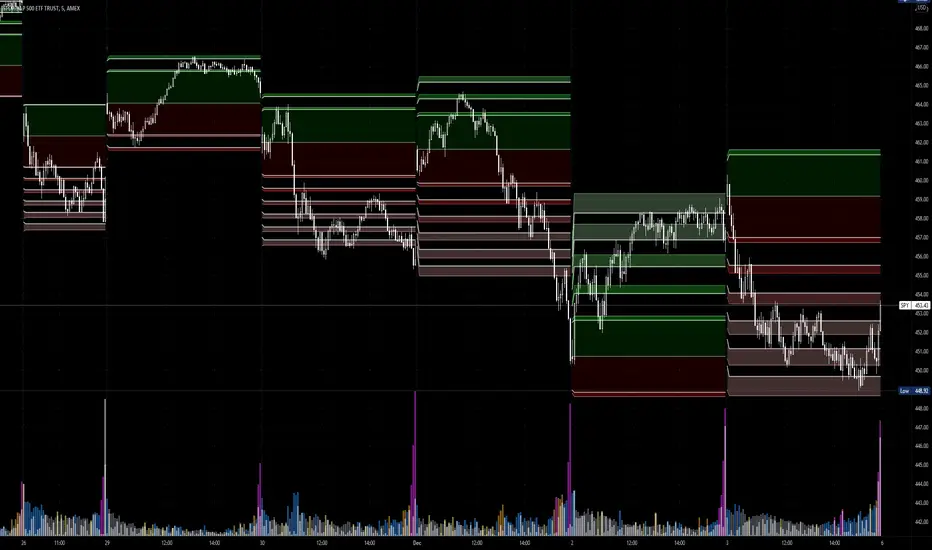
Red & Green ADR Zones:
• Red Zone is Resistance.
• Green Zone is Support.
• Mostly price can reverse from this Zones.
• Multiple Red and Green Lines forms a Zone.
• These lines are average levels of past days which helps to figure out the maximum and minimum price range that can be moved in that day.
• The default number of days are 5, 7 and 14. This can be customized.
Red & Green Target Lines:
• These are Target levels.
What are the Labels?
• First Number: Price of that level.
• Numbers in (): Percentage change and Change of price from LTP (Last Traded Price) to that Level.
General Tips
• It is good if Stock trend is same as that of the Index trend.
• Lots of indicators creates lots of confusion.
• Keep the chart simple and clean.
• Buy Low and Sell High.
• Master averages or 50%.
ADR

ADR% / ATR / Market CapDisplays the following values in a table in the upper right corner of the chart:
ADR%: Average daily range (in percent).
ATR: Average true range (hidden by default).
Market Cap: Total value of all a company's shares of stock.
All values are calculated based on daily bars, no matter what time frame you are currently viewing. Doesn't work for time frames >1D, which is why the table is not shown on weekly/monthly charts.
Credit to MikeC / TheScrutiniser and GlinckEastwoot for ADR% formula, and ArmerSchlucker for the original script which includes LoD Dist . instead of Market Cap.
Three Legged GooseThree Legged Goose
Three-Legged Goose is an all-in-one intraday trading system.
It features a sleek and customizable Opening range overlay with infinitely generating price targets, Average Daily Range Zones, Curated Anchored VWAPs, Total Volume and ATR analysis, as well as our state of the art Market Momentum Trend detection.
Three-Legged Goose also has important Daily levels, including the Previous Day's High and Low and the Current Days Open, three fully customizable Exponential Moving Averages, a customizable ema cloud, and a toggleable standard vwap.
Using this indicator allows you to get rid of any unnecessary indicators that are taking up those valuable slots in TradingView.
AVWAP + ORBS:
The Opening Range Breakout system builds off of our recommended 15min opening range and does all of your price target calculations based on the width of the opening range. These targets are fully customizable within the settings,
to allow fine-tuning from ticker to ticker. We have programmed three Anchored vwaps at different time intervals to act as a dynamic trend-finding instrument. These, along with the opening range breakout system, can help you quickly spot the day's trend and dynamic support and resistance long before your standard moving averages have caught up with price intraday.
Average Daily Range Zones:
We believe these zones to be essential to trading, especially with our system. These zones tend to act as areas of major support and resistance as well as give an idea of the projected volatility of the underlying.
Market Momentum Trend Detection:
We paint our momentum analysis directly on your candles. By taking the overall Market Internals + the underlying's Price movement, we can determine areas where we feel comfortable adding risk on or taking risk off.
This will help those that struggle at identifying trends and valid reversals.
All of the default settings are our recommended settings.
Please check the Author Instructions Below for how to gain access to our indicators.
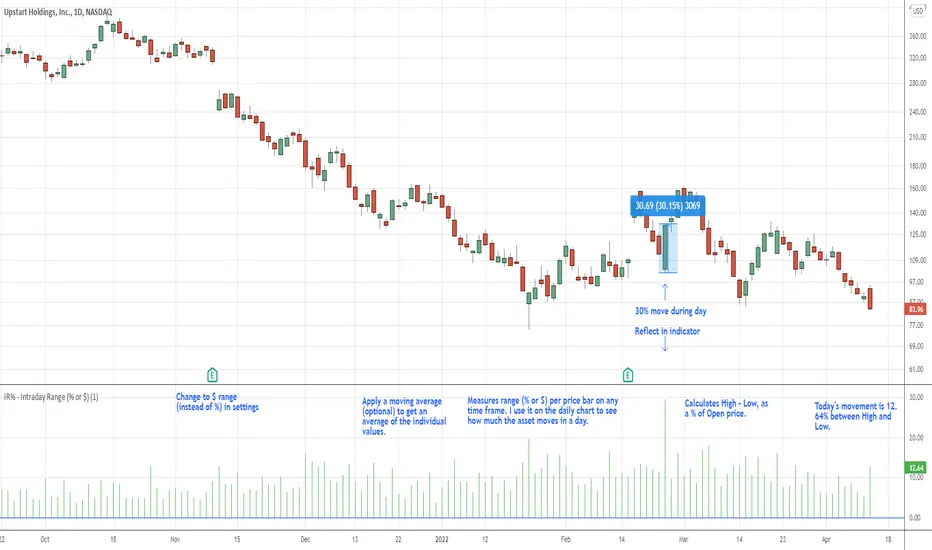
IR% - Intraday Range (% or $)Shows the percentage difference between the High and Low of the price bar expressed as a percent of the Open of that bar. In the settings, you can change to Price Change instead of percent change. This will show the price change between the High and Low for each price bar.
It can be used on any time frame.
I use it on the daily chart . I note the daily figure, and that lets me know how far the price tends to move during a typical day (no gaps included).
If using on another time frame other than the daily, then it is an intrabar calculation, not intraday.
Apply a moving average to it to see the average intraday movement after the open when using a daily chart .
The IR% of a 1-minute chart tells you the price range of that one-minute price bar, and a weekly chart will show the price range of each weekly price bar.
It only measures high to low versus the candle's open price. It does not include gaps between candles, which makes it different than the ATR. ATR is more useful for swing trading, where the trader may be holding through gaps in price, and thus wants to factor them in.
The IR% is useful for day traders because it shows how much a stock tends to move during the day (intraday range), when using a daily chart . ATR is not as effective for this because it includes gaps, which day traders can't generally capitalize on.
If the IR% is fluctuating between 5% and 10% over the last 50 days or so (on the daily chart ), day traders know that AFTER the open, the price is likely to move 5% to 10% from high point to low point. This can help with establishing profit targets, seeking out stocks that tend to move a lot within the day, or avoid these types of stocks if they are undesirable to you. Seek out low IR% stocks if you prefer lower movement during your selected time frame.
A stock may have an ATR% of 5% but ATR doesn't tell us if that movement occurred after the open or includes a gap. Some stocks are prone to gaps. They may gap 4% most days, and then only move 1% during the day. This will still be a 5% ATR%, but most of that movement ISN'T capturable each day. The IR% for this stock would only be 1%, not 5% like the ATR suggests.
I developed this because I like day trading volatile stocks, and I wanted a measure that ONLY includes movement during the day, and doesn't include price gaps in the calculation. Because as a day trader, gaps don't matter to me. I can only make money on what happens during the day, after the open.
It is similar to another indicator called Average Day Range (ADR). Although most ADR calculations are already calculated as an average (so I don't see each individual value) or plots things on the chart. This may be useful for some people, but I wanted to see the data on each price bar, have the option to add a moving average or not, and not have anything plotted on the price chart. It also nice to be able to flip from % to $ dollar movement if desired.
ADR in 0.5 / 1 / 3 / 5top of the morning!
This indicator is a tiny bit different then the previous one i published.
As per my little study into the ATR, i have decided to remove it out of my indicator and instead put in a half an ADR in dollar vallue.
For me, i can use this value to check at what level i would like my stop. The next evolvement of this indicator might be a total new one since i'd be one for a lower timeframe with the 0.5 and 0.3 adr down from current high otd.
Hope you enjoy it,
Peace

[DisDev] Level by LevelThis indicator's main objective is to provide you with the ability to chose the levels you are interested in , with the added functions of:
Level-by-Level Chart Reducer – This allows you to choose how many levels are above and below the current closing price to display.
Level-by-Level Table – This allows you to display all the levels within a table onto the chart.
The basis of this indicator is to provide you with a toolbox of levels that you can add to your trading plans.
Psychological Levels
A weekly range established each Saturday evening that can be thought of as a weekly "IB" or initial balance.
Average Daily Range ("ADR") & Average Weekly Range ("AWR")
In Forex, the International Monetary Fund ("IMF") controls the allowable weekly swings of a currency's price. The "AWR" and "ADR" perform calculations and dynamically adjust until the range is exceeded, at which time the levels will lock into place for the remainder of the day or week. The accepted theory is that price (even in Stocks and Crypto) will adhere to and remain within these levels, and, if exceeded, will revert back to them.
Initial Balance ("IB")
In Crypto trading, it is generally accepted that the High and Low of the first hour of each day (00:00 - 01:00 UTC) is the Initial Balance . The IB generally thought of as a zone that sets the tone for the rest of the trading session. It is often a time of high volume and volatility, with Stop Hunts at the highs and lows of a range before price moves in one direction or the other. The IB is a Market Profile concept introduced by Peter Steidlmayer. There is plenty of information on the Internet to learn more about IB's and how to implement them -- please do your own research.
Daily Open
Since Crypto is traded 24 hours per day, the generally accepted open is 00:00 UTC, the Tokyo open. Please refer to Part 1 for more details on sessions, starting times, conversions, and Daylight Savings Time.
Volume Weighted Average Price (VWAP's)
VWAPs are important areas on a chart. Institutional traders generally do not want to move price too far as they enter large buy or sell orders. So they wait for price to reach a tight zone around the VWAP where the majority of transactions occur on the Daily, Weekly, or Monthly timeframes. In these areas, there will be plenty of supply and demand for the institutional trader to execute their trades.
Weekly Open
The weekly open is Monday at 00:00 UTC.
Pivot Points (Support & Resistance)
This indicator calculates pivot levels based on a tested formula that calculates past and subsequent bars or candles. It displays the two closest to price pivot levels. The pivot formula takes a window of left bars and right bars, and then finds the highest or lowest value in that window. The window marches across the bar-set to discover the pivots.
We coded the script to label the levels and colors dynamically, either Support (Green) or Resistance (Red), depending on whether they are above or below price. The primary level line stays with the same color scheme:
Blue = Daily / Yellow = Weekly / Violet = Monthly
As price crosses the level:
1 - The label will switch from Support to Resistance and Resistance to Support
2 - The extender line will switch from Green to Red and Red to Green
3 - The same changes will take place in the Level-by-Level Coordinates Table
A Note on Levels and Data
Understanding How Data is Calculated and Presented
Calculating levels requires going back in time through a symbol or asset’s historical data. Time is measured by bars (candles), so depending on the chart's resolution (timeframe or TF) you are viewing, a different number of bars would be required to measure the same level.
For example, if we want to mark the Daily High and Low on the daily TF, we would be measuring 1 bar or candle. If we drop down to the 1-hour TF, we would need to measure 24 bars. For the 15-Minute TF it would be 96 bars (1hr/15min=4 bars per/hour and 4 x 24 = 96), and on the 1-Min TF, it requires 1,440 bars (1hr=60 Min and 6 x 24 = 1,440).
Hopefully, you get the idea and can see that the number of bars required increases exponentially as we move to weekly, monthly, and yearly levels.
TradingView Data
Please note this statement from TradingView's website:
"The length of historical data for any intraday interval (i.e. chart timeframe) is 5,000 bars/candles (for Pro and Pro+ account holders it is doubled to 10,000 bars/candles and for Premium holders it's quadrupled to 20,000) + additionally several bars/candles back to the beginning of the week, month or year (depending on the resolution). Unfortunately, this limit cannot be extended for now due to technical reasons. At lower resolutions (<30Min) Yearly and Monthly VWAPs may not show, but to overcome this issue the “Plot Save” function has been added to the settings to allow the user to manually input these levels. This concept is the same for Daily, Weekly, and Monthly pivots.
If you change the chart interval to daily or daily-based, you will see a longer date range. We display all available data for daily-based intervals."
How we Handled Data Limitations
The Plot Level Feature in the Level by Level Indicator
We have written this script to always show levels at the lowest time frame allowable by TradingView.
If you do not see specific Support or Resistance levels, switch to a higher time frame, enter the corresponding values in the provided fields on the input panel, and check the Plot box. This will hard code the level in and will print on any TF. Additionally, we coded it so that when the Plot feature is enacted, the calculated level will be disabled so that there are no overlaps of two levels being printed.
Legend
The logic behind the line styles:
Solid = Static or established
Dashed = Static but previous week or day
Dotted = Dynamic or still developing -- will turn solid once the values are locked in
*VWAPs would technically be a dotted line since they are fluid, however, TV does not handle the dots or dashes of a curved line well so we chose to keep this solid
Level-by-Level Table
We designed this table to provide the user with a view of the levels in the correct price sequence on the chart at all times since, depending on the resolution and zoom levels, it would typically not be possible. The levels are equidistant and do not align with the actual price.
The current price will move vertically through the table according to the actual price and its relative position to the other various levels. The levels will change price and line styles dynamically as well.
The current price rectangle and the border can be in sync with High Volume Candle colors to draw more attention to the chart during climatic volume events.
Settings & Options - Levels & Labels
Levels will show a faint line through price to the point of origin.
Labels will show a brighter line extended to the right of price.
The values (10, 20, 30) are the length of the extensions; they are staggered to avoid overlaps.
Settings & Options - Level Reducer
The Level Reducer gives you the ability to declutter your chart, but still have the indicator track all the selected levels.
With four Lines selected, for example, the indicator will give you the nearest four lines above price and the nearest four below price. The Table runs independently of the chart, so if you want to see eight levels as an example, the Table will show eight above and eight below price.
As the current price changes, the lines will dynamically change accordingly.

ADR - Average Daily Range With ForecastI always liked the MT4 ADR indicator that was going around but never found a decent port of it in tradingview. I also noticed that the way most people were doing the ADR calculation using SMA was not always accurate and that bothered me so I decided to write one from scratch which gave a very specific ADR calculation.
On the MT4 version it would project ADR targets on the high and low side. While I liked that I thought it could be improved upon by determining orderflow and anchoring to the perceived low of day to give you a more realistic target.
I also included a percentage of current ADR as well as changed the color to red once ADR was hit.
Configuring is very simple:
Max Timeframe To Display: you can set what timeframes to show adr (I know tradeingview lets you set this now but I still like it here)
Display Average Range As FOREX pips: Some Instruments use whole numbers so you can toggle if you need too
ADR Length Parameter: Sets Number of Days Lookback to Calculate ADR
I hope you enjoy it.

Swing Dream - PAINT BARS | MA | EMA | DMA | VWAP | TABLE | ADR %- Swing Dream -
Script created for breakout-swing traders, in the style of QullaMaggie * , Dan Zanger, Oliver Kell, and Stockbee.
The following indicators are used by most successful breakout-swing traders such as mentioned above.
(As published) it contains:
Painted Bars, also known as inside/outside candles. Used for candle analysis and to determine breakout pivots & levels. For instance; use it in different timeframes and seek formations (ex, 3-1-2). For further inspiration, study Rob Smith's The Strat .
MA, Simple Moving Averages (Basic levels = 10,20,50,200). Use this indicator to define resistance/support areas as well as the overall long/swing-term trend. In breakout strategies such as EP, Flags, etc this can be used for trailing stops; an example, post-breakout, let the price ride the 20ma before exiting your position.
EMA, Exponential Moving Averages with periods inspired by Qullamaggie (10,20,65). Use this on shorter timeframes (ex, 1h) and for the same principles as MAs.
VWAP, Volume-Weighted Average Price. As for the previous, utilize this as a level indicator to find areas of resistance/support. Good for swing-trading as it implies whenever holders are profitable or not.
DMA, Displaced Moving Average (Horizontal). Personally, I use this a lot. Works very well for trailing stops (post breakout) and "bounce" areas. Choose your own offset and period.
ADR%, Average Daily Range Percentage. Displayed in the table and used to define a symbol's volatility. A very good tool for Qullamaggie-style trading. Personally, I try to find setups with over 6% ADR. Basic definition; low ADR% = Increased chance of a symbol to move slower and in smaller ranges. A higher value equals the opposite.
Table. A table with basic symbol-related information. Could save you plenty of time whenever you scan or search for new swing setups. Looking to add more features here.
Why should you use this script? Well, instead of having tens of different indicators, use this script and combine everything together with EP, Flag, or breakout principles. Suited for every plan, and more efficient in my opinion.
View settings to turn on/off different indicators.
* If you're looking for an introduction and further explanation of how Qullamaggie uses mentioned indicators, I could recommend checking out his website, stream, or participation in "Chat With Traders".
At last, I want to credit: @jkcqld @neolao @TheScrutiniser
This Script will get updated and improved.
// TechFille006

Imbalance, ADR Daily Target & ADR > 3X1 x ADR Movement Calculated on the Asian Session - Times can be altered to suit your parameters
Daily Target is set High from low of Asian Range and Low from High of Asian Range
0-3X ADR Calculated and Displayed from a point you select for the following days targets - can be set Bearish or Bullish and ADR parameters can be altered
Imbalance Finder - Can be switched on or off to show imbalance on current time frame - default is off

1 *ADRHighlights 1 ADR from High and - or Low of the day -
Helps to identify areas where your trade may reverse in the day
ADR PercentUses past 5 day's daily average ranges and calculates average ADR percentage with respect to latest day's open
Acknowledgement - Uses code from another excellent indicator from critian.d

Ticker Dashboard For Better Stock SelectionHey, this indicator will help you with your stock selection. The goal is to focus on stocks that move (higher ADR) and provide enough liquidity which means less risk.
ADR - Average Daily Range in % (measured from High to Low - does not include gaps like ATR does / Threshold color can be adjusted from input)
%Change - Current % change from prior close price
Vol- Todays Volume in MIO
ADV- Average Daily Volume in MIO - default set to 1 month (20 days, can be changed from input - Colored red if < 1 MIO)
$VOL- Dollar Volume - Average Daily Volume multiplied with the last daily close price. Important for liquidity issues.
TTT ADR PointsHello dear traders from all over the world!
As many of you are already aware, our team has consistently been developing technical weapons that are practical and well-adaptable to the contemporary financial market. This time we have come up with a powerful indicator that aids daily traders by spotting entries with high win-rate and low frequencies (which is good since it sensitively filters out when small amount of uncertainty is detected).
We introduce our cutting-edge trading logic, “TTT ADR Points”.
Our new indicator shows supports and resistances on the chart and our recent verification and validation tests confirmed relatively high performances. In addition, this can also act as a strong and reliable guideline that signals traders how to react when the market turns out to be against the current position.
“TTT ADR Points” has been generated utilizing the fundamental methodology of ‘Pivot Points’ and ‘ADR (Average Daily Range)’. Numerous experiments and back/forward tests has validated that the trading spots provided by this algorithm are quite endurable even when price momentum and volatility are high. Furthermore, traders are likely to close their position at their average entry price even when the market trend and price actions flow unexpectedly. This technical indicator is particularly useful for future commodities such as Nasdaq, Gold, and Crude Oil, rather than Bitcoin and crypto.
How to use this indicator?
Inner area of the green lines indicates area of support while that of the red lines indicates area of resistance.
Traders are to open long position in the green area and short position in the red area.
Orange and red lines with small pips can be considered as target prices for profit. (Small range of pips are recommended to be used for targets and stoplosses when using this indicator since this is mainly for daily traders).
If the green and red area become narrower, it can be interpreted as a signal to expect more volatility possibly in the next few candles. This logic might not be very preferable for conservative traders and for those with small account.
What should we do if the market ignores the supports and resistances?
Traders are recommended to set stoploss below the area for exit tactic and re-enter on the very next candle. There is a very high probability that traders can enter one more contract and close their position at average entry price or with profit.
This is a beta version. If you want to participate in the beta version for free, please leave a comment below or DM to this account or through our community.
Thank you. Your subscriptions, likes, and comments are highly appreciated.
안녕하세요 트레이더 여러분. 토미 트레이딩 팀의 토미입니다.
많은 분들이 이미 알고 계시듯이, 저희 팀은 현대 금융 시장에 실용적이고 잘 적응할 수 있는 지표들을 꾸준히 개발해 왔습니다.
그리고 이번에는 승률이 높고 매매 횟수가 적은 트레이딩을 위한 강력한 지표를 개발했습니다.
이번에 저희가 개발한 기술적 지표, “TTT ADR Points” 를 소개합니다.
저희의 새로운 지표는 차트에 지지와 저항을 보여주며 최근 백/포워드 테스트에서 비교적 높은 성과를 확인했습니다.
비상식적이고 두 눈으로 보고도 믿기지 않을 가격 모멘텀 및 변동성이 난무하는 요즘 21세기 금융시장에서도 높은 확률로 성공적인 거래를 할 수 있고 만약 시장이 반대로 움직이더라도 적어도 본절가/익절가로 트레이딩을 할 수 있는 지표입니다.
'TTT ADR Points’는 Pivot Points(피벗 포인트)와 ADR(Average Daily Range)을 활용하여 강한 지지/ 저항을 나타낸 지표를 개발했습니다.
또한 해당 지표는 비트코인보다 해외선물(나스닥, 골드, 오일 등)을 맞춰 설정되어 있습니다. 해외선물에서 자동 틱 익절 / 손절을 통해 뇌동매매를 방지하실 수 있습니다.
지표 사용법입니다.
초록색 선 안쪽 부분들은 지지 구간이며 빨간색 선 안쪽 부분들은 저항 구간입니다.
초록색 선 안쪽 부분들에서는 공매수 포지션을 잡으셔야 하며 빨간색 부분에서는 공매도 포지션을 잡으셔야 합니다.
이때 익절은 주황색 부분이나 빨간색 부분에서 하시거나 성향에 맞게 틱 단타를 하셔도 됩니다. (저희는 틱 단타를 추천드립니다).
초록색과 빨간색 부분의 사이가 좁아지면 향후 큰 변동성이 온다는 것을 암시합니다.
그러므로 보수적인 분들이시라면 (혹은 증거금이 적으신 분들이시라면), 해당 구간에서는 매매를 하시면 안되겠습니다.
만약 지지 저항을 무시하면 어떻게 대응을 해야할까요?
짧게 손절라인을 가져가시거나 바로 다음 1시간봉 기준 다음캔들에서 1계약을 더 재진입해 본절 또는 익절로 포지션을 마감할 수 있는 확률이 매우 높습니다.
해당 버전은 베타 버전입니다. 무료로 베타버전에 참여하실 분들은 아래 댓글로 텔레그램 아이디를 남겨주시거나 저희 커뮤니티 통해 메세지 주시기 바랍니다.
베타버전이므로 같이 연구하실분들을 모집합니다.
감사합니다. 여러분들의 구독, 좋아요, 댓글은 저희에게 정말 큰 힘이 됩니다^^

Average Daily Range Fibonacci LevelsThe Average Daily Range is a simple concept, calculated as the difference between daily highs and lows averaged over some period. This indicator uses that range in conjunction with Fibonacci ratios to create zones centered on the day's open that tends to act as areas of support and resistance.
The thicker White lines are the ADR levels; all other lines are the same value adjusted by the various Fibonacci values.
A simpler version of this concept can be seen in my other script, Average Daily Range Zones, which does not include the Fibonacci ratio zones.
Thanks to @Hank Hill for the original idea and TV for the feedback and support on the use of the security() function.
Also thanks to @GoldenCross for the Fibonacci obsession.
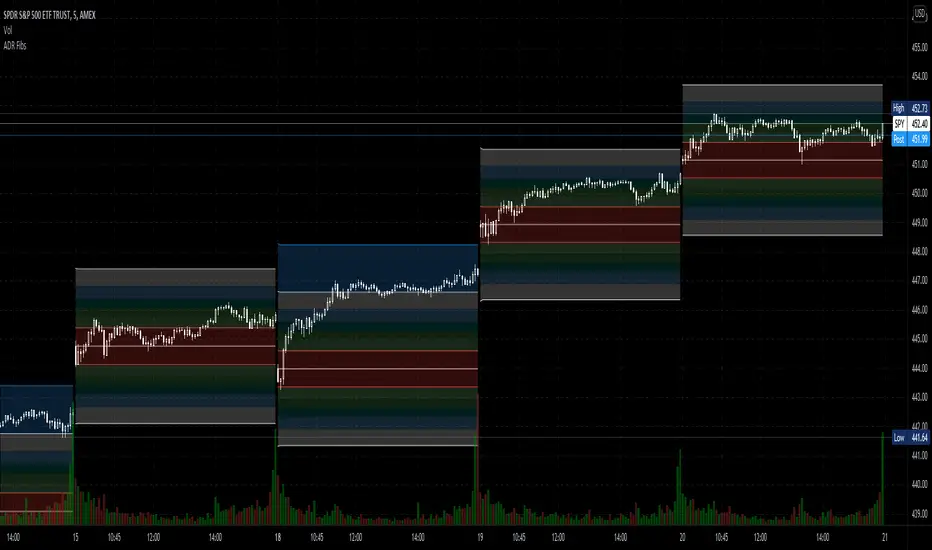
Average Daily Range ZonesThe Average Daily Range is a simple concept, calculated as the difference between daily highs and lows averaged over some period. This range is is overlaid and centered on the day's open, and tends to act as areas of support and resistance . This indicator provides two aggregation periods, creating a range that represents volatility in the ADR; a wider spread indicates greater recent volatility , and vice-versa.
Thanks to @Hank Hill for the original idea and ToS script this is based on, and TV for the feedback and support on the use of the security() function.
ADR% / ATR / LoD dist. TableDisplays the following values in a table in the upper right corner of the chart:
ADR%: Average daily range (in percent).
ATR: Average true range (hidden by default).
LoD dist.: Distance of current price to low of the day as a percentage of ATR.
All values are calculated based on daily bars, no matter what time frame you are currently viewing. Doesn't work for time frames >1D, which is why the table is not shown on weekly/monthly charts.
Credit to MikeC / TheScrutiniser and GlinckEastwoot for ADR% formula

Position Sizing w/ ADR&ATR TrackingScript to use for position sizing based on portfolio size, max position, and max loss inputs. The option to use custom entry and stop are available, but default to last price for entry, and Low of Day (LoD) for stop. The ATR % is a measure of the low of day to current price as a percentage move.
Credit to LonesomeTheBlue for the base code on position sizing and TheScrutiniser/GlinckEastwoot for ADR formula
-Nelgoth, best of luck

5 Day ADR ICT Intraday Tracker + Timeframes, Alerts, BarcolorsThis indicator gives you a hint on hypothetical room left for a trade by tracking todays current range as a percentage of the 5 Day ADR.
Look for entries in yellow and orange zones and exits on dark blue once the ADR is reached.
I just added a Timeframe, Alerts for High and Low Zones and an option to colorize the Bars/Candles to "5 Day ADR ICT Intraday Tracker" by BryceWH
tradershedge
Dear Traders,
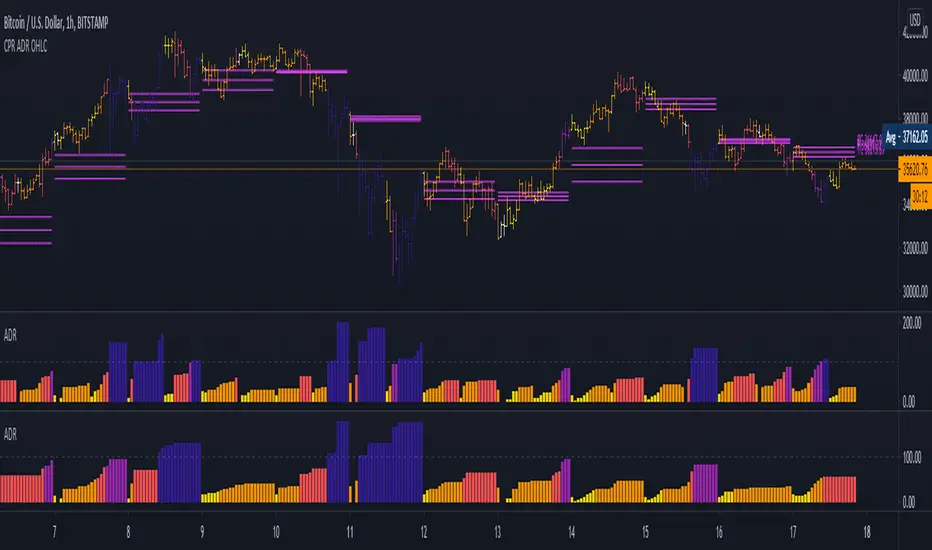
This script will get a smile on most of the pivot and price action traders.
My trading skills have drastically improved after learning the concepts of central pivot point, supply and demand and more importantly understanding of the simple candle stick patterns.
This is my experiment of decoding the above mentioned concepts to simple trading setups which can be used across any instruments and across any timeframes.
The most essential and must skills required in order to achieve profits in trading is to identify the right trend, exact entry and exits, risk management and importantly understanding the market structure along with the traders emotion.
Let’s just decipher each of the essential skills along the tools we will be using for analyzing each of the section
TREND ANALYSIS
Central pivot range ( CPR ) : is used to identify the market structure and the major trend of the instrument you are going to trade. This will help in identifying the mean reversions & trending trade setups in the market.
Developing Dynamic Pivots & Future Targets
This setup will help us in decoding the closing and opening market sentiment and will help us in planning our trade upfront. This home work in post & pre-market session will increase the odds of the trade in our favor to a great extent.
Trend Identification & Dynamic Support & Resistance
I have also included the Pivot based exponential moving average (PEMA) to visually identify the current trend and it also shows the current trend by dynamically changing the colors for bull & bear market in the PEMA zone.
VALUE AREA
We know that the market works on supply and demand and when the price arrives at these zones the market reacts very faithfully. Hence it’s very important for a trader to know in advance where these levels exist before entering the market.
This Indicator bridges this gap by showing in advance the future value areas where the price reaction can be expected and trades can be planned accordingly. Hence it can anticipate the market move with a strong logic behind us rather than leaving the trader in surprise.
This value area zone will be highlighted in different colors on the chart will be grab your attention and help in planning your trade accordingly.
Market Sentiment
Each market session is a story in itself which is been scripted by the movements of each candle sticks, hence if we understand the relationship between each candles as it is getting formed we can predicate the future candle stick formation to a great extent.
i have coded the indicator triggers which reads the relationship between each candles and shows signals of reversals and also give traders alerts when the price rejection occurs.
Various shapes of rejection signs are plotted for bullish and bearish reversals which help in prediction the strength of the price rejection which will help the trader in planning his trade.
The various shapes in the order of strength are diamond, square, arrows, and triangle respectively.
Entry & Exits
The volatility is the key in predicting the market movement. If we identify the trend correctly then all we have to do is set our expectations accordingly for the targets based on the volatility of the instrument.
The indicator basically captures the recent volatility for the specified look back period and plots across the possible price movements for the current session.
Based on your entry setups you can get a reference of the maximum targets we can expect with the help of the levels the indicator plots.
Please do feel free to use the indicator and give your valuable feed backs which will help me in optimizing it to a great extent.
I am in the process of optimizing the price triggers to a greater extent and also dynamically plot the possible demand and supply zones in coming future.
I would love to thank each of the traders in this TradingView community in helping me improve on my trading skills.
Happy Trading !

ADR% - Average Daily Range % by MikeC (AKA TheScrutiniser)This applies a 'corrected' formula to the version created by alpine_trader (which is slightly off). It calculates the Average Daily Range (in percent) over the previous 20 periods and plots it in a chart.
I am grateful to GlinckEastwoot for the 'corrected' formula.

Institutional PivotsToday I propose a novel idea of plotting pivots, this can be also considered as Value areas/Noise areas.
*What is it?
Its a simple concept of gauging price action with respect to its most time spent in a particular range, this is usually denoted as Value area in the Market profile concept, where that "most" word is represented by 70% of the price action.
*What's different from the Market Profile?
Market profile is dependent on real time price movement to complete to see the value area or noise area to plot a static area, there is always a possibility of it shifting as price may move outside of it, and hence its called "developing value area", till of course session is closed and plot is finalized.
While that method is solid indication of "actual price profile" development, it lacks when it comes to offering traders a more stable view to enable them to make decisions. And therefor, when traders trade MP they are usually limited by the number of trades they can take.
This is the main reason as to why traders prefer to use other methods like Pivots/ORB/Range-breakouts over pure MP charts, even though latter reduces the possibility of wrong estimations of "support/resistance working/holding".
*Why the name Institutional Pivots?
In my research I've found that these Pivots/Value area/Noise area ranges are often the areas watched by the big players who trade breakouts or mean reversion strategies, so while that name may sound dubiously clickbaity, it is indeed intended to represent an observation. I know how that sounds, but you can choose to ignore it if you do not agree or see good results after using it. After all, its free to use for everyone.
*Nomenclature/colors and settings?
Noise area/Value area/Central Pivot area - Designated with Yellow labels, in which NU represents the Upper level and ND represents the Lower level
Targets - Target calculation mechanism is based on " today's price action" and today's Open, D1 and D2 represent down targets for the day and U1 and U2 represent upper targets. Please note that this is independent of the "Noise area/Value area/Central Pivot area", so overlap of levels is possible. AND if overlap happens, that's an indication of more strength at S/R line/area for the price.
One more thing to note here is that if there is formation of the new low or new high in the day, those levels will change as their calculation gets influenced by the same. This is NOT a repaint issue, this is SHIFT/FORMATION OF THE NEW levels and it's an "intended" behavior.
Open and POpen - Open represents open of the time-frame selected and POpen represents previous open of the time-frame.
Lable's starting with "H" are indicating higher Timeframe levels, levels which are same as above.
ATR based targets - When you enable this in settings, you will get target calculation based on ATR (self explanatory)
Full ATR mode - When you enable this option, you will get both Noise area as well as targets based on ATR, please don't forgot to turn off the ATR based targets when you enable this, as they conflict with each other.
I've not kept lines, area plots or even price levels as I feel it's just noise and takes away from the indicators main focus, please don't ask to add them, I'll not.
This is meant as purely educational idea, if you use this to trade, it is at your discretion and responsibility will be yours alone.
Past performance is not assurance of the future performance.
More example chart/s

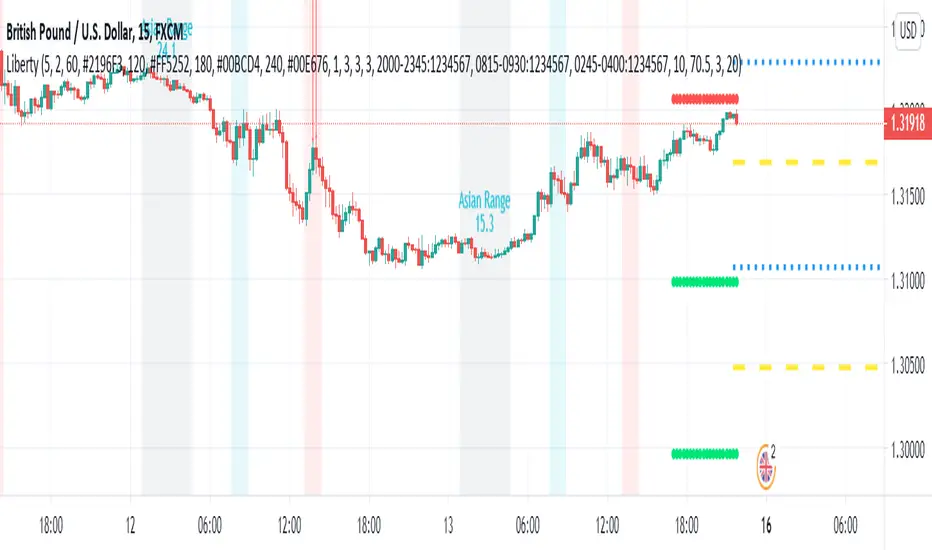
Liberty Scanner This indicator scans the market for New York session entries based on trend and fibs.
The indicator also detects killzones, which are basically supply and demand zones. We like to think of these as areas of which banks are placing their orders.
The indicator also gives you the Asian range and how many pips the market has moved for the Asian range, that is what determines whether we are in normal market conditions or not.
We also made it to where you can see yesterdays highs and lows, when you understand the market directions then you typically know which swing (high or low) will be broken.
The indicator also has an ADR (Average Day Range) feature where it calculates the "average" amount of pips the market moves per day based on the previous 3-10 days of the market volatility.
The main thing which gives us signal for entry is the New York session Fibonacci levels in which it automatically scans for the nearest 15 minute swing and it'll give you an entry based off of that.
*This indicator in no way is meant to be 100% accurate, please do your own analysis before placing any trades and trade with proper risk, as this market is extremely volatile and risky. Past profits don't guarantee future results*
FOR ACCESS: Please send us a private message to gain access to this indicator.