BOCS AdaptiveBOCS Adaptive Strategy - Automated Volatility Breakout System
WHAT THIS STRATEGY DOES:
This is an automated trading strategy that detects consolidation patterns through volatility analysis and executes trades when price breaks out of these channels. Take-profit and stop-loss levels are calculated dynamically using Average True Range (ATR) to adapt to current market volatility. The strategy closes positions partially at the first profit target and exits the remainder at the second target or stop loss.
TECHNICAL METHODOLOGY:
Price Normalization Process:
The strategy begins by normalizing price to create a consistent measurement scale. It calculates the highest high and lowest low over a user-defined lookback period (default 100 bars). The current close price is then normalized using the formula: (close - lowest_low) / (highest_high - lowest_low). This produces values between 0 and 1, allowing volatility analysis to work consistently across different instruments and price levels.
Volatility Detection:
A 14-period standard deviation is applied to the normalized price series. Standard deviation measures how much prices deviate from their average - higher values indicate volatility expansion, lower values indicate consolidation. The strategy uses ta.highestbars() and ta.lowestbars() functions to track when volatility reaches peaks and troughs over the detection length period (default 14 bars).
Channel Formation Logic:
When volatility crosses from a high level to a low level, this signals the beginning of a consolidation phase. The strategy records this moment using ta.crossover(upper, lower) and begins tracking the highest and lowest prices during the consolidation. These become the channel boundaries. The duration between the crossover and current bar must exceed 10 bars minimum to avoid false channels from brief volatility spikes. Channels are drawn using box objects with the recorded high/low boundaries.
Breakout Signal Generation:
Two detection modes are available:
Strong Closes Mode (default): Breakout occurs when the candle body midpoint math.avg(close, open) exceeds the channel boundary. This filters out wick-only breaks.
Any Touch Mode: Breakout occurs when the close price exceeds the boundary.
When price closes above the upper channel boundary, a bullish breakout signal generates. When price closes below the lower boundary, a bearish breakout signal generates. The channel is then removed from the chart.
ATR-Based Risk Management:
The strategy uses request.security() to fetch ATR values from a specified timeframe, which can differ from the chart timeframe. For example, on a 5-minute chart, you can use 1-minute ATR for more responsive calculations. The ATR is calculated using ta.atr(length) with a user-defined period (default 14).
Exit levels are calculated at the moment of breakout:
Long Entry Price = Upper channel boundary
Long TP1 = Entry + (ATR × TP1 Multiplier)
Long TP2 = Entry + (ATR × TP2 Multiplier)
Long SL = Entry - (ATR × SL Multiplier)
For short trades, the calculation inverts:
Short Entry Price = Lower channel boundary
Short TP1 = Entry - (ATR × TP1 Multiplier)
Short TP2 = Entry - (ATR × TP2 Multiplier)
Short SL = Entry + (ATR × SL Multiplier)
Trade Execution Logic:
When a breakout occurs, the strategy checks if trading hours filter is satisfied (if enabled) and if position size equals zero (no existing position). If volume confirmation is enabled, it also verifies that current volume exceeds 1.2 times the 20-period simple moving average.
If all conditions are met:
strategy.entry() opens a position using the user-defined number of contracts
strategy.exit() immediately places a stop loss order
The code monitors price against TP1 and TP2 levels on each bar
When price reaches TP1, strategy.close() closes the specified number of contracts (e.g., if you enter with 3 contracts and set TP1 close to 1, it closes 1 contract). When price reaches TP2, it closes all remaining contracts. If stop loss is hit first, the entire position exits via the strategy.exit() order.
Volume Analysis System:
The strategy uses ta.requestUpAndDownVolume(timeframe) to fetch up volume, down volume, and volume delta from a specified timeframe. Three display modes are available:
Volume Mode: Shows total volume as bars scaled relative to the 20-period average
Comparison Mode: Shows up volume and down volume as separate bars above/below the channel midline
Delta Mode: Shows net volume delta (up volume - down volume) as bars, positive values above midline, negative below
The volume confirmation logic compares breakout bar volume to the 20-period SMA. If volume ÷ average > 1.2, the breakout is classified as "confirmed." When volume confirmation is enabled in settings, only confirmed breakouts generate trades.
INPUT PARAMETERS:
Strategy Settings:
Number of Contracts: Fixed quantity to trade per signal (1-1000)
Require Volume Confirmation: Toggle to only trade signals with volume >120% of average
TP1 Close Contracts: Exact number of contracts to close at first target (1-1000)
Use Trading Hours Filter: Toggle to restrict trading to specified session
Trading Hours: Session input in HHMM-HHMM format (e.g., "0930-1600")
Main Settings:
Normalization Length: Lookback bars for high/low calculation (1-500, default 100)
Box Detection Length: Period for volatility peak/trough detection (1-100, default 14)
Strong Closes Only: Toggle between body midpoint vs close price for breakout detection
Nested Channels: Allow multiple overlapping channels vs single channel at a time
ATR TP/SL Settings:
ATR Timeframe: Source timeframe for ATR calculation (1, 5, 15, 60, etc.)
ATR Length: Smoothing period for ATR (1-100, default 14)
Take Profit 1 Multiplier: Distance from entry as multiple of ATR (0.1-10.0, default 2.0)
Take Profit 2 Multiplier: Distance from entry as multiple of ATR (0.1-10.0, default 3.0)
Stop Loss Multiplier: Distance from entry as multiple of ATR (0.1-10.0, default 1.0)
Enable Take Profit 2: Toggle second profit target on/off
VISUAL INDICATORS:
Channel boxes with semi-transparent fill showing consolidation zones
Green/red colored zones at channel boundaries indicating breakout areas
Volume bars displayed within channels using selected mode
TP/SL lines with labels showing both price level and distance in points
Entry signals marked with up/down triangles at breakout price
Strategy status table showing position, contracts, P&L, ATR values, and volume confirmation status
HOW TO USE:
For 2-Minute Scalping:
Set ATR Timeframe to "1" (1-minute), ATR Length to 12, TP1 Multiplier to 2.0, TP2 Multiplier to 3.0, SL Multiplier to 1.5. Enable volume confirmation and strong closes only. Use trading hours filter to avoid low-volume periods.
For 5-15 Minute Day Trading:
Set ATR Timeframe to match chart or use 5-minute, ATR Length to 14, TP1 Multiplier to 2.0, TP2 Multiplier to 3.5, SL Multiplier to 1.2. Volume confirmation recommended but optional.
For Hourly+ Swing Trading:
Set ATR Timeframe to 15-30 minute, ATR Length to 14-21, TP1 Multiplier to 2.5, TP2 Multiplier to 4.0, SL Multiplier to 1.5. Volume confirmation optional, nested channels can be enabled for multiple setups.
BACKTEST CONSIDERATIONS:
Strategy performs best during trending or volatility expansion phases
Consolidation-heavy or choppy markets produce more false signals
Shorter timeframes require wider stop loss multipliers due to noise
Commission and slippage significantly impact performance on sub-5-minute charts
Volume confirmation generally improves win rate but reduces trade frequency
ATR multipliers should be optimized for specific instrument characteristics
COMPATIBLE MARKETS:
Works on any instrument with price and volume data including forex pairs, stock indices, individual stocks, cryptocurrency, commodities, and futures contracts. Requires TradingView data feed that includes volume for volume confirmation features to function.
KNOWN LIMITATIONS:
Stop losses execute via strategy.exit() and may not fill at exact levels during gaps or extreme volatility
request.security() on lower timeframes requires higher-tier TradingView subscription
False breakouts inherent to breakout strategies cannot be completely eliminated
Performance varies significantly based on market regime (trending vs ranging)
Partial closing logic requires sufficient position size relative to TP1 close contracts setting
RISK DISCLOSURE:
Trading involves substantial risk of loss. Past performance of this or any strategy does not guarantee future results. This strategy is provided for educational purposes and automated backtesting. Thoroughly test on historical data and paper trade before risking real capital. Market conditions change and strategies that worked historically may fail in the future. Use appropriate position sizing and never risk more than you can afford to lose. Consider consulting a licensed financial advisor before making trading decisions.
ACKNOWLEDGMENT & CREDITS:
This strategy is built upon the channel detection methodology created by AlgoAlpha in the "Smart Money Breakout Channels" indicator. Full credit and appreciation to AlgoAlpha for pioneering the normalized volatility approach to identifying consolidation patterns and sharing this innovative technique with the TradingView community. The enhancements added to the original concept include automated trade execution, multi-timeframe ATR-based risk management, partial position closing by contract count, volume confirmation filtering, and real-time position monitoring.
ATR

ATR Enhanced [DCAUT]█ ATR Enhanced
📊 OVERVIEW
Standard ATR uses only RMA smoothing, while ATR Enhanced provides 20+ professional smoothing algorithms , offering precise volatility measurement solutions for different trading scenarios and market environments.
💡 CORE VALUE
- 20+ algorithm choices : SMA, EMA, RMA, WMA, HMA, T3, KAMA, FRAMA, Kalman Filter, etc.
📋 PARAMETER SETUP
ATR Length : Calculation period (default: 14)
Moving Average Type : Choose the most suitable smoothing method from 20+ algorithms
🎨 COLOR CODING
Green : Rising volatility
Red : Falling volatility

Apex Edge Sentinel - Stop Loss HUDApex Edge – ATR Sentinel Stop Loss HUD
The Apex Edge – ATR Sentinel is a complete stop-loss intelligence system built as a clean, always-on HUD.
It delivers institutional-level risk guidance by calculating and displaying live ATR-based stop levels for both long and short trades at multiple risk tolerances.
Forget cluttered charts and repainting lines — Sentinel gives you a clear stop-loss reference panel that updates dynamically with every bar.
✅ Features
• Triple ATR Multipliers
User-defined (e.g. x1.5 / x2.0 / x2.5). Compare tight, medium, and wide stops instantly.
• Dual-Side SL Levels
Both Long and Short safe stop prices displayed side by side. No more guessing trend
bias.
• ATR Transparency
HUD shows ATR(length) so you always know the calculation basis. Default = 14, adjustable
to your style.
• ATR Regime Meter
Detects volatility conditions (LOW / NORMAL / HIGH) by comparing ATR to its SMA. Helps
you avoid over-tight stops in high-volatility markets.
• Tick-Aware Rounding
Stop levels auto-rounded to the instrument’s tick size (Gold = 0.10, FX = 0.0001, indices =
whole points).
Custom HUD Design
• Location: Top/Bottom, Left/Right
• Sizes: Compact / Medium / Large (desktop or mobile)
• Opacity control (25% default Apex styling)
How to Use
1. Load Sentinel on your chart.
2. Check the HUD:
• ATR(14): 2.6 → base volatility measure.
• x1.5 / x2.0 / x2.5 → instant SL levels for both long & short trades.
3. Before entering a trade → decide which multiplier matches your style (tight scalper vs wider swing).
4. Manually place your SL at the level displayed in the HUD.
Sentinel works as both:
• A pre-trade check (is ATR stop too wide for my RR?).
• A live risk compass (updated stop levels every bar).
Why Apex Sentinel?
Most ATR stop indicators clutter charts with lagging lines or repainting trails. Sentinel strips it back to what matters:
• The numbers.
• The risk levels.
• The context.
It’s a pure stop-loss HUD, designed for serious traders who want clarity, discipline, and instant reference points across any market or timeframe.
Notes
• This is a HUD-only system (no automatic SL line). Traders manually apply the SL level
shown in the panel.
• Defaults: ATR(14), multipliers 1.5 / 2.0 / 2.5. Adjust to your trading style.
• Best used on intraday pairs like XAUUSD, EURUSD, indices, but works universally.
Apex Edge Philosophy: Clean. Smart. Institutional.
No clutter. No gimmicks. Just precision tools for modern markets.

Hammer Candle Detector with ATR Wick ConditionThis script detects Hammer candlesticks on any timeframe chart.
Conditions for a valid Hammer:
1. Small body near the top of the candle range (≤30% of total range)
2. Lower shadow at least 2× the body
3. Small or no upper shadow (≤30% of body)
4. Lower wick height must be greater than half of ATR(14)
A triangle marker is plotted below each candle that meets these conditions.

Anrazzi - EMAs/ATR - 1.0.2The Anrazzi – EMAs/ATR indicator is a multi-purpose overlay designed to help traders track trend direction and market volatility in a single clean tool.
It plots up to six customizable moving averages (MAs) and an Average True Range (ATR) value directly on your chart, allowing you to quickly identify market bias, dynamic support/resistance, and volatility levels without switching indicators.
This script is ideal for traders who want a simple, configurable, and efficient way to combine trend-following signals with volatility-based position sizing.
📌 Key Features
Six Moving Averages (MA1 → MA6)
Toggle each MA on/off individually
Choose between EMA or SMA for each
Customize length and color
Perfect for spotting trend direction and pullback zones
ATR Display
Uses Wilder’s ATR formula (ta.rma(ta.tr(true), 14))
Can be calculated on current or higher timeframe
Adjustable multiplier for position sizing (e.g., 1.5× ATR stops)
Displays cleanly in the bottom-right corner
Custom Watermark
Displays symbol + timeframe in top-right
Adjustable color and size for streamers, screenshots, or clear charting
Compact UI
Organized with group and inline inputs for quick configuration
Lightweight and optimized for real-time performance
⚙️ How It Works
MAs: The script uses either ta.ema() or ta.sma() to compute each moving average based on the user-selected type and length.
ATR: The ATR is calculated using ta.rma(ta.tr(true), 14) (Wilder’s smoothing), and optionally scaled by a multiplier for easier use in risk management.
Tables: ATR value and watermark are displayed using table.new() so they stay anchored to the screen regardless of zoom level.
📈 How to Use
Enable the MAs you want to track and adjust their lengths, type, and colors.
Enable ATR if you want to see volatility — optionally select a higher timeframe for broader context.
Use MAs to:
Identify overall trend direction (e.g. price above MA20 = bullish)
Spot pullback zones for entries
See when multiple MAs cluster together as support/resistance zones
Use ATR value to:
Size your stop-loss dynamically (e.g. stop = entry − 1.5×ATR)
Detect volatility breakouts (ATR spikes = market expansion)
🎯 Recommended For
Day traders & swing traders
Trend-following & momentum strategies
Volatility-based risk management
Traders who want a clean, all-in-one dashboard

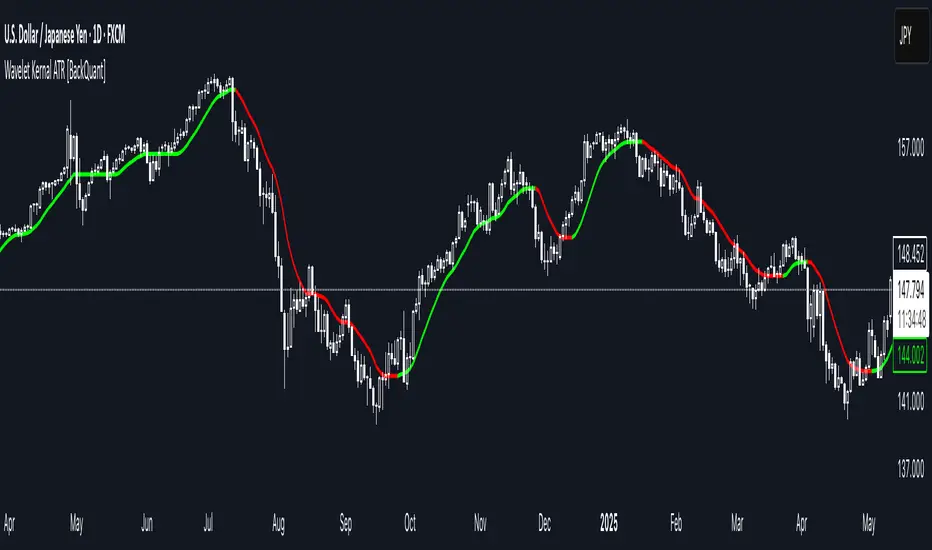
Wavelet Kernal ATR [BackQuant]Wavelet Kernal ATR
Introduction
Wavelet Kernal ATR is a closed-source, chart-side tool that fuses an edge-preserving “wavelet kernal” smoother with an ATR-aware regime line. The goal is simple: follow the real move, ignore the static, and give you clean, visual places to manage risk. It can color the trend directly on price, flip states when regime changes, and (optionally) add a secondary moving-average overlay for confirmation all while keeping the chart readable.
What it is
A single adaptive baseline designed to act like a “bias rail.” When it’s up, you favor longs; when it’s down, you favor shorts. It updates in a way that’s responsive to fresh information but resistant to insignificant wiggles. Around that baseline, an ATR-scaled envelope governs how and when the line concedes to volatility, which helps avoid flip-flopping in chop. Because this release is closed source, the following focuses on behavior and practical use rather than internal math.
What it’s used for
Bias & context: Read the backdrop with one glance; green = bullish regime, red = bearish regime.
Timing: Use slope changes and pullbacks to the line for entries aligned with the dominant push.
Risk placement: The line and its volatility envelope give intuitive zones for stops and targets.
Clarity: Paint candles by state and keep other overlays to a minimum to reduce decision noise.
Why “Wavelet Kernal” matters (plain English)
A wavelet kernal is a localized, scale-aware weighting profile. Instead of averaging every bar equally—or with a single, fixed decay—it emphasizes the most informative part of the recent window while softly down-weighting points that are either too old or too extreme. Three practical benefits result:
Edge preservation: Turning points are less “smeared” than with conventional smoothers, so the line can pivot sooner on genuine breakouts without chasing every tick.
Multi-scale sensitivity: The kernal “listens” to structure at multiple scales inside a compact window, helping it track swing-sized movement while suppressing micro-chop.
Lag vs. noise balance: Because the weighting is localized and shape-aware, you get a calmer line at similar responsiveness compared to common filters; fewer false flips, more meaningful ones.
You don’t need to know the internals to use it: think of the wavelet kernal as a smart stethoscope for price. It hears the heartbeat (trend/impulse) and ignores the coughs (random spikes).
How it behaves
Trend mode: When price expands directionally, the line “sticks” to the move and stays colored in that direction. Pullbacks that remain shallow relative to volatility usually do not flip the state.
Transition mode: After a large push, the line may flatten as volatility compresses. Flat + frequent small flips is the platform telling you: edge is low, wait for expansion.
Shock handling: On sudden spikes, the ATR envelope acts like a reality check—minor overreactions are absorbed, while statistically meaningful breaks force the baseline to concede and re-anchor.
Reading the line (quick heuristics)
Green + rising: Bias long; look for pullbacks toward the line that stall and resume.
Red + falling: Bias short; look for rallies into the line that fade.
Flat + rapid color flips: Stand down or scale down—let the next expansion choose the side.
Color flip at a prior S/R: Treat as a higher-quality signal than flips in the middle of nowhere.
Baseline + ATR corridor (concept)
The volatility envelope isn’t drawn as two fat bands here; it’s used internally to keep the baseline honest. You can think of it as a “breathing room” rule: the line is allowed to adapt with trend, but it shouldn’t jump the fence unless price movement is large enough relative to recent volatility. That’s why the tool feels calm in chop and decisive during actual breaks.
Optional MA Overlay (confluence)
You can overlay a moving average of the baseline itself for slower-regime confirmation. When both agree (baseline direction and its MA slope), you have trend alignment. When they diverge, expect digestion or a possible transition. Keep this overlay subtle; it’s a context layer, not another signal firehose.
What it plots
Wavelet ATR line — the adaptive baseline that flips color with regime.
Optional MA of the baseline — slower confirmation, on or off.
Candle painting — bars can inherit long/short state for instant read-through.
Alerts — available for state flips up/down.
Inputs explained (effect on behavior)
Wavelet ATR Calculation
Price Source — Default hlc3 ; choose your preferred composite of OHLC.
Kernal Calculation Length — The horizon the kernal “listens to.” Longer = steadier, fewer flips; shorter = snappier, more flips.
Kernal Alpha — How strongly the kernal prioritizes the freshest data inside that horizon. Higher alpha = quicker to acknowledge new pushes; lower alpha = more patience.
ATR Period — Determines the volatility memory. Shorter = envelope reacts faster; longer = envelope demands more evidence to concede.
ATR Factor — Scales how “strict” the envelope is. Larger factor = more tolerance (fewer flips); smaller = more sensitivity (earlier regime shifts).
Confluence
Show Atr Moving Average — Turns on the secondary overlay.
MA Type — Choose the flavor you read best (simple, exponential, linear regression, etc.).
Moving Average Period — The overlay’s horizon; treat it as a background current.
Volume Factor / Sigma (when applicable) — Specialized parameter used by certain MA types to shape smoothness.
Plotting & UI
Plot Wavelet ATR — Toggle the main line.
Paint Candles According to Trend — Color bars by the baseline’s state.
Long/Short Colors — Match your chart theme.
A practical playbook
Trend-pullback continuation
Setup: Baseline is green and rising. Price pulls back toward it, stalls (small bodies or wicks into the line), then resumes upward.
Idea: Enter on the resumption. Protective stop often lives just below the line or the last swing low. Scale targets through prior highs or measured projections.
Breakout + acceptance
Setup: Baseline flattens after consolidation. Price expands away; baseline turns green/red and stays that way as two or three bars “accept” the new area.
Idea: Join on the first controlled retest toward the line. If the line instantly loses color again, treat it as a fakeout.
Failed test / flip-and-go
Setup: Price challenges the line from the wrong side but cannot close through it convincingly; shortly after, the baseline flips color back in the original direction.
Idea: Use that failed test as a springboard—risk tucked beyond the failed side.
Quality checks before you click
Structure context: Is the flip happening near prior highs/lows, session opens, or well-observed levels? Flips at structure carry more information.
Volatility posture: If range is compressing, be picky. If range is expanding, respect the first pullback after the flip.
Clutter discipline: Use the fewest layers that earn their place. Trend line + candle painting is often enough.
Common questions
“Why did the line not flip on that spike?” Because the move wasn’t large or sustained enough relative to recent volatility. The envelope forces patience.
“Why did it flip and then flip back?” That’s what digestion looks like. The kernal preserves edges, but when the market truly has no edge, brief flips are information: sit tight.
“Do I need the overlay MA?” No. It’s optional context. If it helps you filter marginal trades, keep it. If it adds noise, turn it off.
Troubleshooting & fine-tuning (principles, not prescriptions)
Too many flips? Increase the Kernal Calculation Length or the ATR Factor. You’re asking for a steadier bias.
Feels late on strong trends? Nudge Kernal Alpha higher or shorten the Kernal Length. You’re asking for earlier acknowledgment.
Stops feel random? Place initial risk just beyond the baseline (or the last swing beyond it), then trail only when fresh structure appears.
Charts feel crowded? Keep the baseline + candle coloring; hide the overlay and other ornaments.
Alerts
Wavelet ATR Trend Up
Wavelet ATR Trend Down
Final notes
This tool is built to minimize analysis fatigue: one adaptive line, strong visual feedback, and enough discipline from volatility logic to avoid the “every blip is a signal” trap. The internal math, weighting shapes, and state logic are proprietary and intentionally not disclosed here; you still have full control of behavior through the inputs above. As always, align the settings with your own trade plan, keep the chart readable, and let confluence—not clutter—do the heavy lifting.
Anrazzi - EMAs/ATR - 1.0.2Description:
The Anrazzi - EMAs/ATR indicator is a versatile tool for technical traders looking to monitor multiple moving averages alongside the Average True Range (ATR) on any chart. Designed for simplicity and customization, it allows traders to visualize up to six moving averages with configurable type, color, and length, while keeping real-time volatility information via ATR directly on the chart.
This indicator is perfect for spotting trends, identifying support/resistance zones, and gauging market volatility for intraday or swing trading strategies.
Key Features:
Supports up to six independent moving averages (MA1 → MA6)
Each MA is fully customizable:
Enable/disable individually
Type: EMA or SMA
Length
Color
ATR Display:
Custom timeframe
Color and position configurable
Adjustable multiplier
Compact and organized settings for easy configuration
Lightweight and efficient code for smooth chart performance
Watermark
Inputs / Settings:
MA Options: MA1 → MA6 (Enable/Disable, Type, Length, Color)
Additional Settings: ATR (Enable, Timeframe, Color, Multiplier)
How to Use:
Enable the moving averages you want to track
Configure type, length, and color for each MA
Enable ATR if needed and adjust settings
Watch MAs plotted dynamically and ATR in bottom-right corner
Recommended For:
Day traders and swing traders
Trend-following strategies
Volatility analysis and breakout detection
Traders needing a compact multi-MA dashboard

Dynamic EMA x VWAP AlertsDynamic EMA × VWAP Alerts generates buy and sell signals only when an EMA crossover happens in a meaningful VWAP (or standard deviation band) context. By combining classic EMA logic with flexible VWAP anchors (Daily, Weekly, Rolling) and optional advanced filters (ATR, Relative Volume, Deviation, Distance, Time Windows) to trim noise further, the script creates location-aware, filterable alerts rather than “everywhere” crosses. The value for trading and originality here lies in the integration of one or multiple anchors, band gating, combinator logic, and advanced regime filters. It’s designed for use across multiple instruments and timeframes, where EMA/VWAP context is relevant. It can run quietly in the background while you focus on price action and your own S/R levels.
What it does (quick take)
Detects EMA crossovers (double or optional triple) and evaluates them in VWAP context.
Plots Buy/Sell markers only when all chosen conditions are met.
Clean UX: keep all or parts of the engine visible or hide everything and let alerts run based on the silent engine behind your own S/R levels in an uncluttered, practical chart, as illustrated below.
Engine illustration: All selected engines visible
Practical use case: Same snapshot sequence as above but all selected engines invisible
Swing examples (beyond intraday)
Signals-only (clean value view):
Signals + your own S/R lines:
EMA selection (choose your playbook)
Defaults: Fast 9, Medium 21 (common intraday combo).
Modes: Double Cross — Fast vs Medium.
Triple Cross (optional) — adds a Slow EMA trend filter (enable Slow > 0).
Ranges: you can set each EMA 0–200 (0 = hidden/off)
Visuals are optional; you can display or hide each EMA line
EMA cross footprints (optional): Helps you assess trend continuation or change.
Use your own strategy: switch to 9/50, 20/50, 50/200, or whatever EMA set you trust for your instrument/timeframe.
VWAP Selection (the context engine)
Daily VWAP – resets each chart day (00:00–23:59). Typical fit: scalpers and fast intraday decision points.
Weekly VWAP – resets at the start of the calendar week. Typical fit: intraday with higher-timeframe context (aligns day trades with weekly bias).
Rolling VWAP – an adjustable VWMA-based rolling anchor (not session-reset), used as a flexible context reference Typical fit: multi-day swings when you want a flexible anchor that adapts across sessions.
Standard deviation bands (σ ±1/±2/±3) available for each anchor and help you express the “how far from fair value” idea.
Why VWAP matters: it’s a running, volume-weighted anchor where strong moves relative to VWAP and its bands help frame mean-reversion vs. trend-continuation risk. Evaluating crosses relative to VWAP/±σ reduces “everywhere” noise and helps frame potential setups.
How alerts are decided
An alert triggers only when:
Your selected EMA crossover occurs, and
Your chosen VWAP gate(s) and any filters pass. (Computed on bar close to avoid mid-bar noise)
Signals and alerts do not repaint; alerts evaluate and fire once per bar close.
Alert gates (Single / AND / OR)
Select one VWAP source or combine two (e.g., Daily + Weekly) with Single, AND, or OR logic.
Choose gate levels from VWAP or standard deviation bands (±σ). Typical long logic: price at/under VWAP or −σ. Typical short logic: price at/over VWAP or +σ.
Practical recipes:
Trend-follow: Daily AND Weekly at/above VWAP → confirms strength on two anchors.
Mean-reversion probe: Daily OR Rolling at −1σ → allows earlier fades with flexibility.
Advanced filtering: Suitable for advanced/Quant traders
During the research and development of this indicator, the EMA/VWAP cross logic was tested on historical S&P500 Futures data to explore patterns on multiple timeframes. These selected filtering indicators below showed correlation between certain market conditions and chosen indicator thresholds, helping reduce noise and lower-quality alerts. Results were research-oriented and are not predictive of future performance.
Therefore, I have built these indicator filters that run silently in the background. They let you trim noise by requiring alerts to appear only in market regimes you define. Each one constrains alert conditions; using them together helps tailor alerts to your strategy—but overly strict settings may filter out most or all alerts.
Relative Volume (RVOL): compares current volume to a baseline; ensures alerts arrive with participation instead of thin tape.
Deviation Threshold (%): controls how close the cross must be to the VWAP/σ level; tight = anchored signals, loose = more activity.
ATR Gate (+ Relative regime): keeps alerts inside a volatility regime; avoids both dead tape and chaotic spikes.
Distance Guard: requires price to be at least X ticks/% away from VWAP; useful to avoid premature signals near fair value.
Note: It’s not recommended to activate all of them at once or change the values aggressively. Unless you’ve done deeper backtesting or machine learning calibration, you can easily filter out everything. Use small thresholds at first, then adjust to your instrument once you see how each filter changes alert frequency and quality. Advanced/quant users can fine-tune freely.
Case example:
Unfiltered: Timeframe 15 min, EMA Selection 9/21, VWAP gates Rolling (250 bars) OR Weekly
Filtered: Same setup as above + activated filters:
RVOL: 100 bars, Min. RVOL 0.4
Deviation threshold (%): 0.3
ATR Length: 14
Min ATR (%): 0.05
Relative regime: Base length 2000, Min Ratio 0.85, Max Ratio 2
Under the hood
This indicator leans on TradingView built-ins (e.g., EMA, VWMA, ATR, alertcondition) to maximize speed, stability, and compatibility while we implement the custom logic (VWAP anchors, band gating, combinator gates, advanced filters, time windows). Built-ins were easy to work with and reduced edge-case bugs and kept the visuals responsive, while the design gives fine-tuning and clean visuals—so both discretionary traders and quant-minded users can shape the alerts to their strategy and workflow.
Disclaimer
The tools, scripts, and indicators presented here are provided for educational and informational purposes only. They are not financial advice and should not be interpreted as investment recommendations, trading signals, or a solicitation to buy or sell any financial instrument.
All forms of trading and investing involve risk. The past performance of any security, strategy, or market condition does not guarantee future outcomes. Users are solely responsible for their own trading and investment decisions, including evaluating their financial situation, objectives, and risk tolerance.
By using this indicator, you acknowledge that you do so at your own risk. The author accepts no liability for any direct or indirect loss or damage—including, without limitation, loss of profits—that may arise from the use of, or reliance upon, this tool.

Omega ATR Indicator📖 Introduction
The Ω ATR Indicator was created to provide a more complete and professional framework for volatility analysis than the classic Average True Range (ATR).
While the traditional ATR is a useful tool, it has limitations: it delivers a simple rolling average of volatility, but it does not adapt to market regimes, it does not highlight extreme events, and it often leaves the trader with incomplete information about risk.
The Ω ATR takes the same foundation and elevates it into a multi-dimensional volatility dashboard, adding statistical layers, adaptive calculations, and clear visual references that allow traders to interpret volatility in a way that is immediately actionable.
🔎 What makes it different from a standard ATR?
This indicator introduces several features beyond the classic formula:
True Range Core – plots the raw True Range (TR) for each bar, providing a direct, bar-by-bar view of volatility impulses.
Standard & Adjusted ATR – includes both the conventional ATR (smoothed average) and an Adjusted ATR that automatically corrects for extreme conditions by incorporating percentile rescaling.
Percentile Volatility Levels – dynamically calculated extreme thresholds (99.8%, 75%, 50%, 25%), plotted as dotted levels across the chart. These act as reference lines for “normal” vs. “abnormal” volatility, useful for spotting unusual price expansions or contractions.
Linear Regression Volatility Trend – overlays a regression line of volatility, showing whether the market is moving toward expansion (rising vol), contraction (falling vol), or stability.
Monetary Value Translation – the indicator converts volatility into points, ticks, and dollar values (based on the instrument’s point value). This allows futures traders and high-value instruments users to immediately see how much volatility is “worth” in cash terms.
Interactive Table Display – a real-time statistics table is displayed directly on the chart, showing:
SMA of ATR in $ and points
Percentile-based volatility range (VAR) in $ and points
Tick equivalences, for quick position sizing
⚡ How traders can use it
The Ω ATR Indicator is designed to be versatile, fitting both discretionary traders and systematic strategy developers.
Risk Management: ATR-based stop losses and position sizing are significantly improved by using the adjusted ATR and percentile thresholds. Traders can size their positions according to volatility regimes, not just raw averages.
Breakout & Exhaustion Detection: When TR or ATR values spike above the 99.8% or 95% percentile levels, this often corresponds to breakout conditions or volatility exhaustion — useful for breakout strategies, mean-reversion setups, and volatility fades.
Market Regime Identification: The regression line helps distinguish if volatility is rising (trending environment, larger swings expected) or compressing (range-bound environment, lower risk opportunities).
Multi-Asset Flexibility: Works equally well on equities, futures, crypto, and FX. Its point/tick/dollar conversion makes it especially powerful for futures traders who need to quantify risk precisely.
Scalping to Swing Trading: On lower timeframes, it acts as a micro-volatility detector; on higher timeframes, it functions as a strategic risk gauge for position management.
⚙️ Settings and Customization
Length: The ATR lookback period (default = 34).
Shorter lengths (14–21) for intraday traders who want fast response.
Longer lengths (34–55) for swing/position traders who want smoother readings.
AVG / ADJ AVG: Toggle to display the standard ATR or the adjusted ATR.
Volatility Levels: Enable/disable up to 4 percentile-based levels (1st = 25%, 2nd = 50%, 3rd = 75%, 4th = 99.8%). Recommended: keep 3 levels active for clarity.
Color Controls: All plots and levels are fully customizable to match your chart style.
Table Display: Positioned on the chart (default: middle-right) with key values updated in real time.
🧭 Best Practices for Use
Combine with Trend Tools: Volatility readings are most powerful when combined with trend filters or volume analysis. For example, a breakout with both high volatility and trend confirmation is stronger than either alone.
ATR Stops: Use the Adjusted ATR rather than the standard one when trailing stops in highly volatile instruments like crypto or Nasdaq futures, as it adapts to outlier spikes.
Dollar Risk Translation: Use the dollar-value outputs to predefine maximum acceptable risk per trade (e.g., “I only risk $250 per position”). This bridges volatility to portfolio risk management.
Event Monitoring: Around economic events or earnings, expect volatility spikes above higher percentile levels. The indicator makes these moves instantly visible.
📌 Summary
The Ω ATR Indicator is not just “another ATR.” It is a comprehensive volatility framework that transforms volatility from a simple statistic into an actionable trading signal.
By combining:
the classic ATR,
an adjusted ATR,
percentile extremes,
regression-based volatility trends,
and real-time dollar conversions,
…this tool allows traders to precisely understand, visualize, and act on volatility in ways that a standard ATR simply cannot provide.
Whether you are scalping intraday moves, swing trading equities, or managing futures positions, the Ω ATR equips you with a professional-grade volatility dashboard that clarifies risk, highlights opportunity, and adapts across all markets and timeframes.
👉 Designed and developed by OmegaTools for traders who demand precision, clarity, and adaptability in their volatility analysis.

Structural Liquidity Signals [BullByte]Structural Liquidity Signals (SFP, FVG, BOS, AVWAP)
Short description
Detects liquidity sweeps (SFPs) at pivots and PD/W levels, highlights the latest FVG, tracks AVWAP stretch, arms percentile extremes, and triggers after confirmed micro BOS.
Full description
What this tool does
Structural Liquidity Signals shows where price likely tapped liquidity (stop clusters), then waits for structure to actually change before it prints a trigger. It spots:
Liquidity sweeps (SFPs) at recent pivots and at prior day/week highs/lows.
The latest Fair Value Gap (FVG) that often “pulls” price or serves as a reaction zone.
How far price is stretched from two VWAP anchors (one from the latest impulse, one from today’s session), scaled by ATR so it adapts to volatility.
A “percentile” extreme of an internal score. At extremes the script “arms” a setup; it only triggers after a small break of structure (BOS) on a closed bar.
Originality and design rationale, why it’s not “just a mashup”
This is not a mashup for its own sake. It’s a purpose-built flow that links where liquidity is likely to rest with how structure actually changes:
- Liquidity location: We focus on areas where stops commonly cluster—recent pivots and prior day/week highs/lows—then detect sweeps (SFPs) when price wicks beyond and closes back inside.
- Displacement context: We track the last Fair Value Gap (FVG) to account for recent inefficiency that often acts as a magnet or reaction zone.
- Stretch measurement: We anchor VWAP to the latest N-bar impulse and to the Daily session, then normalize stretch by ATR to assess dislocation consistently across assets/timeframes.
- Composite exhaustion: We combine stretch, wick skew, and volume surprise, then bend the result with a tanh transform so extremes are bounded and comparable.
- Dynamic extremes and discipline: Rather than triggering on every sweep, we “arm” at statistical extremes via percent-rank and only fire after a confirmed micro Break of Structure (BOS). This separates “interesting” from “actionable.”
Key concepts
SFP (liquidity sweep): A candle briefly trades beyond a level (where stops sit) and closes back inside. We detect these at:
Pivots (recent swing highs/lows confirmed by “left/right” bars).
Prior Day/Week High/Low (PDH/PDL/PWH/PWL).
FVG (Fair Value Gap): A small 3‑bar gap (bar2 high vs bar1 low, or vice versa). The latest gap often acts like a magnet or reaction zone. We track the most recent Up/Down gap and whether price is inside it.
AVWAP stretch: Distance from an Anchored VWAP divided by ATR (volatility). We use:
Impulse AVWAP: resets on each new N‑bar high/low.
Daily AVWAP: resets each new session.
PR (Percentile Rank): Where the current internal score sits versus its own recent history (0..100). We arm shorts at high PR, longs at low PR.
Micro BOS: A small break of the recent high (for longs) or low (for shorts). This is the “go/no‑go” confirmation.
How the parts work together
Find likely liquidity grabs (SFPs) at pivots and PD/W levels.
Add context from the latest FVG and AVWAP stretch (how far price is from “fair”).
Build a bounded score (so different markets/timeframes are comparable) and compute its percentile (PR).
Arm at extremes (high PR → short candidate; low PR → long candidate).
Only print a trigger after a micro BOS, on a closed bar, with spacing/cooldown rules.
What you see on the chart (legend)
Lines:
Teal line = Impulse AVWAP (resets on new N‑bar extreme).
Aqua line = Daily AVWAP (resets each session).
PDH/PDL/PWH/PWL = prior day/week levels (toggle on/off).
Zones:
Greenish box = latest Up FVG; Reddish box = latest Down FVG.
The shading/border changes after price trades back through it.
SFP labels:
SFP‑P = SFP at Pivot (dotted line marks that pivot’s price).
SFP‑L = SFP at Level (at PDH/PDL/PWH/PWL).
Throttle: To reduce clutter, SFPs are rate‑limited per direction.
Triggers:
Triangle up = long trigger after BOS; triangle down = short trigger after BOS.
Optional badge shows direction and PR at the moment of trigger.
Optional Trigger Zone is an ATR‑sized box around the trigger bar’s close (for visualization only).
Background:
Light green/red shading = a long/short setup is “armed” (not a trigger).
Dashboard (Mini/Pro) — what each item means
PR: Percentile of the internal score (0..100). Near 0 = bullish extreme, near 100 = bearish extreme.
Gauge: Text bar that mirrors PR.
State: Idle, Armed Long (with a countdown), or Armed Short.
Cooldown: Bars remaining before a new setup can arm after a trigger.
Bars Since / Last Px: How long since last trigger and its price.
FVG: Whether price is in the latest Up/Down FVG.
Imp/Day VWAP Dist, PD Dist(ATR): Distance from those references in ATR units.
ATR% (Gate), Trend(HTF): Status of optional regime filters (volatility/trend).
How to use it (step‑by‑step)
Keep the Safety toggles ON (default): triggers/visuals on bar‑close, optional confirmed HTF for trend slope.
Choose timeframe:
Intraday (5m–1h) or Swing (1h–4h). On very fast/thin charts, enable Performance mode and raise spacing/cooldown.
Watch the dashboard:
When PR reaches an extreme and an SFP context is present, the background shades (armed).
Wait for the trigger triangle:
It prints only after a micro BOS on a closed bar and after spacing/cooldown checks.
Use the Trigger Zone box as a visual reference only:
This script never tells you to buy/sell. Apply your own plan for entry, stop, and sizing.
Example:
Bullish: Sweep under PDL (SFP‑L) and reclaim; PR in lower tail arms long; BOS up confirms → long trigger on bar close (ATR-sized trigger zone shown).
Bearish: Sweep above PDH/pivot (SFP‑L/P) and reject; PR in upper tail arms short; BOS down confirms → short trigger on bar close (ATR-sized trigger zone shown).
Settings guide (with “when to adjust”)
Safety & Stability (defaults ON)
Confirm triggers at bar close, Draw visuals at bar close: Keep ON for clean, stable prints.
Use confirmed HTF values: Applies to HTF trend slope only; keeps it from changing until the HTF bar closes.
Performance mode: Turn ON if your chart is busy or laggy.
Core & Context
ATR Length: Bigger = smoother distances; smaller = more reactive.
Impulse AVWAP Anchor: Larger = fewer resets; smaller = resets more often.
Show Daily AVWAP: ON if you want session context.
Use last FVG in logic: ON to include FVG context in arming/score.
Show PDH/PDL/PWH/PWL: ON to see prior day/week levels that often attract sweeps.
Liquidity & Microstructure
Pivot Left/Right: Higher values = stronger/rarer pivots.
Min Wick Ratio (0..1): Higher = only more pronounced SFP wicks qualify.
BOS length: Larger = stricter BOS; smaller = quicker confirmations.
Signal persistence: Keeps SFP context alive for a few bars to avoid flicker.
Signal Gating
Percent‑Rank Lookback: Larger = more stable extremes; smaller = more reactive extremes.
Arm thresholds (qHi/qLo): Move closer to 0.5 to see more arms; move toward 0/1 to see fewer arms.
TTL, Cooldown, Min bars and Min ATR distance: Space out triggers so you’re not reacting to minor noise.
Regime Filters (optional)
ATR percentile gate: Only allow triggers when volatility is at/above a set percentile.
HTF trend gate: Only allow longs when the HTF slope is up (and shorts when it’s down), above a minimum slope.
Visuals & UX
Only show “important” SFPs: Filters pivot SFPs by Volume Z and |Impulse stretch|.
Trigger badges/history and Max badge count: Control label clutter.
Compact labels: Toggle SFP‑P/L vs full names.
Dashboard mode and position; Dark theme.
Reading PR (the built‑in “oscillator”)
PR ~ 0–10: Potential bullish extreme (long side can arm).
PR ~ 90–100: Potential bearish extreme (short side can arm).
Important: “Armed” ≠ “Enter.” A trigger still needs a micro BOS on a closed bar and spacing/cooldown to pass.
Repainting, confirmations, and HTF notes
By default, prints wait for the bar to close; this reduces repaint‑like effects.
Pivot SFPs only appear after the pivot confirms (after the chosen “right” bars).
PD/W levels come from the prior completed candles and do not change intraday.
If you enable confirmed HTF values, the HTF slope will not change until its higher‑timeframe bar completes (safer but slightly delayed).
Performance tips
If labels/zones clutter or the chart lags:
Turn ON Performance mode.
Hide FVG or the Trigger Zone.
Reduce badge history or turn badge history off.
If price scaling looks compressed:
Keep optional “score”/“PR” plots OFF (they overlay price and can affect scaling).
Alerts (neutral)
Structural Liquidity: LONG TRIGGER
Structural Liquidity: SHORT TRIGGER
These fire when a trigger condition is met on a confirmed bar (with defaults).
Limitations and risk
Not every sweep/extreme reverses; false triggers occur, especially on thin markets and low timeframes.
This indicator does not provide entries, exits, or position sizing—use your own plan and risk control.
Educational/informational only; no financial advice.
License and credits
© BullByte - MPL 2.0. Open‑source for learning and research.
Built from repeated observations of how liquidity runs, imbalance (FVG), and distance from “fair” (AVWAPs) combine, and how a small BOS often marks the moment structure actually shifts.

Volume Profile Auto POC📌 Overview
Volume Profile Auto POC is a trend-following strategy that uses the automatically calculated Point of Control (POC) from the volume profile, combined with ATR zones, to capture reversals and breakouts.
By basing decisions on volume concentration, it dynamically visualizes the price levels most watched by market participants.
⚠️ This strategy is provided for educational and research purposes only.
Past performance does not guarantee future results.
🎯 Strategy Objectives
Automatically detect the volume concentration area (POC) to improve entry accuracy
Optimize risk management through ATR-based volatility adjustment
Provide early and consistent signals when trends emerge
✨ Key Features
Automatic POC Detection : Updates the volume profile over a defined lookback window in real time
ATR Zone Integration : Defines a POC ± 0.5 ATR zone to clarify potential reversals/breakouts
Visual Support : Plots the POC line and zones on the chart for intuitive decision-making
📊 Trading Rules
Long Entry:
Price breaks above the POC + 0.5 ATR zone
Volume is above average to support the breakout
Short Entry:
Price breaks below the POC - 0.5 ATR zone
Volume is above average to support the downside move
Exit (or Reverse Position):
Price returns to the POC area
Or touches the ATR band
⚙️ Trading Parameters & Considerations
Indicator Name: Volume Profile Auto POC
Parameters:
Lookback Bars: 50
Bins for Volume Profile: 24
ATR Length: 14
ATR Multiplier: 2.0
🖼 Visual Support
POC line plotted in red
POC ± 0.5 ATR zone displayed as a semi-transparent box
ATR bands plotted in blue for confirmation
🔧 Strategy Improvements & Uniqueness
This strategy is inspired by traditional Volume Profile + ATR analysis,
while adding the improvement of a sliding-window mechanism for automatic POC updates.
Compared with conventional trend-following approaches,
its strength lies in combining both price and volume perspectives for decision-making.
✅ Summary
Volume Profile Auto POC automatically extracts key market levels (POC) and combines them with ATR-based zones,
providing a responsive trend-following method.
It balances clarity with practicality, aiming for both usability and reproducibility.
⚠️ This strategy is based on historical data and does not guarantee future profits.
Always use proper risk management when applying it.

Trendline Breakout Strategy [KedArc Quant] Description
A single, rule-based system that builds two trendlines from confirmed swing pivots and trades their breakouts, with optional retest, trend-regime gates (EMA / HTF EMA), and ATR-based risk. All parts serve one decision flow: structure → breakout → gated entry → managed risk.
What it does (for traders)
Draws Up line (teal) through the last two Higher Lows and Down line (red) through the last two Lower Highs, then extends them forward.
Long when price breaks above red; Short when price breaks below teal.
Optional Retest entry: after a break, wait for a pullback toward the broken line within an ATR-scaled buffer.
Uses ATR stop and R-multiple target so risk is consistent across symbols/timeframes.
Labels HL1/HL2/LH1/LH2 so non-coders can verify which pivots built each line.
Why these components are combined
Pure breakout systems on trendlines suffer from three practical issues:
False breaks in chop → solved by trend-regime gates (EMA / HTF EMA) that only allow trades aligned with the prevailing trend.
Uneven volatility across markets/timeframes → solved by ATR-based stop/target, normalizing distance so R-multiples are comparable.
First break whipsaws near wedge apices → mitigated by the optional retest rule that demands a pullback/hold before entry.
These modules are not separate indicators with their own signals. They are support roles inside one method.
The pivot engine defines structure, the breakout detector defines signal, the regime gates decide if we’re allowed to take that signal, and the ATR module sizes risk.
Together they make the trendline breakout usable, testable, and explainable.
How it works (mechanism; each component explained)
1) Pivot engine (structure, non-repainting)
Swings are confirmed with ta.pivotlow/high(L, R). A pivot only exists after R bars (no look-ahead), so once plotted, the line built from those pivots will not repaint.
2) Trendline builder (geometry)
Teal line updates when two consecutive pivot lows satisfy HL2.price > HL1.price (and HL2 occurs after HL1).
Red line updates when two consecutive pivot highs satisfy LH2.price < LH1.price.
Lines are extended right and their current value is read every bar via line.get_price().
3) Breakout detector (signal)
On every bar, compute:
crossover(close, redLine) ⇒ Long breakout
crossunder(close, tealLine) ⇒ Short breakdown
4) Regime gates (trend filters, not separate signals)
EMA gate: allow longs only if close > EMA(len), shorts only if close < EMA(len).
HTF EMA gate (optional): same rule on a higher timeframe to avoid fighting the larger trend.
These do not create entries; they simply permit or block the breakout signal.
5) Retest module (optional confirmation)
After a breakout, record the line price. A valid retest occurs if price pulls back within an ATR-scaled buffer toward that broken line and then closes back in the breakout direction.
This reduces first-tick fakeouts.
6) Risk module (position exit)
Initial stop = ATR(len) × atrMult from entry.
Target = tpR × (ATR × atrMult) (e.g., 2R).
This keeps results consistent across instruments/timeframes.
Entries & exits
Long entry
Base: close breaks above red and passes EMA/HTF gates.
Retest (if enabled): after the break, price pulls back near the broken red line (within the ATR buffer) and holds; then enter.
Short entry
Mirror logic with teal (break below & gates), optionally with a retest.
Exit
strategy.exit places ATR stop & R-multiple target automatically.
Optional “flip”: close if the opposite base signal triggers.
How to use it (step-by-step)
Timeframe: 1–15m for intraday, 1–4h for swing.
Start defaults: Pivot L/R = 5, EMA len = 200, ATR len = 14, ATR mult = 2, TP = 2R, Retest = ON.
Tune sensitivity:
Faster lines (more trades): set L/R = 3–4.
Fewer counter-trend trades: enable HTF EMA (e.g., 60-min or Daily).
Visual audit: labels HL1/HL2 & LH1/LH2 show which pivots built each line—verify by eye.
Alerts: use Long breakout, Short breakdown, and Retest alerts to automate.
Originality (why it merits publication)
Trades the visualization: many “auto-trendline” tools only draw lines; this one turns them into testable, alertable rules.
Integrated design: each component has a defined role in the same pipeline—no unrelated indicators bolted together.
Transparent & non-repainting: pivot confirmation removes look-ahead; labels let non-coders understand the setup that produced each signal.
Notes & limitations
Lines update only after pivot confirmation; that lag is intentional to avoid repainting.
Breakouts near an apex can whipsaw; prefer Retest and/or HTF gate in choppy regimes.
Backtests are idealized; forward-test and size risk appropriately.
⚠️ Disclaimer
This script is provided for educational purposes only.
Past performance does not guarantee future results.
Trading involves risk, and users should exercise caution and use proper risk management when applying this strategy.

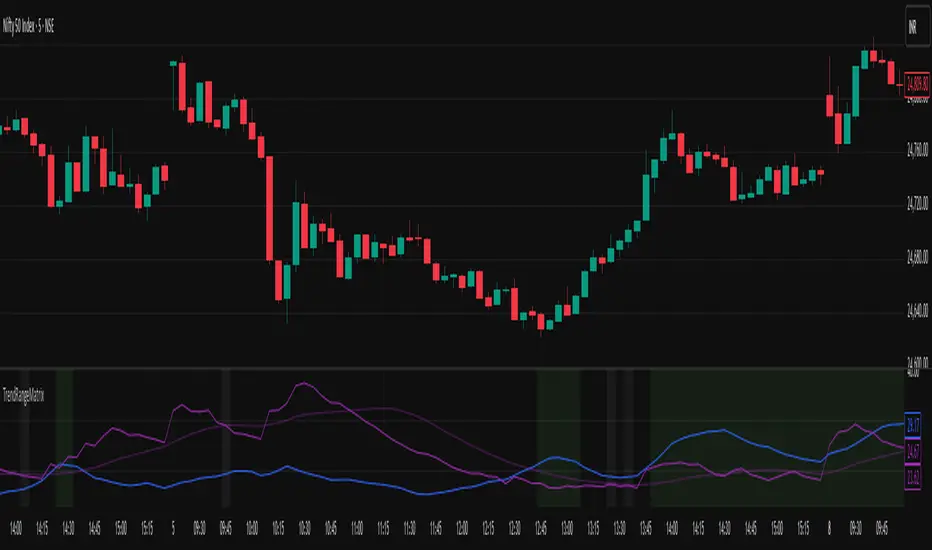
Nifty Trend vs Range (Final)This indicator is designed to help you quickly identify whether the Nifty market is trending, ranging, or preparing for a breakout by combining three volatility and trend-strength measures:
India VIX (Volatility Index)
ADX (Average Directional Index)
ATR (Average True Range)
It creates a Trend vs Range Decision Matrix that categorizes the market into actionable states such as Range – Quiet, Breakout Watch, Trend – Smooth, Trend – Confirmed, Trend – Volatile, or Choppy / Noisy.
🔑 How it Works
India VIX (Market Volatility)
Pulled directly from NSE:INDIAVIX (or your chosen symbol).
VIX thresholds are defined:
Below VIX Low → Calm market (often ranges).
Between VIX Low & High → Neutral/moderate volatility.
Above VIX High → High volatility (potential big moves or choppiness).
VIX can be scaled and plotted in the same pane with ADX/ATR, or shown separately with a companion script.
ADX (Trend Strength)
Custom calculation (Wilder’s smoothing, not built-in ta.adx), to ensure more consistent results.
Thresholds (auto-tuned by timeframe if enabled):
Low ADX → Weak/no trend, sideways.
High ADX → Strong directional trend.
ATR (Volatility Expansion)
ATR compared to a moving average of ATR detects whether volatility is rising or flat.
Used as confirmation for breakouts or fading moves.
🧠 Market State Logic
The script combines the three signals into an interpretable market state:
Range – Quiet → VIX low, ADX low, ATR flat
Trend – Smooth → VIX low, ADX high
Breakout Watch → VIX neutral, ADX low, ATR rising
Trend – Confirmed → VIX neutral, ADX high, ATR rising
Choppy / Noisy → VIX high, ADX low, ATR rising
Trend – Volatile → VIX high, ADX high, ATR rising
Neutral → fallback if conditions don’t match
Each state is color-coded with background shading and displayed as a persistent label with key metrics (VIX, ADX, ATR).
⚙️ Features
✅ Intraday Auto-Tuning
ADX/ATR thresholds automatically adjust depending on chart timeframe (5m, 15m, etc.).
✅ Scalable VIX Plotting
Option to overlay a scaled VIX line in the same pane or hide it if you use a separate VIX pane.
✅ Persistent State Label
Shows the current regime, timeframe, and key values. Updates every bar without stacking multiple labels.
✅ Alerts Ready
Alerts for each market regime can be set directly in TradingView.
✅ Background Coloring
Quick at-a-glance identification of current state.
🎯 How to Use
Ranging markets (low VIX, low ADX, flat ATR): Favor mean-reversion strategies like option selling, iron condors, or scalping.
Smooth trends (low VIX, high ADX): Favor directional trades with futures/options spreads.
Breakout Watch: Stay alert for possible trend initiation.
Confirmed trends (neutral VIX, high ADX, rising ATR): Ideal for momentum trading.
Volatile trends (high VIX, high ADX): Use caution, hedge positions, or trade with wider stops.
Choppy/Noisy (high VIX, low ADX): Avoid overtrading, expect false signals.
Kalman Adjusted Average True Range [BackQuant]Kalman Adjusted Average True Range
A volatility-aware trend baseline that fuses a Kalman price estimate with ATR “rails” to create a smooth, adaptive guide for entries, exits, and trailing risk.
Built on my original Kalman
This indicator is based on my original Kalman Price Filter:
That core smoother is used here to estimate the “true” price path, then blended with ATR to control step size and react proportionally to market noise.
What it plots
Kalman ATR Line the main baseline that turns up/down with the filtered trend.
Optional Moving Average of the Kalman ATR a secondary line for confluence (SMA/Hull/EMA/WMA/DEMA/RMA/LINREG/ALMA).
Candle Coloring (optional) paint bars by the baseline’s current direction.
Why combine Kalman + ATR?
Kalman reduces measurement noise and produces a stable path without the lag of heavy MAs.
ATR rails scale the baseline’s step to current volatility, so it’s calm in chop and more responsive in expansion.
The result is a single, intelligible line you can trade around: slope-up = constructive; slope-down = caution.
How it works (plain English)
Each bar, the Kalman filter updates an internal state (tunable via Process Noise , Measurement Noise , and Filter Order ) to estimate the underlying price.
An ATR band (Period × Factor) defines the allowed per-bar adjustment. The baseline cannot “jump” beyond those rails in one step.
A direction flip is detected when the baseline’s slope changes sign (upturn/downturn), and alerts are provided for both.
Typical uses
Trend confirmation Trade in the baseline’s direction; avoid fading a firmly rising/falling line.
Pullback timing Look for entries when price mean-reverts toward a rising baseline (or exits on tags of a falling one).
Trailing risk Use the baseline as a dynamic guide; many traders set stops a small buffer beyond it (e.g., a fraction of ATR).
Confluence Enable the MA overlay of the Kalman ATR; alignment (baseline above its MA and rising) supports continuation.
Inputs & what they do
Calculation
Kalman Price Source which price the filter tracks (Close by default).
Process Noise how quickly the filter can adapt. Higher = more responsive (but choppier).
Measurement Noise how much you distrust raw price. Higher = smoother (but slower to turn).
Filter Order (N) depth of the internal state array. Higher = slightly steadier behavior.
Kalman ATR
Period ATR lookback. Shorter = snappier; longer = steadier.
Factor scales the allowed step per bar. Larger factors permit faster drift; smaller factors clamp movement.
Confluence (optional)
MA Type & Period compute an MA on the Kalman ATR line , not on price.
Sigma (ALMA) if ALMA is selected, this input controls the curve’s shape. (Ignored for other MA types.)
Visuals
Plot Kalman ATR toggle the main line.
Paint Candles color bars by up/down slope.
Colors choose long/short hues.
Signals & alerts
Trend Up baseline turns upward (slope crosses above 0).
Alert: “Kalman ATR Trend Up”
Trend Down baseline turns downward (slope crosses below 0).
Alert: “Kalman ATR Trend Down”
These are state flips , not “price crossovers,” so you avoid many one-bar head-fakes.
How to start (fast presets)
Swing (daily/4H) ATR Period 7–14, Factor 0.5–0.8, Process Noise 0.02–0.05, Measurement Noise 2–4, N = 3–5.
Intraday (5–15m) ATR Period 5–7, Factor 0.6–1.0, Process Noise 0.05–0.10, Measurement Noise 2–3, N = 3–5.
Slow assets / FX raise Measurement Noise or ATR Period for calmer lines; drop Factor if the baseline feels too jumpy.
Reading the line
Rising & curving upward momentum building; consider long bias until a clear downturn.
Flat & choppy regime uncertainty; many traders stand aside or tighten risk.
Falling & accelerating distribution lower; short bias until a clean upturn.
Practical playbook
Continuation entries After a Trend Up alert, wait for a minor pullback toward the baseline; enter on evidence the line keeps rising.
Exit/reduce If long and the baseline flattens then turns down, trim or exit; reverse logic for shorts.
Filters Add a higher-timeframe check (e.g., only take longs when the daily Kalman ATR is rising).
Stops Place stops just beyond the baseline (e.g., baseline − x% ATR for longs) to avoid “tag & reverse” noise.
Notes
This is a guide to state and momentum, not a guarantee. Combine with your process (structure, volume, time-of-day) for decisions.
Settings are asset/timeframe dependent; start with the presets and nudge Process/Measurement Noise until the baseline “feels right” for your market.
Summary
Kalman ATR takes the noise-reduction of a Kalman price estimate and couples it with volatility-scaled movement to produce a clean, adaptive baseline. If you liked the original Kalman Price Filter (), this is its trend-trading cousin purpose-built for cleaner state flips, intuitive trailing, and confluence with your existing

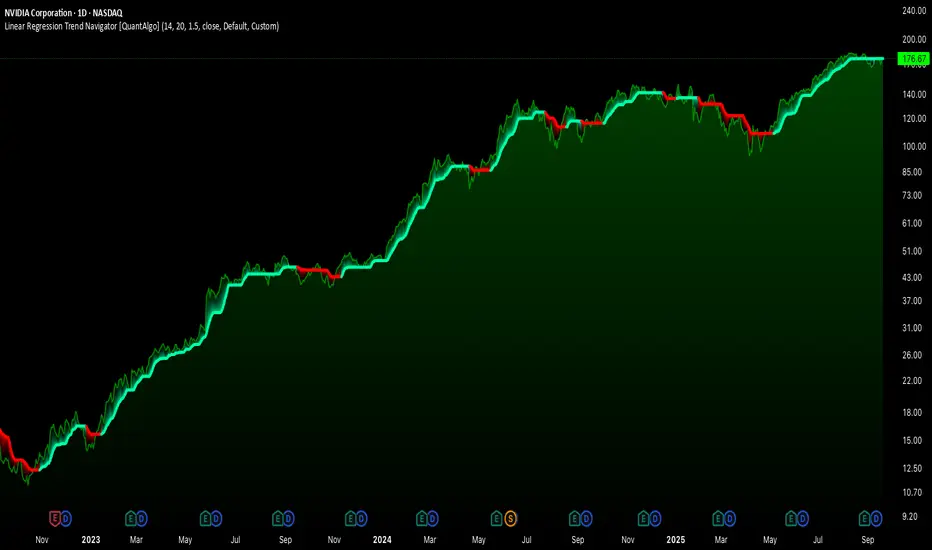
Linear Regression Trend Navigator [QuantAlgo]🟢 Overview
The Linear Regression Trend Navigator is a trend-following indicator that combines statistical regression analysis with adaptive volatility bands to identify and track dominant market trends. It employs linear regression mathematics to establish the underlying trend direction, while dynamically adjusting trend boundaries based on standard deviation calculations to filter market noise and maintain trend continuity. The result is a straightforward visual system where green indicates bullish conditions favoring buy/long positions, and red signals bearish conditions supporting sell/short trades.
🟢 How It Works
The indicator operates through a three-phase computational process that transforms raw price data into adaptive trend signals. In the first phase, it calculates a linear regression line over the specified period, establishing the mathematical best-fit line through recent price action to determine the underlying directional bias. This regression line serves as the foundation for trend analysis by smoothing out short-term price variations while preserving the essential directional characteristics.
The second phase constructs dynamic volatility boundaries by calculating the standard deviation of price movements over the defined period and applying a user-adjustable multiplier. These upper and lower bounds create a volatility-adjusted channel around the regression line, with wider bands during volatile periods and tighter bands during stable conditions. This adaptive boundary system operates entirely behind the scenes, ensuring the trend signal remains relevant across different market volatility regimes without cluttering the visual display.
In the final phase, the system generates a simple trend line that dynamically positions itself within the volatility boundaries. When price action pushes the regression line above the upper bound, the trend line adjusts to the upper boundary level. Conversely, when the regression line falls below the lower bound, the trend line moves to the lower boundary. The result is a single colored line that transitions between green (rising trend line = buy/long) and red (declining trend line = sell/short).
🟢 How to Use
Green Trend Line: Upward momentum indicating favorable conditions for long positions, buy signals, and bullish strategies
Red Trend Line: Downward momentum signaling optimal timing for short positions, sell signals, and bearish approaches
Rising Green Line: Accelerating bullish momentum with steepening angles indicating strengthening upward pressure and potential for trend continuation
Declining Red Line: Intensifying bearish momentum with increasing negative slopes suggesting persistent downward pressure and shorting opportunities
Flattening Trend Lines: Gradual reduction in slope regardless of color may indicate approaching consolidation or momentum exhaustion requiring position review
🟢 Pro Tips for Trading and Investing
→ Entry/Exit Timing: Trade exclusively on band color transitions rather than price patterns, as each color change represents a statistically-confirmed shift that has passed through volatility filtering, providing higher probability setups than traditional technical analysis.
→ Parameter Optimization for Asset Classes: Customize the linear regression period based on your trading style. For example, use 5-10 bars for day trading to capture short-term statistical shifts, 14-20 for swing trading to balance responsiveness with stability, and 25-50 for position trading to filter out medium-term noise.
→ Volatility Calibration Strategy: Adjust the standard deviation multiplier according to market volatility. For instance, increase to 2.0+ during high-volatility periods like earnings or news events to reduce false signals, decrease to 1.0-1.5 during stable market conditions to maintain sensitivity to genuine trends.
→ Cross-Timeframe Statistical Validation: Apply the indicator across multiple timeframes simultaneously, using higher timeframes for directional bias and lower timeframes for entry timing.
→ Alert-Based Systematic Trading: Use built-in alerts to eliminate discretionary decision-making and ensure you capture every statistically-significant trend change, particularly effective for traders who cannot monitor charts continuously.
→ Risk Allocation Based on Signal Strength: Increase position sizes during periods of strong directional movement while reducing exposure during frequent band color changes that indicate statistical uncertainty or ranging conditions.
Gann Fan Strategy [KedarArc Quant]Description
A single-concept, rule-based strategy that trades around a programmatic Gann Fan.
It anchors to a swing (or a manual point), builds 1×1 and related fan lines numerically, and triggers entries when price interacts with the 1×1 (breakout or bounce). Management is done entirely with the fan structure (next/previous line) plus optional ATR trailing.
What TV indicators are used
* Pivots: `ta.pivothigh/ta.pivotlow` to confirm swing highs/lows for anchor selection.
* ATR: `ta.atr` only to scale the 1×1 slope (optional) and for an optional trailing stop.
* EMA: `ta.ema` as a trend filter (e.g., only long above the EMA, short below).
No RSI/MACD/Stoch/Heikin/etc. The logic is one coherent framework: Gann price–time geometry, with ATR as a scale and EMA as a risk filter.
How it works
1. Anchor
* Auto: chooses the most recent *confirmed* pivot (you control Left/Right).
* Manual: set a price and bar index and the fan will hold that point (no re-anchoring).
* Optional Re-anchor when a newer pivot confirms.
2. 1×1 Slope (numeric, not cosmetic)
* ATR mode: `1×1 = ATR(Length) × Multiplier` (adapts to volatility).
* Fixed mode: `ticks per bar` (constant slope).
Because slope is numeric, it doesn’t change with chart zoom, unlike the drawing tool.
3. Fan Lines
Builds classic ratios around the 1×1: 1/8, 1/4, 1/3, 1/2, 1/1, 2/1, 3/1, 4/1, 8/1.
4. Signals
* Breakout: cross of price over/under the 1×1 in the EMA-aligned direction.
* Bounce (optional): touch + reversal across the 1×1 to reduce whipsaw.
5. Exits & Risk
* Take-profit at the next fan line; Stop at the previous fan line.
* If a level is missing (right after re-anchor), a fallback Risk-Reward (RR) is used.
* Optional ATR trailing stop.
Why this is unique
* True numeric fan: The 1×1 slope is calculated from ATR or fixed ticks—not from screen geometry—so it is scale-invariant and reproducible across users/timeframes.
* Deterministic anchor logic: Uses confirmed pivots (with your L/R settings). No look-ahead; anchors update only when the right bars complete.
* Fan-native trade management: Both entries and exits come from the fan structure itself (with a minimal ATR/EMA assist), keeping the method pure.
* Two entry archetypes: Breakout for momentum days; Bounce for range days—switchable without changing the core model.
* Manual mode: Lock a session’s bias by anchoring to a chosen swing (e.g., day’s first major low/high) and keep the fan constant all day.
Inputs (quick guide)
* Auto Anchor (Left/Right): pivot sensitivity. Higher values = fewer, stronger anchors.
* Re-anchor: refresh to newer pivots as they confirm.
* Manual Anchor Price / Bar Index: fixes the fan (turn Auto off).
* Scale 1×1 by ATR: on = adaptive; off = use ticks per bar.
* ATR Length / ATR Multiplier: controls adaptive slope; start around 14 / 0.25–0.35.
* Ticks per bar: exact fixed slope (match a hand-drawn fan by computing slope ÷ mintick).
* EMA Trend Filter: e.g., 50–100; trades only in EMA direction.
* Use Bounce: require touch + reverse across 1×1 (helps in chop).
* TP/SL at fan lines; Fallback RR for missing levels; ATR Trailing Stop optional.
* Transparency/Plot EMA: visual preferences.
Tips
* Range days: larger pivots (L/R 8–12), Bounce ON, ATR Multiplier \~0.30–0.40, EMA 100.
* Trend days: L/R 5–6, Breakout, Multiplier \~0.20–0.30, EMA 50, ATR trail 1.0–1.5.
* Match the TV Gann Fan drawing: turn ATR scale OFF, set ticks per bar = `(Δprice between anchor and 1×1 target) / (bars) / mintick`.
Repainting & testing notes
* Pivots require Right bars to confirm; anchors are set after confirmation (no look-ahead).
* Signals use the current bar close with TradingView strategy mechanics; real-time vs. bar-close can differ slightly, as with any strategy.
* Re-anchoring legitimately moves the structure when new pivots confirm—by design.
⚠️ Disclaimer
This script is provided for educational purposes only.
Past performance does not guarantee future results.
Trading involves risk, and users should exercise caution and use proper risk management when applying this strategy.

Deadband Hysteresis Supertrend [BackQuant]Deadband Hysteresis Supertrend
A two-stage trend tool that first filters price with a deadband baseline, then runs a Supertrend around that baseline with optional flip hysteresis and ATR-based adverse exits.
What this is
A hybrid of two ideas:
Deadband Hysteresis Baseline that only advances when price pulls far enough from the baseline to matter. This suppresses micro noise and gives you a stable centerline.
Supertrend bands wrapped around that baseline instead of raw price. Flips are further gated by an extra margin so side changes are more deliberate.
The goal is fewer whipsaws in chop and clearer regime identification during trends.
How it works (high level)
Deadband step — compute a per-bar “deadband” size from one of four modes: ATR, Percent of price, Ticks, or Points. If price deviates from the baseline by more than this amount, move the baseline forward by a fraction of the excess. If not, hold the line.
Centered Supertrend — build upper and lower bands around the baseline using ATR and a user factor. Track the usual trailing logic that tightens a band while price moves in its favor.
Flip hysteresis — require price to exceed the active band by an extra flip offset × ATR before switching sides. This adds stickiness at the boundary.
Adverse exit — once a side is taken, trigger an exit if price moves against the entry by K × ATR .
If you would like to check out the filter by itself:
What it plots
DBHF baseline (optional) as a smooth centerline.
DBHF Supertrend as the active trailing band.
Candle coloring by trend side for quick read.
Signal markers 𝕃 and 𝕊 at flips plus ✖ on adverse exits.
Inputs that matter
Price Source — series being filtered. Close is typical. HL2 or HLC3 can be steadier.
Deadband mode — ATR, Percent, Ticks, or Points. This defines the “it’s big enough to matter” zone.
ATR Length / Mult (DBHF) — only used when mode = ATR. Larger values widen the do-nothing zone.
Percent / Ticks / Points — alternatives to ATR; pick what fits your market’s convention.
Enter Mult — scales the deadband you must clear before the baseline moves. Increase to filter more noise.
Response — fraction of the excess applied to baseline movement. Higher responds faster; lower is smoother.
Supertrend ATR Period & Factor — traditional band size controls; higher factor widens and flips less often.
Flip Offset ATR — extra ATR buffer required to flip. Useful in choppy regimes.
Adverse Stop K·ATR — per-trade danger brake that forces an exit if price moves K×ATR against entry.
UI — toggle baseline, supertrend, signals, and bar painting; choose long and short colors.
How to read it
Green regime — candles painted long and the Supertrend running below price. Pullbacks toward the baseline that fail to breach the opposite band often resume higher.
Red regime — candles painted short and the Supertrend running above price. Rallies that cannot reclaim the band may roll over.
Frequent side swaps — reduce sensitivity by increasing Enter Mult, using ATR mode, raising the Supertrend factor, or adding Flip Offset ATR.
Use cases
Bias filter — allow entries only in the direction of the current side. Use your preferred triggers inside that bias.
Trailing logic — treat the active band as a dynamic stop. If the side flips or an adverse K·ATR exit prints, reduce or close exposure.
Regime map — on higher timeframes, the combination baseline + band produces a clean up vs down template for allocation decisions.
Tuning guidance
Fast markets — ATR deadband, modest Enter Mult (0.8–1.2), response 0.2–0.35, Supertrend factor 1.7–2.2, small Flip Offset (0.2–0.5 ATR).
Choppy ranges — widen deadband or raise Enter Mult, lower response, and add more Flip Offset so flips require stronger evidence.
Slow trends — longer ATR periods and higher Supertrend factor to keep you on side longer; use a conservative adverse K.
Included alerts
DBHF ST Long — side flips to long.
DBHF ST Short — side flips to short.
Adverse Exit Long / Short — K·ATR stop triggers against the current side.
Strengths
Deadbanded baseline reduces micro whipsaws before Supertrend logic even begins.
Flip hysteresis adds a second layer of confirmation at the boundary.
Optional adverse ATR stop provides a uniform risk cut across assets and regimes.
Clear visuals and minimal parameters to adjust for symbol behavior.
Putting it together
Think of this tool as two decisions layered into one view. The deadband baseline answers “does this move even count,” then the Supertrend wrapped around that baseline answers “if it counts, which side should I be on and where do I flip.” When both parts agree you tend to stay on the correct side of a trend for longer, and when they disagree you get an early warning that conditions are changing.
When the baseline bends and price cannot reclaim the opposite band , momentum is usually continuing. Pullbacks into the baseline that stall before the far band often resolve in trend.
When the baseline flattens and the bands compress , expect indecision. Use the Flip Offset ATR to avoid reacting to the first feint. Wait for a clean band breach with follow through.
When an adverse K·ATR exit prints while the side has not flipped , treat it as a risk event rather than a full regime change. Many users cut size, re-enter only if the side reasserts, and let the next flip confirm a new trend.
Final thoughts
Deadband Hysteresis Supertrend is best read as a regime lens. The baseline defines your tolerance for noise, the bands define your trailing structure, and the flip offset plus adverse ATR stop define how forgiving or strict you want to be at the boundary. On strong trends it helps you hold through shallow shakeouts. In choppy conditions it encourages patience until price does something meaningful. Start with settings that reflect the cadence of your market, observe how often flips occur, then nudge the deadband and flip offset until the tool spends most of its time describing the move you care about rather than the noise in between.

ATR Position Size Calc+Stop guessing your position size. This indicator automatically calculates the optimal number of contracts or shares for each trade.
It is designed for one purpose: to help you maintain consistent risk management by adjusting your trade size based on current market volatility (ATR) and your fixed monetary risk.
// KEY FEATURES
Consistent Risk : Set your max risk in dollars (e.g., $300), and the script calculates the exact position size to match it.
Volatility-Based Stops : Uses the ATR to define a logical stop loss that adapts to market conditions.
Stable Calculation : The calculation is based on the previous closed candle, so the value is reliable and doesn't change intra-bar.
// HOW TO USE
In the settings, simply define your max risk per trade ($) and your ATR parameters. The indicator does the rest.
The essential tool for disciplined trading.
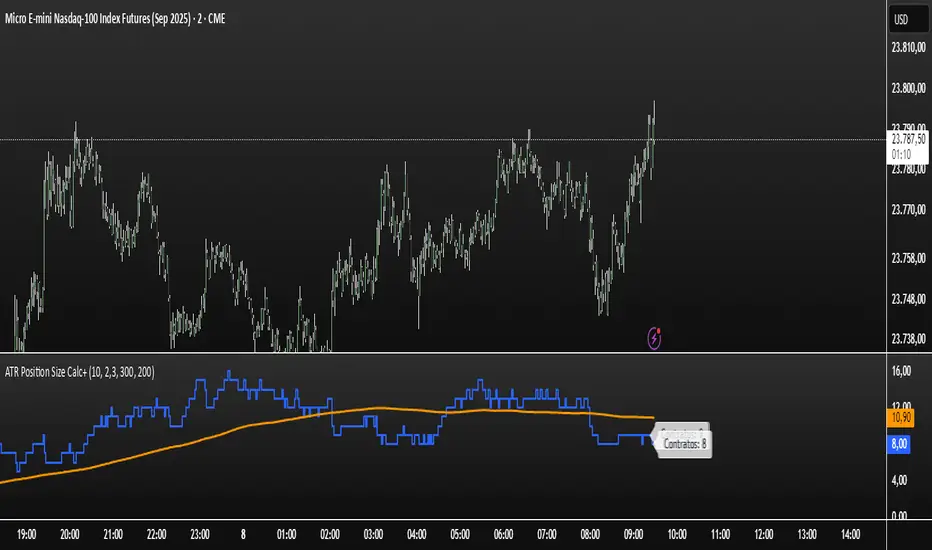
ATR Take Profit (T-Maker)A dead-simple take-profit helper based on ATR.
This script calculates a 14-period Average True Range (ATR) and multiplies it by a user-defined factor, then shows that single number on your chart in a small table (bottom-left). Use it as a quick, volatility-aware distance for setting take-profit levels, scaling out, or gauging whether a move has “room” to breathe.
What it does
Computes ATR(14) × Multiplier every bar.
Displays the result (rounded to 2 decimals) in a clean on-chart label.
Updates only on the last bar to avoid visual noise and keep performance snappy.
Why it’s useful
Volatility-adjusted targets: ATR adapts to changing market conditions, so your TP distance scales with current volatility.
Instrument & timeframe agnostic: Works on any symbol and timeframe supported by TradingView.
Minimalist workflow: No lines or clutter—just the exact distance to add/subtract from your entry.
How to use it
Choose your ATR Multiplier (default = 4).
Example: If ATR(14) = 1.52 and Multiplier = 4 → displayed value = 6.08.
For a long, a simple TP idea is: TP = Entry + xATR.
For a short: TP = Entry − xATR.
Optionally draw a manual horizontal line at your calculated TP level, or use the value to feed your own rules in other scripts.
Tip: Test different multipliers per market/timeframe (e.g., 2–3 for intraday indices, 3–5 for swing on FX/crypto). Optimize in backtests before going live.
Inputs
ATR Multiplier (int): Scales ATR(14) to your preferred TP distance.
Text Color (color): Customize the display color to match your theme.
Notes & Limitations
Uses ATR(14) (fixed) for consistency in this original version.
Displays a single number only—it does not plot levels, draw lines, or place orders.
Value is rounded to 2 decimals and shown bottom-left of the chart.
Version
v1.0 — Original release (minimal, display-only utility)
Created by T-Maker. This tool is for educational purposes only and is not financial advice. Always manage risk and verify settings before trading.
Zone Cluster Confluence ProWhat it does
Zone Cluster Confluence Pro automatically finds price “zones” via equal-frequency clustering of HLC3 values and wraps each cluster center with an ATR-based band. Zones are color-coded by a 0–100 Strength % and can optionally highlight confluence with a higher timeframe (HTF) right on your chart.
Key features
• Adaptive Depth by Volatility (ATR regime): zone width scales down in calm markets and widens in volatile regimes.
• Strength % scoring with color mapping (Strong / Work / Mid / Weak). The score blends:
• number of touches (with tolerance),
• dwell time inside the zone (penalized),
• confirmed breakouts (penalized),
• average overshoot beyond the band (penalized),
• recency bonus,
• optional volume-boosted touches (volume > SMA × multiplier).
• HTF Confluence Overlay: computes zones on a higher TF (multiplier of the source TF or a specific TF) and highlights the intersection of LTF zones with the nearest HTF zone (white fill).
• Presets per TF: Aggressive / Stable / Anti-pierce profiles with hand-tuned params for 15/30/60/120/240m; or run fully Manual.
• Clean visuals: centers, borders, filled bands; strength labels with auto-contrast text.
How it works (high level)
• Clustering method: choose K-median or K-means (median/mean of equal-frequency buckets) to place zone centers.
• Zone width = ATR × Depth; Depth becomes Adaptive when the ATR regime deviates from its long SMA.
• Strength % is computed over a lookback window using the components listed above; touches can earn an extra bonus on elevated volume.
Inputs (most useful)
• Source TF: inherit from chart or pick a specific TF.
• Zones (k): 2–5 clusters.
• Presets: Aggressive / Stable / Anti-pierce, or Manual control of Candles Back, ATR length, Depth.
• Adaptive Depth: on/off, regime thresholds & multipliers.
• Strength %: profile (Conservative/Neutral/Optimistic), lookback, breakout/overshoot/touch tolerance.
• Volume boost: SMA length, spike multiplier, weight.
• HTF Confluence: on/off, TF multiplier, HTF preset/method/params, and whether HTF k mirrors LTF k.
Reading the chart
• Zone fills are colored by Strength %:
• 80–100 Strong, 60–80 Work, 40–60 Mid, <40 Weak.
• White fills mark LTF×HTF intersections (confluence areas).
• Strength labels (Z1…Z5) show the current score; label background matches the strength color.
Tips
• Use Stable for most markets, Aggressive for fast intraday, Anti-pierce to reduce whipsaw.
• Turn on HTF confluence to filter LTF zones down to areas aligned with the larger trend structure.
• If you scalp, keep volume boost on; for thin markets consider lowering the spike multiplier.
Notes
• No lookahead is used for HTF data (request.security with lookahead_off).
• Zones update as new bars arrive and as the lookback window rolls; this is not a fixed S/R drawing tool.
• Works on any symbol/timeframe; parameter tuning is encouraged.
Access
This script is Invite-Only.
Disclaimer
For educational purposes only. Not financial advice. Trading involves risk.

TRADIVEX_ATR TablosuBINANCE:BTCUSDT.P tr.tradingview.com ## **TRADIVEX\_ATR Table – Indicator Description**
**Overview:**
The TRADIVEX\_ATR Table is a versatile trading tool that provides a concise, visual overview of market volatility, price direction, and ATR-based support/resistance levels. Designed for traders seeking quick insights, this indicator combines key metrics into a color-coded table directly on the chart.
**Key Features:**
* **ATR Calculation & Dynamic Bands:**
Measures Average True Range (ATR) over a configurable period and calculates upper and lower price bands using a multiplier. These bands act as dynamic support and resistance levels, adapting automatically to market volatility.
* **Volatility Assessment:**
Displays market volatility as a percentage of the current price. Volatility is classified into **High, Medium, or Low**, with intuitive color coding:
* High → Red
* Medium → Orange
* Low → Green
* **Price Direction:**
Tracks the direction of the current price relative to the previous bar:
* Up → Green
* Down → Red
* Neutral → Gray
* **Information Table:**
Shows all relevant metrics in a structured table overlay, including:
1. ATR Length (period)
2. ATR Multiplier
3. Upper Band Level
4. Lower Band Level
5. Current Price
6. High Price
7. Low Price
8. ATR Value
9. Volatility Level (color-coded)
10. Price Direction (color-coded)
* **Customizable Table Position:**
The table can be positioned anywhere on the chart (top, middle, bottom, left, right, or center), ensuring it doesn’t obstruct your price action analysis.
**Usage & Benefits:**
* Quickly assess market volatility and momentum.
* Identify short-term trends and directional bias.
* Monitor dynamic ATR-based support/resistance levels.
* Make informed decisions for entries, exits, and stop-loss placements.
**Ideal For:**
Traders who want a **real-time, visual summary of market conditions** without cluttering the chart with multiple indicators.
---

𝑨𝒔𝒕𝒂𝒓 - HelAstar – Hel is an adaptive ATR stop system that finds the best ATR length in real time.
@v1.0
Optimizes ATR length automatically within a defined range
Plots dynamic long/short stops with ATR multiplier
Option to use Super Smoother (FFT-lite) filtering
On-chart stats table with performance & win probability
Lightweight, efficient, and no repainting

Smart Money Price Action ProSmart Money Price Action Pro - Smart Money and Price Action Dynamic Toolkit
The Smart Money Price Action Pro is designed to bring together multiple layers of market analysis into a single, cohesive framework, combining trend identification and consolidation detection in an actionable format. While individual indicators can provide useful insights, they often work in isolation. This toolkit integrates market flow detection, range analytics, and adaptive visualization into one system, allowing traders to see the bigger picture without piecing together multiple disconnected tools.
Building on principles from institutional trading behaviors, the toolkit gives traders a clearer picture of where “smart money” may be entering or exiting the market. Its design emphasizes confluence: signals from multiple independent modules overlap to create higher conviction setups, offering a structured edge when planning entries, exits, and risk levels.
At its core, the toolkit addresses the duality of market conditions: trending versus ranging. By offering a combination of trend-following signals and contrarian insights, it helps traders operate with a deeper understanding of market structure. While it provides actionable signals and visual guidance, it is intended as an assistive system, helping traders make more informed decisions rather than serving as a single source of truth.
Key Modules
1. Smart Money Signal Module
The Smart Money Signal Module identifies potential institutional activity by analyzing price swings and momentum shifts. Using configurable swing detection, it highlights potential reversal or continuation zones, expressed as adaptive zones around key market levels.
Signals are augmented with trend-colored candle overlays, offering immediate guidance on market bias. Bullish and bearish zones are clearly marked, while continuation and reversal markers help distinguish between trend shifts and market noise.
At its core, the engine applies swing detection combined with a sensitivity filter to track directional momentum across recent bars. This allows it to pinpoint bullish pivots (where downside momentum fades and strength returns) and bearish pivots (where upside momentum collapses). Once a pivot is confirmed, the system draws flow lines that map the breakout and classify it as either continuation or reversal, depending on broader market bias.
Momentum zones are then plotted to show areas where buyers stepped in with strength or sellers forced price lower. These levels extend forward dynamically, shifting in real time as new data forms. Zones change color the moment they break, visually confirming whether market structure has held or failed. Gradient shading highlights periods of extreme pressure, giving traders a clear visual of when momentum surges into overbought or oversold territory.
Instead of simply showing trend direction, this module also maps accumulation and distribution zones tied to institutional flows. When combined with the Range Module, these zones become more meaningful — for example, when institutional accumulation aligns with a breakout from consolidation.
Practical Use: Traders can use these signals to align trades with institutional flows. For example, entering a long position near a bullish accumulation zone or managing risk when bearish distribution areas form. By combining these insights with higher timeframe analysis, traders can filter out false signals and improve decision-making.
2. Range Detection Module
The Range Detection engine continuously monitors price action to flag when markets transition into consolidation phases. Ranges are defined not just by flat price action, but by a measurable contraction in volatility, repeated touches of boundary levels, and the clustering of traded volume around a central equilibrium point.
Once a valid range is identified, the system assigns a compression strength score (0–100). This score reflects how cleanly defined and structurally sound the consolidation is—higher scores indicate tighter boundaries and stronger evidence of accumulation or distribution.
Breakout tendencies are modeled dynamically. The system updates a forward-looking bias by incorporating:
Boundary time distribution – how often price presses against upper vs. lower edges
Historical breakout patterns – probability benchmarks derived from structurally similar ranges
Volume skew – whether traded volume leans toward buyers or sellers inside the range
Momentum alignment – auxiliary filters such as slope-based oscillators that indicate when energy is building for a directional move
The result is a live breakout forecast that evolves bar by bar as the range matures. Each active range carries a visual strength meter plotted above the consolidation zone, quantifying both compression and breakout potential in real time.
The module also supports range memory, preserving completed consolidations even after a breakout. This allows traders to review the prior structure for post-analysis or to track whether price respects the boundaries of the old range as support or resistance going forward.
Practical Use : Traders can use these ranges to anticipate breakout direction or step aside when conditions are unclear. A tight consolidation near a bullish zone, for instance, often signals a potential long opportunity, while overlapping bearish flows warn of false breakouts.
Integrated Workflow
The strength of the toolkit lies in its synergy. Each module is effective on its own, but the real advantage comes when their signals align.
A typical workflow may include:
Assessing the market trend using the Smart Money Signal Module and its trend-colored overlays
Identifying consolidation and breakout zones with the Range Detection Module
Watching for confluences: institutional accumulation aligning with range compression, or dashboard bias matching local setups
Executing trades with structured confidence, using these layered confirmations rather than relying on a single trigger
This integrated workflow streamlines decision-making and avoids the conflicting signals that can occur when combining unrelated indicators.
Additional Features
Adaptive Visualization : Dynamic zones and trend overlays adjust to volatility, keeping charts clear and focused
Analytics Dashboard : A compact summary panel shows active zones, bullish vs bearish flow counts, and current bias, giving context at a glance
Instead of simply adding more signals, the dashboard provides a meta-layer of analysis — context, bias, and flow strength — helping traders manage risk and stay aligned with broader market conditions.
Use Cases
Trend Confluence : Entering trades in line with prevailing smart money flows while filtering out counter-trend setups
Breakout Trading : Using the Range Detection Module to anticipate breakout zones and confirming direction with institutional flow signals
Contrarian Reversal Trades : Targeting accumulation/distribution zones where both modules indicate potential reversals
Each use case demonstrates how layered confluence creates clarity and conviction, making the toolkit a strong complement to other forms of technical analysis.
Conclusion
The Smart Money Signals Toolkit simplifies complex market analysis into actionable, visually intuitive insights. While standalone indicators provide value, this toolkit goes further by combining smart money flows, range detection, adaptive zones, and dashboard analytics into one cohesive system.
It doesn’t just generate buy/sell markers — it shows why a setup matters, where it is occurring, and how it aligns with broader conditions. This allows traders to operate with greater clarity, structure, and discipline.
Risk Disclaimer : This toolkit and its features are for educational and informational purposes only. Past performance does not guarantee future results. All suggested use cases are theoretical and should be applied with proper risk management.
