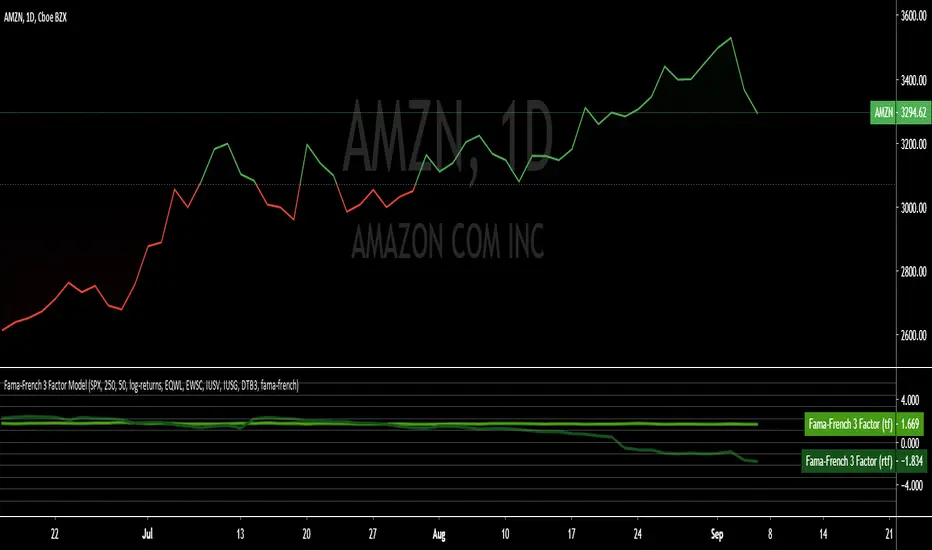
Fama-French 3 Factor ModelFama-French 3 Factor Model
Extension of the Capital Asset Pricing Model (CAPM)
CAPM
Ra = Rfr +
where,
Ra = Return of the Asset
Rfr = Risk-Free Rate
βa = Beta Coefficient of the Asset
Rm - Rfr = Market Risk Premium
Fama-French 3 Factor
r = rf + β1*(rm - rf) + β2(smh) +β3(hml)
r = Expected rate of return
rf = Risk-free rate
ß = Factor’s coefficient (sensitivity)
(rm – rf) = Market risk premium
SMB (Small Minus Big) = Historic excess returns of small-cap companies over large-cap companies
HML (High Minus Low) = Historic excess returns of value stocks (high book-to-price ratio) over growth stocks (low book-to-price ratio)
Small is set to $EWSC
Invesco S&P SmallCap 600® Equal Weight ETF
Big is set to $EQLW
Invesco S&P 100 Equal Weight ETF
High is set to $IUSV
iShares Core S&P US Value ETF
Low is set to $IUSG
iShares Core S&P US Growth ETF
returns selections
'returns'
'logarithmic returns' (use for realized (historical) returns)
'geometric returns' (compounded returns)
risk-free rate selections:
$DTB3
$DGS2
$DGS5
$DGS10
$DGS30
tf = primary time-frame
rtf = reference time-frame
Beta
Realized Variables for Options ComparisonThese variables can be used in comparison with the implied volatility of options.
Variables:
Realized Volatility
mathematical notation lowercase 'sigma'
Realized Variance
mathematical notation lowercase 'sigma' squared
Realized Beta
mathematical notation lowercase 'beta'
Timeframes:
Yearly = 250 or 365
Quarterly = 50 or 90
Monthly = 20 or 30
Important Note:
Options Contract Expiry = barmerge.lookahead_on
"Merge strategy for the requested data position. Requested barset is merged with current barset in the order of sorting bars by their opening time. This merge strategy can lead to undesirable effect of getting data from "future" on calculation on history. This is unacceptable in backtesting strategies, but can be useful in indicators."
[ All other timeframes barmerge.lookahead is disabled.

Risk Metrics: Crypto VersionRisk Metrics for Crypto.
Market can be set to BTCUSD, BTCEUR, BTCCHF, BTCGBP, BTC1!, BTC2!, SPX, and DTB3
Beta
Correlation
Standard Deviation
Variance
R-squared

Portfolio: alpha, beta, stdev, variance, mean, max drawdown...Portfolio Metrics **New**
'returns'
'log returns'
'geometric returns'
portfolio alpha
portfolio beta
portfolio,market correlation
portfolio standard deviation
portfolio variance
mean portfolio returns
maximum drawdown
maximum gain

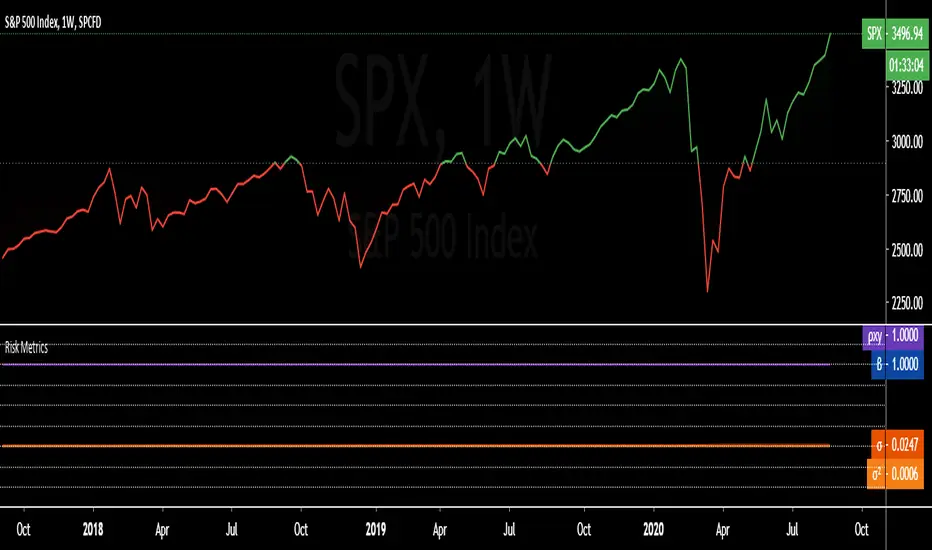
Risk Metrics: beta 'β', correl 'ρxy', stdev 'σ', variance 'σ²'Portfolio Risk Metrics (Part I):
beta 'β'
The beta coefficient can be interpreted as follows:
β =1 exactly as volatile as the market
β >1 more volatile than the market
β <1>0 less volatile than the market
β =0 uncorrelated to the market
β <0 negatively correlated to the market
excerpt from the Corporate Finance Institute
correlation coefficient 'ρxy'
The correlation coefficient is a value that indicates the strength of the relationship between variables.
The coefficient can take any values from -1 to 1. The interpretations of the values are:
-1: Perfect negative correlation. The variables tend to move in opposite directions
(i.e., when one variable increases, the other variable decreases).
0: No correlation. The variables do not have a relationship with each other.
1: Perfect positive correlation. The variables tend to move in the same direction
(i.e., when one variable increases, the other variable also increases).
excerpt from the Corporate Finance Institute
standard deviation 'σ'
68% of returns will fall within 1 standard deviation of the arithmetic mean
95% of returns will fall within 2 standard deviations of the arithmetic mean
99% of returns will fall within 3 standard deviations of the arithmetic mean
excerpt from Corporate Finance Institute
variance 'σ²'
In investing, variance is used to compare the relative performance of each asset in a portfolio.
Because the results can be difficult to analyze, standard deviation is often used instead of variance.
In either case, the goal for the investor is to improve asset allocation.
excerpt from Investopedia
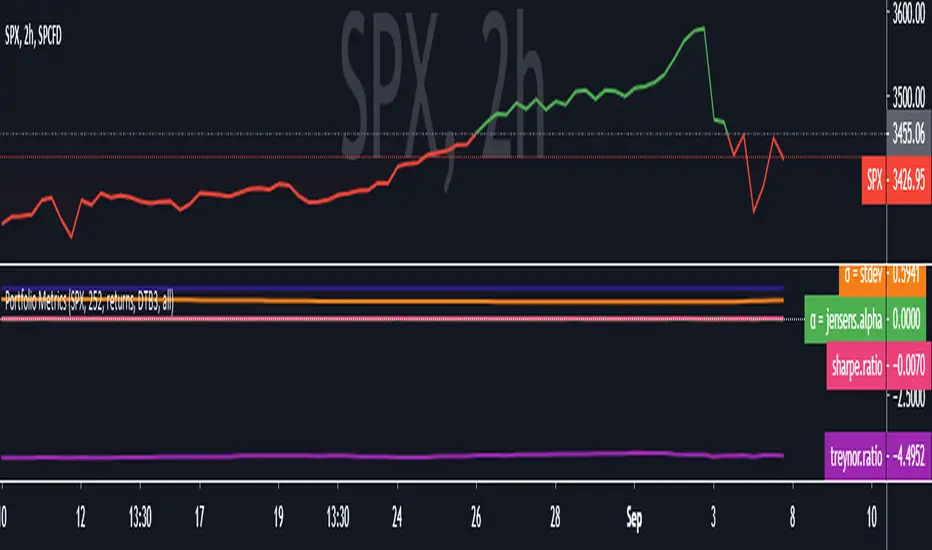
Portfolio Metrics = α(Jensen's), β, CAPM(Ra), Sharpe, TreynorPortfolio Metrics...
Standard Deviation
Jensen's Alpha
Beta
Expected Return (CAPM, Ra)
Sharpe Ratio
Treynor Ratio
Alpha & BetaAlpha & Beta Indicators for Portfolio Performance
β = Σ Correlation (RP, RM) * (σP/σM)
α P = E(RP) –
Where,
RP = Portfolio Return (or Investment Return)
RM = Market Return (or Benchmark Index)
RF = Risk-Free Rate
How to use the Indicator
RM = SPX (Default)
The Market Return for the indicator has the options of $SPX, $NDX, or $DJI (S&P 500, Nasdaq 100, Dow 30)
RF = FRED: DTB3
The Risk-Free Rate in the Indicator is set to the 3-Month Treasury Bill: Secondary Market Rate
The Default Timeframe is 1260 or 5-Years (252 Trading Days in One Year)
RP = The symbol you enter
HOWEVER , you can determine your portfolio value by following the following directions below.
Note: I am currently working on an indicator that will allow you to insert the weights of your positions.
Complete Portfolio Analysis Directions
You will first need...
a) spreadsheet application - Google Sheets is Free, but Microsoft Excel will convert ticker symbols to Stocks and Retrieve Data.
b) your current stock tickers, quantity of shares, and last price information
In the spreadsheet,
In the first column list the stock tickers...
AMZN
AAPL
TSLA
In the second column list the quantity of shares you own...
5
10
0.20
In the third column insert the last price
Excel: Three tickers will automatically give you the option to "Convert to Stocks",
after conversion, click once on cell and click the small tab in the upper right-hand of the highlighted cell.
Click the tab and a menu pops up
Find "Price", "Price Extended-Hours", or "Previous Close"...
$3,284.72
$497.48
$2,049.98
Next, multiply the number of shares by the price (Stock Market Value)
Excel: in fourth column type "=(B1*C1)", "=(B2*C2)", "=(B3*C3)"...
= $16,423.60
= $4,974.80
= $410.00
add the three calculated numbers together or click "ΣAutoSum" (Portfolio Market Value)
= $21,808.40
Last, divide the market value of AMZN ($16,423.60) by the Portfolio Market Value ($21,808.40) for each of the stocks.
= 0.7531
= 0.2281
= 0.0188
These values are the weight of the stock in your portfolio.
Go back to TradingView
Enter into the "search box" the following...
AMZN*0.7531 + AAPL*0.2281 + TSLA*0.0188
and click Enter
Now you can use the "Alpha & Beta" Indicator to analyze your entire portfolio!

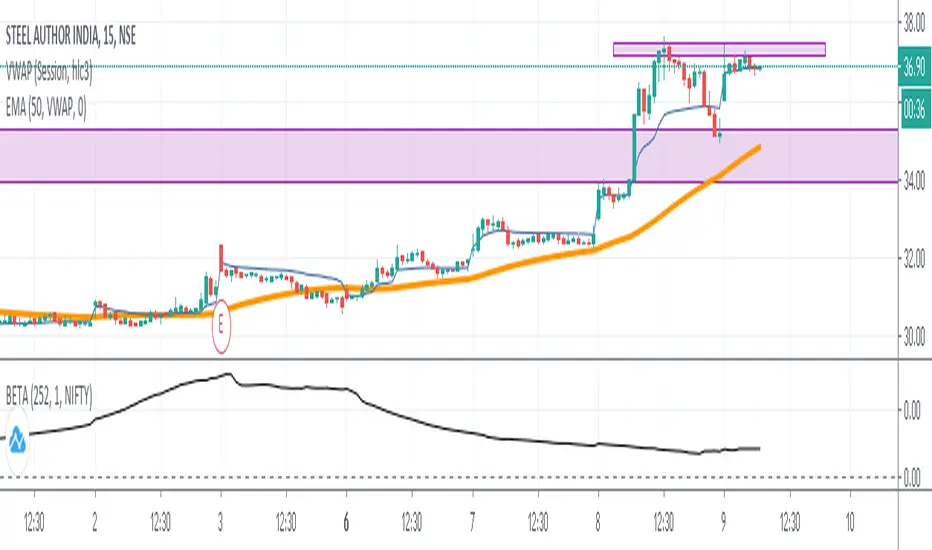
Beta 252 Days (NIFTY 50) by AkshayThe script derives the Beta Value of 252 days of a stock with Benchmark Index NIFTY 50. Note:- I have edited the script using an existing Beta script by Ricardo Santos. Thank you to him! :)
Hello VWAP "Beta"This is my 1st indicator, and my attention is to plot the VWAP "Volume-weighted average price" using the SMA "Simple Moving Average" over time... IE over the last 50,100,200 bars and just the VWAP... All of them in just one line... I have made it when I have been using the BTC/US chart, but it should work for stocks/forex or any other chart that you want to use...
I am not completely sure about this indicator and I do want to add more to this, that is how come I am posting to the community to show what I have done and people can use it and if they are open to it give me feedback or tips to make it better...
Happy trading...

SPY RelativeShows an instrument's sentiment in a day (or week) compared to the market (SPY default). The Red line shows bearish sentiment compared to the market and the green is bullish. Technically this works like a proxy for Alpha/Beta factor.

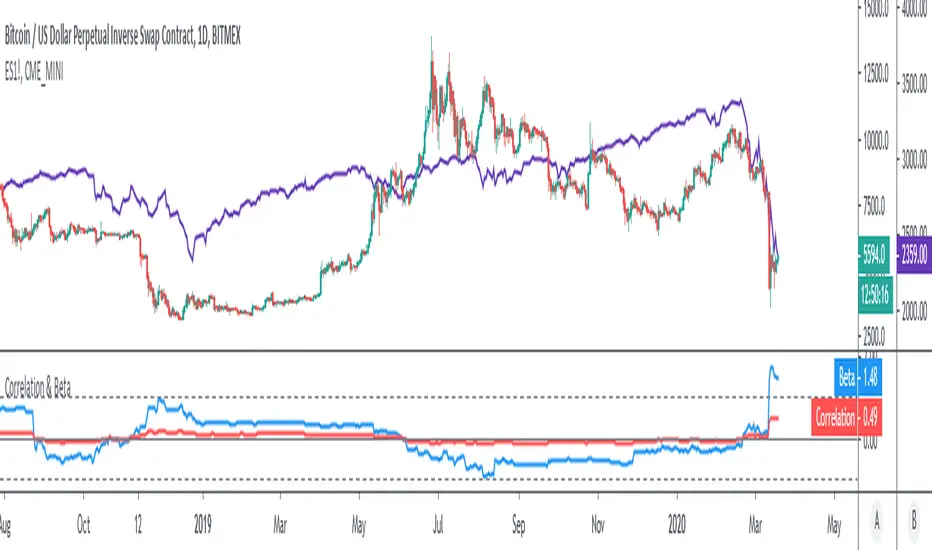
Correlation & BetaDisplay the correlation coefficient and/or Beta of an asset to a specified market.
Options to:
- Specify market (S&P500 futures by default)
- Display one or other metrics
- Modify assessment period (200 bars by default)
- Calculate on price, returns or log-returns
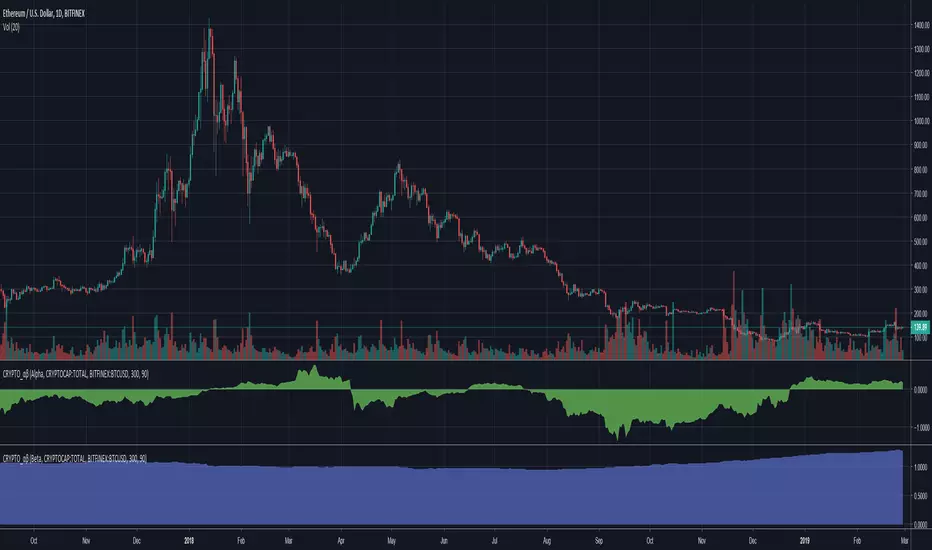
Cryptocurrency α / β (Alpha and Beta)Alpha and Beta for cryptocurrency. Custom input for other symbols.
Anomaly Indicator V1.1 The Anomaly Indicator is an idea I recently come up with. Its very simple, yet it can be extremely useful. The Anomaly indicator detects the current and general trend channels. When the yellow line which is the current channel, exits the general channel this will usually mean an anomaly. Anomalies can vary within meaning, from a trend reversal, a market change (trending or rangebound) and lastly it can also give you an entering point. You can even use it to know the volatility of the market.
This is a very early version of the indicator and has pre-set values. I personally use it among a 5 minute chart for daytrading.
NOTE : Have in mind my indicator as ny other is not perfect, it might give fake signals. I suggest using Williams Alligator, and RSI with it. Best of luck. Follow my predictions under your own risk.

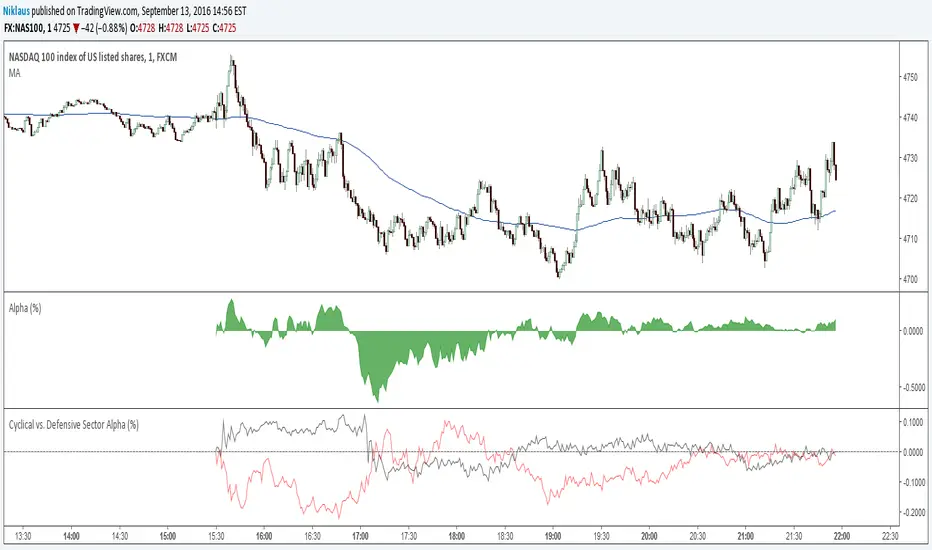
Cyclical vs. Defensive Sector Alphashows mean excess returns of defensive and cyclical sectors vs. S&P500

Betaen.wikipedia.org(finance)
Beta is a measure of the risk arising from exposure to general market movements as opposed to idiosyncratic factors.
The market portfolio of all investable assets has a beta of exactly 1 (here the S&P500). A beta below 1 can indicate either an investment with lower volatility than the market, or a volatile investment whose price movements are not highly correlated with the market

AlphaAlpha is a measure of the active return on an investment, the performance of that investment compared to the S&P500 index, where 0.01 = 1%
alpha < 0: the investment has earned too little for its risk (or, was too risky for the return)
alpha = 0: the investment has earned a return adequate for the risk taken
alpha > 0: the investment has a return in excess of the reward for the assumed risk

K.M Trend Alerts (BETA 1.2)Like I said previously in the " K.M Trend Strategy (BETA 1.2) " this is the script to set alerts. If you haven't seen the strategy one please search it. Please look at the strategy post to see more information. Thank you.
Buy Alerts = P (greater then) B
Sell Alerts = P (less then) B
Sincerely,
Kevin Manrrique
Follow us on Instagram: TWTForexGroup, we have amazing content and also sell signals.

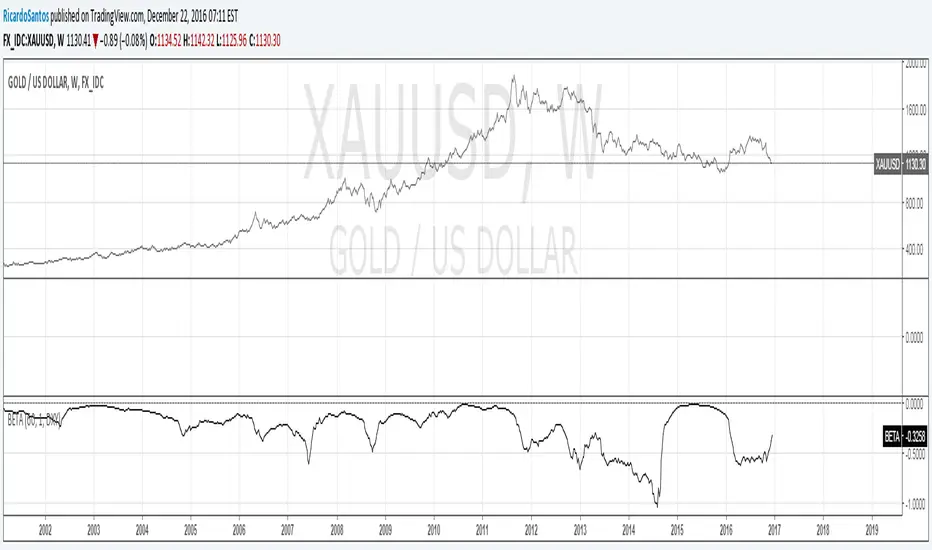
Market BetaPlots the historical beta of the selected security to the S&P500. The observation period is adjustable

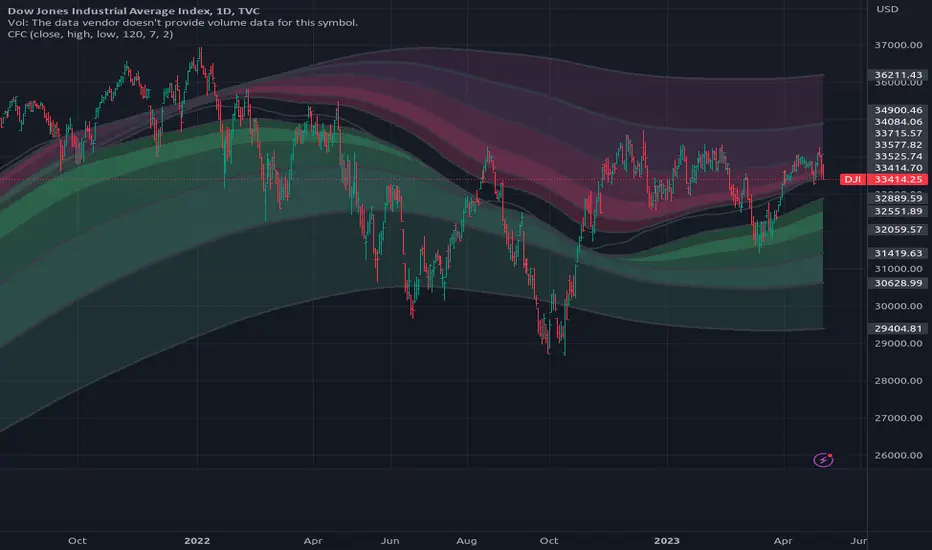
[RS][UNTESTED]CAP Fibo Channel V2V2 of previous CFC, added optional bull/bear squeeze.
squeeze can get a bit messy on extremely oversold/overbought markets like currently USDJPY in 1 hour timeframe, or any currency on low time frame during high volatility.
[RS]Absolute Levelsstudy is still in early phase of development and is a bit slow loading be patient.
Absolute levels based on historic highest high value and time frame. looking for feedback ;)
