Bill Williams Indicators
🎯 Super MA Arrows with Trend Bands🎯 Core Structure of the Indicator
1. Input Parameters Configuration
One of the most comprehensive indicators, featuring 50+ configurable variables, categorized into:
MA Settings: Define MA types and periods
Signal Settings: Customize signal conditions
Display Settings: Manage visual outputs
AI Settings: Enable/disable learning module
Multi-Timeframe Settings: Analyze across multiple timeframes
2. Moving Average & Envelope Calculations
The indicator employs multiple moving averages and an adaptive envelope:
Fast MA: Captures short-term movement (default: 9)
Slow MA: Reflects overall trend direction (default: 21)
Filter MA: Filters market noise (default: 50)
Envelope: Auto-adjusting support/resistance zones
3. Market Structure Analysis
Purpose: Confirm the market’s directional bias by evaluating swing highs/lows, breakouts, and consolidation zones.

Super MA Arrows with Trend Bands1. Input Parameters Configuration
One of the most comprehensive indicators, featuring 50+ configurable variables, categorized into:
MA Settings: Define MA types and periods
Signal Settings: Customize signal conditions
Display Settings: Manage visual outputs
AI Settings: Enable/disable learning module
Multi-Timeframe Settings: Analyze across multiple timeframes
2. Moving Average & Envelope Calculations
The indicator employs multiple moving averages and an adaptive envelope:
Fast MA: Captures short-term movement (default: 9)
Slow MA: Reflects overall trend direction (default: 21)
Filter MA: Filters market noise (default: 50)
Envelope: Auto-adjusting support/resistance zones
3. Market Structure Analysis
Purpose: Confirm the market’s directional bias by evaluating swing highs/lows, breakouts, and consolidation zones.

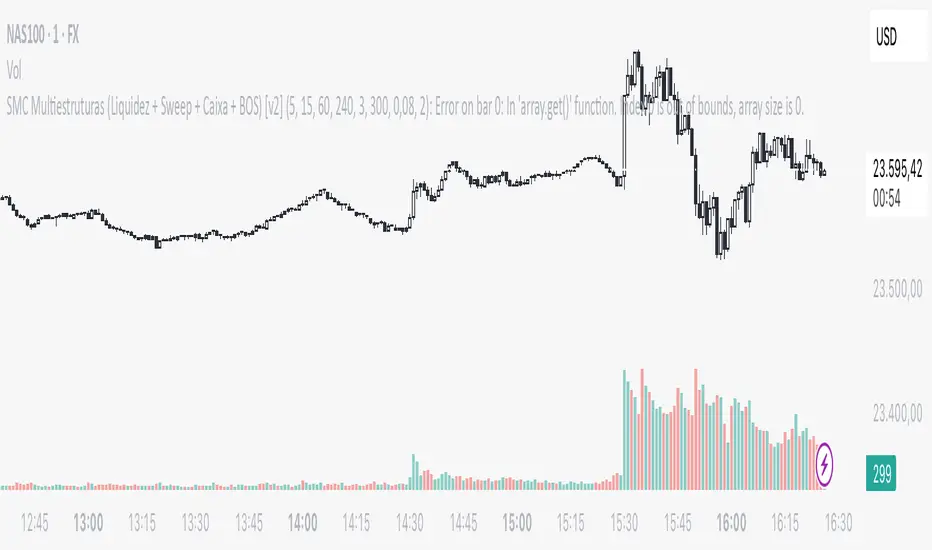
SMC Multiestruturas (Liquidez + Sweep + Caixa + BOS) [v2]indicador multiframe com identicacao de liquidez manipulação e quebra de estruturas
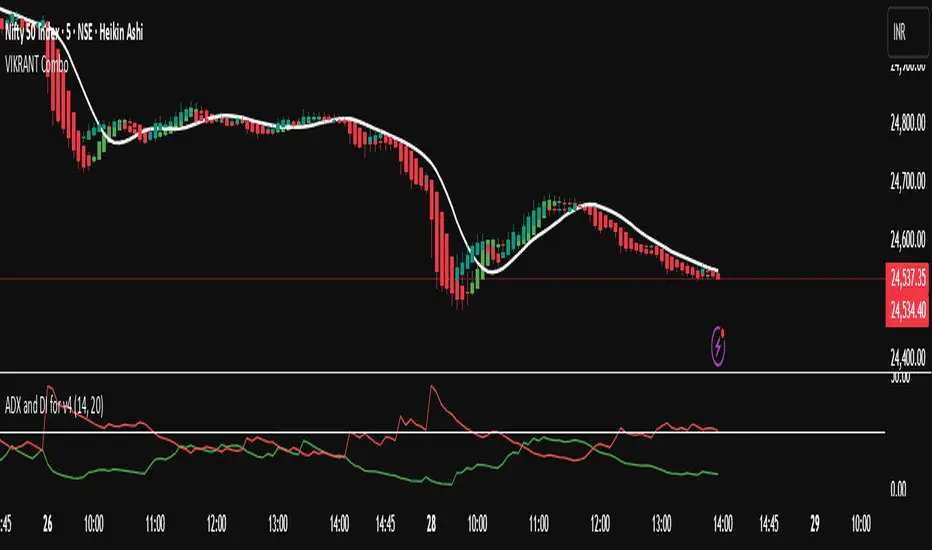
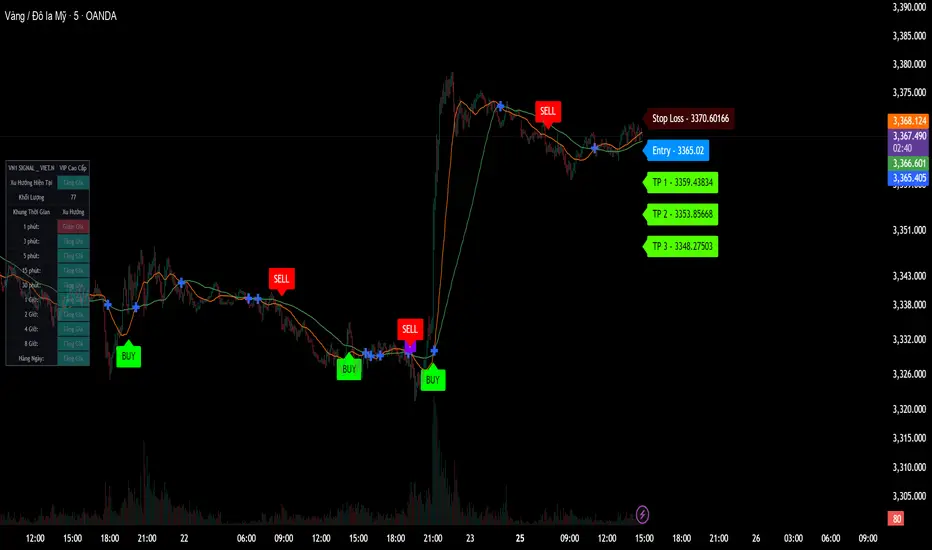
HANUMAN INDICATORThe VIKRANT INDICATOR is a powerful all-in-one TradingView tool designed for traders who want accuracy, clarity, and confidence in their trades. Built with advanced technical logic, it helps identify market trends, entry & exit points, and high-probability trade setups across Forex, Crypto, Indices, Stocks, and Commodities.
⚡ Key Features:
✅ Smart Trend Detection using multi-layer confluence (EMA / Supertrend / RSI / Volume logic)
✅ Clear Buy/Sell signals with chart labels
✅ Built-in Stop Loss (SL), Take Profit (TP), and Trailing Stop system
✅ Works on all timeframes – from scalping (1m/5m) to intraday & swing trading
✅ Backtestable strategy to check accuracy & performance
✅ Fully customizable settings for every trader’s style
3-Candle Reversal Pattern-vahid2star3-Candle Reversal Zones + Hammer Confirmation (with Risk Management & Alerts)
This script combines 3-candle reversal detection, hammer confirmations, and smart demand/supply zone plotting into a single tool designed for both discretionary and automated traders.
🔍 Core Logic
3-Candle Reversal Pattern
Candle-1: Strong move in one direction (big body).
Candle-2: Doji-like candle (high shadow/body ratio).
Candle-3: Reversal candle in the opposite direction (large body relative to Candle-2).
A gap after Candle-3 is required for extra confirmation.
Hammer Confirmation (Hammer-1 & Hammer-2)
After a valid 3-candle setup, the script searches for a hammer pattern near the zone.
Hammer-1: Draws a box directly on the hammer range if followed by a strong confirming candle.
Hammer-2: If another hammer forms after the confirmation candle and holds for N bars (configurable), a second hammer box is drawn.
Demand & Supply Zones
For bullish setups, a demand zone is created from the Candle-2 low to the Candle-1 low.
For bearish setups, a supply zone is created from the Candle-2 high to the Candle-1 high.
Zones extend to the right until price interacts with them.
🛠 Filters & Quality Controls
Trend filter (optional):
Only draw zones if price respects higher-timeframe EMA200 slope and LTF EMA alignment.
Market structure filter:
Require higher-high / higher-low (for bullish) or lower-high / lower-low (for bearish).
ATR filter:
Zones must have a minimum height relative to ATR.
Overlap control:
Avoid drawing zones that overlap too heavily with existing ones.
Cooldown:
Restrict consecutive zones of the same type within a user-defined bar distance.
🎯 Risk Management & Strategy
Dynamic position sizing:
Trade size is automatically calculated from account equity, risk %, and leverage.
Stop-loss & Take-profit:
SL placed just beyond the zone ± buffer ticks.
TP automatically set at user-defined Reward:Risk ratio (e.g., 3:1).
Capital protection:
Trades respect max leverage and risk per position settings.
⚡ Alerts
The script provides one-time alerts for each zone:
🔔 First Touch Alert → Triggered when price first touches a demand, supply, or hammer box.
Each zone only fires one alert, avoiding duplicates on re-touch or trade exit.
📊 Visuals
Demand zones: Green boxes.
Supply zones: Red boxes.
Hammer boxes: Blue (bullish) / Orange (bearish).
Used zones: Greyed out after price fills them.
Outcomes: Zones change to green if TP is hit, red if SL is hit.
Optional labels mark “Bullish zone ✓”, “Bearish zone ✓”, “Hammer-1 ✓”, or “Hammer-2 ✓” when confirmed.
🔧 Settings Overview
Core pattern ratios (C1/C2, C3/C2 size multipliers).
Doji definition (shadow/body ratio).
Hammer search depth, confirmation delay, and strictness.
Risk % per trade, leverage cap, stop buffer, RR ratio.
Visual styling (colors, max box count, labels).
Trend, structure, ATR, overlap, and cooldown filters.
Option to disable orders (use as indicator + alerts only).
⚠️ Disclaimer
This script is a technical analysis tool intended for educational purposes.
It does not guarantee profits. Use proper risk management and test thoroughly before applying in live trading.
✨ With its combination of 3-candle reversals, hammer confirmations, and smart filtering, this script is designed to reduce noise, highlight high-probability zones, and give traders both visual structure and actionable alerts.

Williams Fractals by Sheridan Sadewa modif untuk menggunakan fractal yang ukurannya lebih kecil dan deket

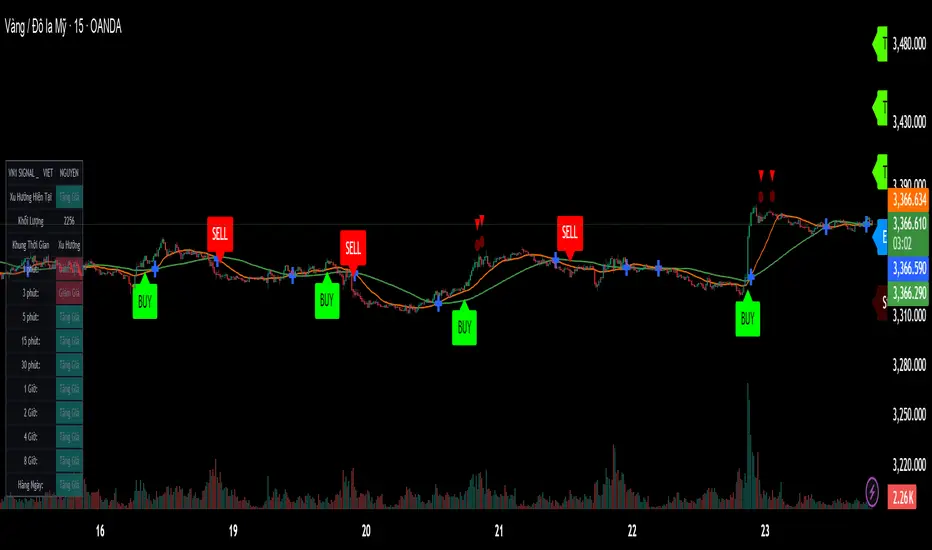
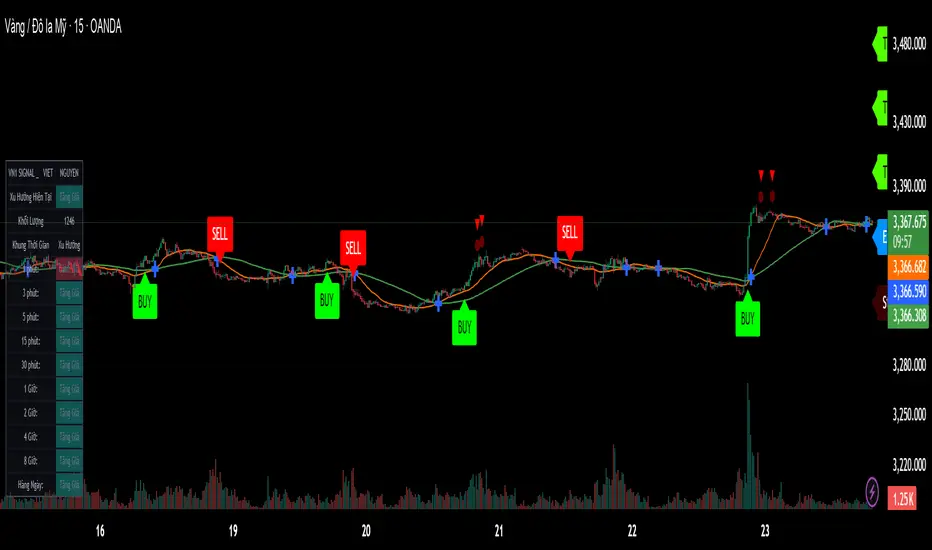
VietNguyen2 AlgoThis is indicator of Vietnammes. I am living at Da Nang city.
If you want to meeting then call me 0888135999
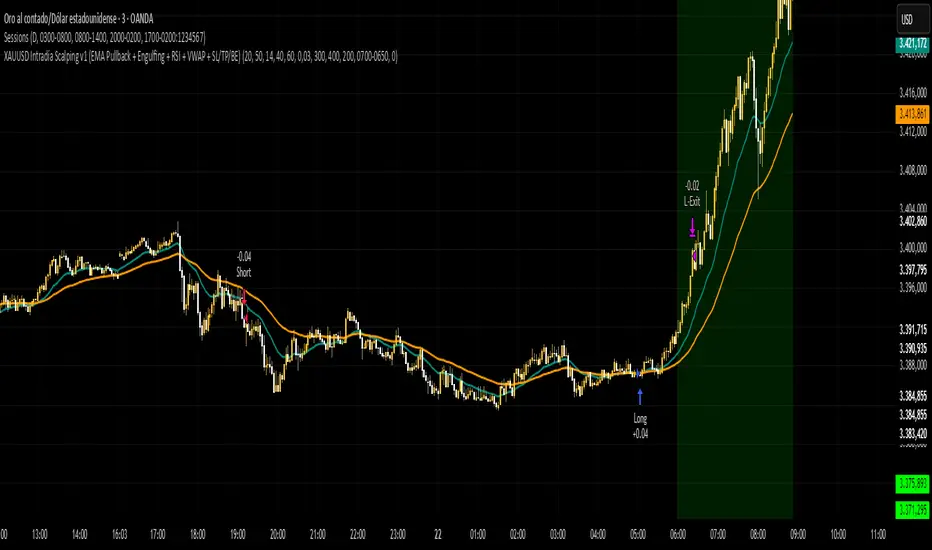
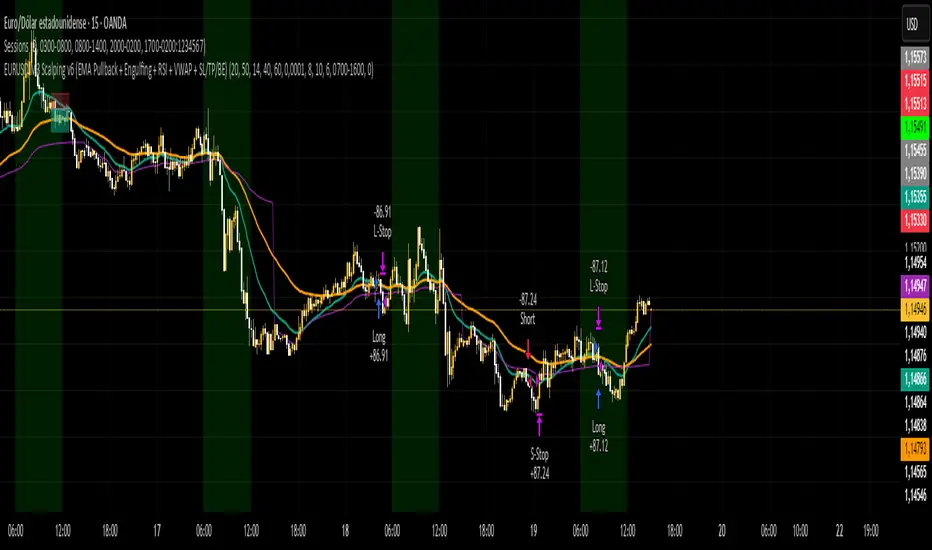
Estrategy EURUSD M3 Scalping Estrategia para operar el EURUSD en temp de 3 min, indica sl y tp 6 pips sl y 10 pips tp
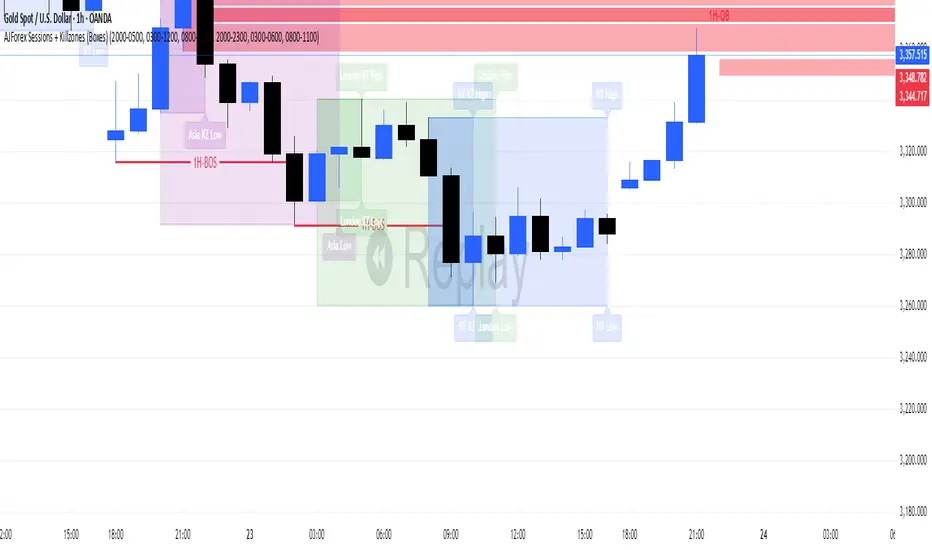
AJForex Sessions + Killzones (Boxes)use timeline UTC -4 AJForex Sessions + Killzones (Boxes)AJForex Sessions + Killzones (Boxes)AJForex Sessions + Killzones (Boxes)AJForex Sessions + Killzones (Boxes)AJForex Sessions + Killzones (Boxes)AJForex Sessions + Killzones (Boxes)AJForex Sessions + Killzones (Boxes)AJForex Sessions + Killzones (Boxes)AJForex Sessions + Killzones (Boxes)
Twin Range Filter StrategyClarity Over Confusion: See price action through a全新的 lens. Watch as erratic, choppy movements are smoothed into a clear, actionable trajectory. The path of least resistance becomes obvious.
Confidence Over Hesitation: Receive high-probability entry and exit signals with a proven logic that waits for the market to commit before you do. No more second-guessing.
Discipline Over Emotion: Our algorithm enforces a systematic approach, helping you avoid emotional FOMO chasing and panic selling. Stick to the plan and execute with precision.
What Can You Expect?
Dynamic Adaptability: Unlike static indicators, continuously adapts to volatility. It widens its filter in turbulent markets to avoid whipsaws and tightens it in trending markets to capture more of the move.
The Power of Two: By synthesizing data from two distinct market perspectives, it confirms strength and filters out weakness, providing a confluence that standalone indicators simply cannot match.
Clean, Unambiguous Signals: We’ve eliminated the clutter. The software provides clear visual alerts (Green Arrows for Long, Red Arrows for Short) right on your chart, telling you exactly when the equilibrium has shifted.
Who is this for?
Swing Traders looking to capture the heart of a trend and avoid false breakouts.
Day Traders needing a reliable filter to navigate volatile intraday action.
Systematic Traders seeking a robust logic layer to add to their automated strategy.
Anyone overwhelmed by indicator overload and craving a single, trusted source of truth on their chart

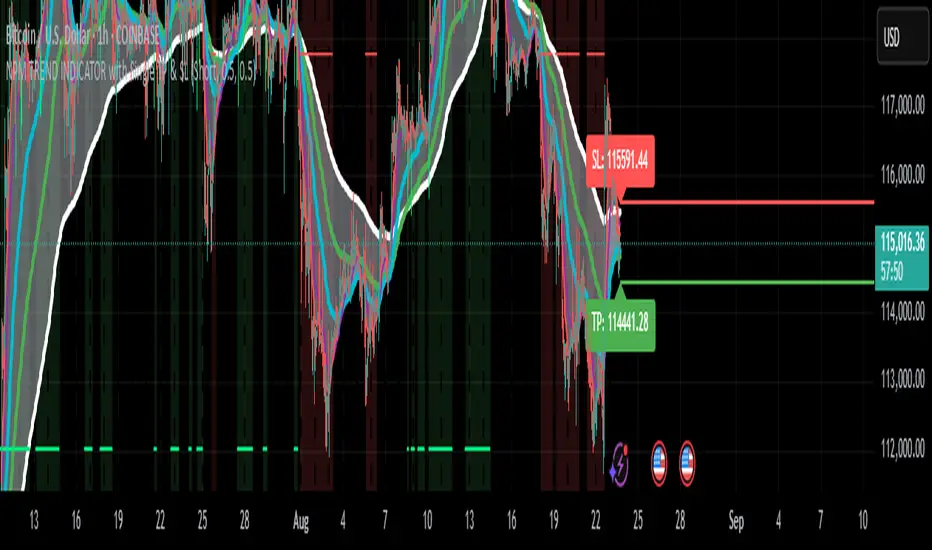
NPM Trend Indicator ProNPM Trend Indicator Pro
The NPM Trend Indicator Pro is a closed-source, professional-grade trend detection tool designed to help traders identify high-probability directional moves in the market. It combines multiple technical factors to generate clear, actionable trend signals while filtering out noise and reducing false entries.
What it does
Displays trend direction (uptrend, downtrend, or neutral) for the selected symbol.
Shows a confidence or strength score to indicate how reliable the trend signal is.
Highlights potential areas of market exhaustion or reversal based on aggregated trend analysis.
Provides visual cues on the chart to assist with trade timing and risk management.
How it works (concept-level)
Integrates multiple trend-detection methods, including moving average structures, momentum confirmation, and volatility assessment.
Uses adaptive filters to avoid false signals during sideways or choppy market conditions.
Includes zone awareness to help traders avoid entering trades too close to likely reaction points.
Aggregates all signals into a single output to give traders a concise, actionable overview.
How to use it
1. Apply the indicator to your chosen symbol.
2. Observe the trend direction and confidence score displayed on the chart.
3. Confirm that the trend aligns with your trading strategy and timeframe.
4. Use the visual cues for potential entry, exit, and risk management decisions.
Alerts
Optionally set alerts when trend direction changes or when the confidence score reaches a user-defined threshold.
Notes
Suitable for multiple markets, including forex, indices, crypto, and equities.
Can be used for intraday scalping, swing trading, or longer-term trend analysis depending on the trader’s selected timeframe.
⚠️ Disclaimer: This script is for educational purposes only and is not financial advice. Trading involves risk, and you can lose money. Always test strategies on a demo account and use proper risk management.
NPM Rsi DivergenceNPM RSI Divergence Indicator
The NPM RSI Divergence Indicator is a closed-source tool designed to help traders identify potential reversals and high-probability trade setups using divergence between price action and the Relative Strength Index (RSI). It highlights areas where momentum is weakening or strengthening, giving traders early signals of potential trend changes.
What it does
Detects divergences between RSI and price movement, indicating potential trend reversals or continuation.
Shows the strength or reliability of each divergence signal to help traders gauge probability.
Plots visual markers directly on the chart for easier recognition of potential setups.
Helps traders spot early exhaustion points in trends before price reverses or continues strongly.
How it works (concept-level)
Compares price highs/lows with RSI highs/lows to detect hidden or regular divergences.
Applies adaptive filtering to reduce false signals in choppy or low-volatility markets.
Aggregates divergence signals into clear visual markers and strength indicators.
Incorporates momentum context to highlight divergences that are more likely to produce actionable moves.
How to use it
1. Apply the indicator to your chosen symbol and timeframe.
2. Observe divergence markers and their strength indicators on the chart.
3. Confirm potential trade opportunities by considering trend direction and market context.
4. Use divergence signals to assist with trade entry, exit, or risk management decisions.
Alerts
Optionally set alerts when divergence signals appear or when the strength indicator exceeds a user-defined threshold.
Notes
Suitable for multiple markets, including forex, indices, crypto, and equities.
Can be used on intraday or swing trading timeframes depending on your trading strategy.
⚠️ Disclaimer: This script is for educational purposes only and is not financial advice. Trading involves risk, and you can lose money. Always test strategies on a demo account and practice proper risk management.

EMA 20–55 + SMMA50 (20↔55 Band, Alerts, Color Controls)This script plots a customizable EMA ribbon and a smoothed moving average (SMMA).
Key features:
EMA 20 (blue) and EMA 55 (yellow) highlighted with a green/red background ribbon depending on trend.
Optional middle EMAs (25, 30, 35, 40, 45, 50) can be shown or hidden.
SMMA (50) plotted in white as a trend smoother.
Customizable line colors, band colors, and transparency.
Alerts for EMA20/EMA55 bullish or bearish crossovers.
Optional candle bar coloring based on trend.
This is useful for quickly spotting medium-term trend shifts when EMA20 crosses EMA55, while still tracking the broader EMA ribbon context.

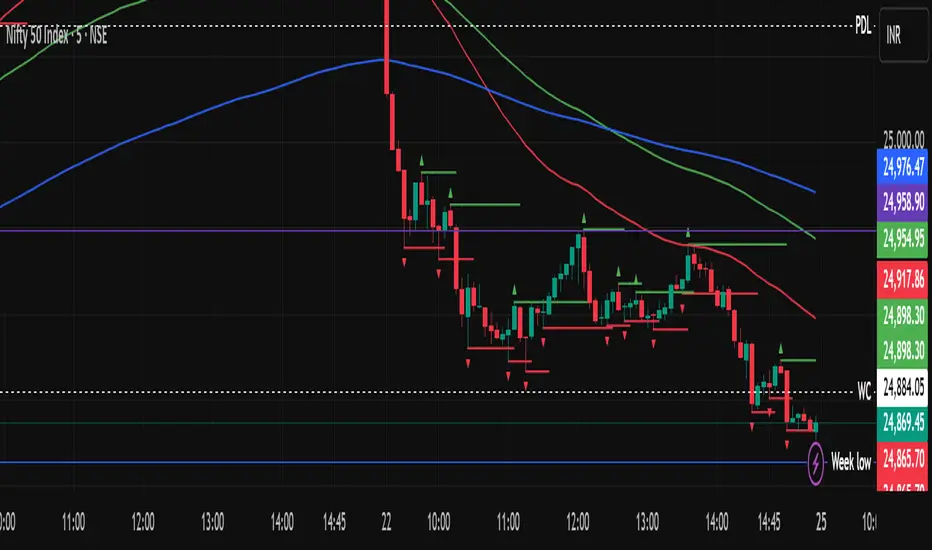
Pivot Matrix & Multi-Timeframe Support-Resistance Analytics________________________________________
📘 Study Material for Pivot Matrix & Multi Timeframe Support-Resistance Analytics
(By aiTrendview — Educational Use Only)
________________________________________
🎯 Introduction
The Pivot Matrix & Multi Timeframe Support-Resistance Analytics indicator is designed to help traders visualize pivot points, support/resistance levels, VWAP, and volume flow analytics all in one place. Rather than giving explicit buy/sell calls, the dashboard provides reference insights so a learner may understand how different technical levels interact in real time.
This document explains its functionality step by step with formulas and usage guides.
________________________________________
1️⃣ Pivot System Logic
Pivot points are classic tools for mapping market support and resistance levels.
✦ How Calculated?
Using the Traditional Method:
• Pivot Point (PP):
PP=Highprev+Lowprev+Closeprev3PP = \frac{High_{prev} + Low_{prev} + Close_{prev}}{3}PP=3Highprev+Lowprev+Closeprev
• First Support/Resistance:
R1=2×PP−Lowprev,S1=2×PP−HighprevR1 = 2 \times PP - Low_{prev}, \quad S1 = 2 \times PP - High_{prev}R1=2×PP−Lowprev,S1=2×PP−Highprev
• Second Support/Resistance:
R2=PP+(Highprev−Lowprev),S2=PP−(Highprev−Lowprev)R2 = PP + (High_{prev} - Low_{prev}), \quad S2 = PP - (High_{prev} - Low_{prev})R2=PP+(Highprev−Lowprev),S2=PP−(Highprev−Lowprev)
• Third Levels:
R3=Highprev+2×(PP−Lowprev),S3=Lowprev−2×(Highprev−PP)R3 = High_{prev} + 2 \times (PP - Low_{prev}), \quad S3 = Low_{prev} - 2 \times (High_{prev} - PP)R3=Highprev+2×(PP−Lowprev),S3=Lowprev−2×(Highprev−PP)
• Similarly, R4/R5 and S4/S5 are extrapolated from extended range multipliers.
✦ How Used?
• Price above PP → bullish control bias.
• Price below PP → bearish control bias.
• R1–R5 levels act as resistances; S1–S5 act as supports.
Learners should watch how candles behave when approaching R/S zones to spot breakout vs. rejection conditions.
________________________________________
2️⃣ Multi Timeframe Logic
The indicator allows using daily-based pivot values (via request.security). This ensures alignment with institutional daily levels, not just intraday recalculations.
✦ Teaching Value
Understanding MTF pivots shows how markets respect higher timeframe levels (daily > intraday, weekly > daily). This helps learners grasp nested support-resistance structures.
________________________________________
3️⃣ VWAP (Volume Weighted Average Price)
Formula:
VWAPt=∑(Pricei×Volumei)∑(Volumei),Pricei=High+Low+Close3VWAP_t = \frac{\sum (Price_i \times Volume_i)}{\sum (Volume_i)}, \quad Price_i = \frac{High + Low + Close}{3}VWAPt=∑(Volumei)∑(Pricei×Volumei),Pricei=3High+Low+Close
Usage:
• VWAP is used as an institutional benchmark of fair value.
• Above VWAP = bullish flow.
• Below VWAP = bearish flow.
Learners should check whether price respects VWAP as a magnet or uses it as support/resistance.
________________________________________
4️⃣ Volume Flow Analysis
The script classifies buy volume, sell volume, and neutral volume.
• Buy Volume = if close > open.
• Sell Volume = if close < open.
• Neutral Volume = if close = open.
For daily tracking:
Buy%=DayBuyVolDayTotalVol×100,Sell%=DaySellVolDayTotalVol×100Buy\% = \frac{DayBuyVol}{DayTotalVol} \times 100, \quad Sell\% = \frac{DaySellVol}{DayTotalVol} \times 100Buy%=DayTotalVolDayBuyVol×100,Sell%=DayTotalVolDaySellVol×100
Usage for Learners:
• Dominant Buy% → accumulation/ bullish pressure.
• Dominant Sell% → distribution/ bearish pressure.
• Balanced → sideways liquidity building.
This teaches observation of order flow bias rather than relying only on price.
________________________________________
5️⃣ Dashboard Progress Bars & Colors
The script uses visual progress bars and dynamic colors for clarity. For example:
• VWAP Backgrounds: Green shades when price strongly above VWAP, Red when below.
• Volume Bars: More green blocks mean buying dominance, red means selling pressure.
This visual design turns concepts into easy-to-digest cues, useful for training.
________________________________________
6️⃣ Market Status Summary
Finally, the dashboard synthesizes all data points:
• Price vs Pivot (above or below).
• Price vs VWAP (above or below).
• Volume Pressure (buy side vs sell side).
Status Rule:
• If all three align bullish → Status box turns green.
• If mixed → Neutral grey.
• If bearish dominance → weaker tone.
Why Important?
This teaches learners that market conditions should align in confluence across indicators before confidence arises.
________________________________________
⚠️ Strict Disclaimer (aiTrendview)
The Pivot Matrix & Multi Timeframe Support-Resistance Analytics tool is developed by aiTrendview for strictly educational and research purposes.
❌ It does NOT provide buy/sell recommendations.
❌ It does NOT guarantee profits.
❌ Unauthorized use, copying, or redistribution of this code is prohibited.
⚠️ Trading Risk Warning:
• Trading involves high risk of financial loss.
• You may lose more than your capital.
• Past levels and indicators do not predict future outcomes.
This tool must be viewed as a visual education aid to practice technical analysis skills, not as trading advice.
________________________________________
✅ Now you have a step by step study guide:
• Pivot calculations explained
• VWAP with logic
• Volume breakdown
• Visual analytics
• Status confluence logic
• Disclaimer for compliance
________________________________________
⚠️ Warning:
• Trading financial markets involves substantial risk.
• You can lose more money than you invest.
• Past performance of indicators does not guarantee future results.
• This script must not be copied, resold, or republished without authorization from aiTrendview.
By using this material or the code, you agree to take full responsibility for your trading decisions and acknowledge that this is not financial advice.
________________________________________
⚠️ Disclaimer and Warning (From aiTrendview)
This Dynamic Trading Dashboard is created strictly for educational and research purposes on the TradingView platform. It does not provide financial advice, buy/sell recommendations, or guaranteed returns. Any use of this tool in live trading is completely at the user’s own risk. Markets are inherently risky; losses can exceed initial investment.
The intellectual property of this script and its methodology belongs to aiTrendview. Unauthorized reproduction, modification, or redistribution of this code is strictly prohibited. By using this study material or the script, you acknowledge personal responsibility for any trading outcomes. Always consult professional financial advisors before making investment decisions.

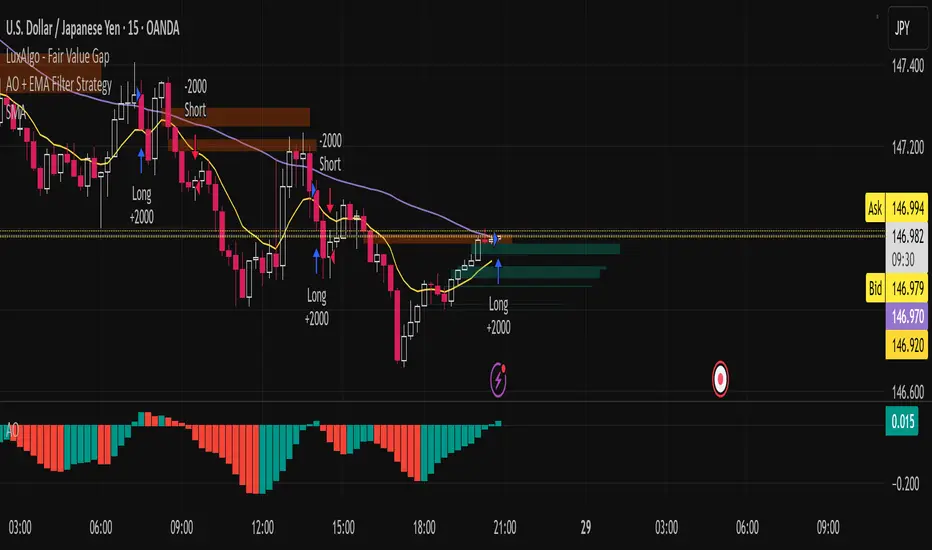
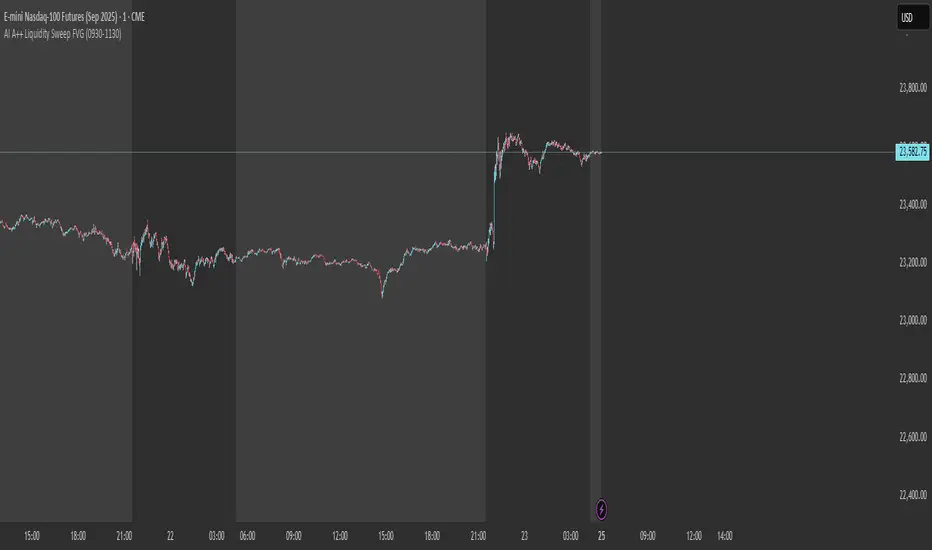
AI A++ Liquidity Sweep FVGThat is a critical question. For the "AI A++ Liqu-idity Sweep FVG" indicator to work exactly as designed, you must have your chart set to the:
1-Minute (1m) Timeframe
The Reason:
The logic of the script is built to analyze the very specific, rapid price action that occurs in the first few minutes of the New York session open.
FVG Detection: A Fair Value Gap is a three-candle pattern. On the 1-minute chart, this allows us to see the rapid imbalances created by the opening burst of volume. On a higher timeframe like the 5-minute or 15-minute, these subtle but powerful gaps would be smoothed over and might not even be visible.
Liquidity Sweep Precision: The script is looking for a quick "stop hunt" that pierces the pre-market high or low and then immediately reverses. This action is most clearly and accurately seen on the 1-minute chart.
Using any other timeframe will cause the indicator to analyze the market incorrectly and either miss valid setups or provide false signals.
So, to confirm your setup for Monday morning:
Instrument: MNQ (Micro E-mini Nasdaq-100 Futures)
Timeframe: 1-Minute
Indicator: "AI A++ Liquidity Sweep FVG" active on the chart.
Alert: Alert set up for the indicator.
You are now perfectly set up to catch the exact A++ setup we are waiting for.
Varma Fractal TEMA IndicatorThe Indicator uses Fractals and Three EMAs. A fractal is a repeating price pattern, typically consisting of five candlesticks, used to identify potential trend reversals or continuations. A bullish fractal suggests a possible upward price movement, while a bearish fractal indicates a potential downward trend. These patterns, popularized by Bill Williams, can be found across different timeframes and are considered a key part of his technical analysis system. Every Fractal line acts as an immediate support or resistance. The use of three EMAs in trading is well known. One can make own strategies with them.
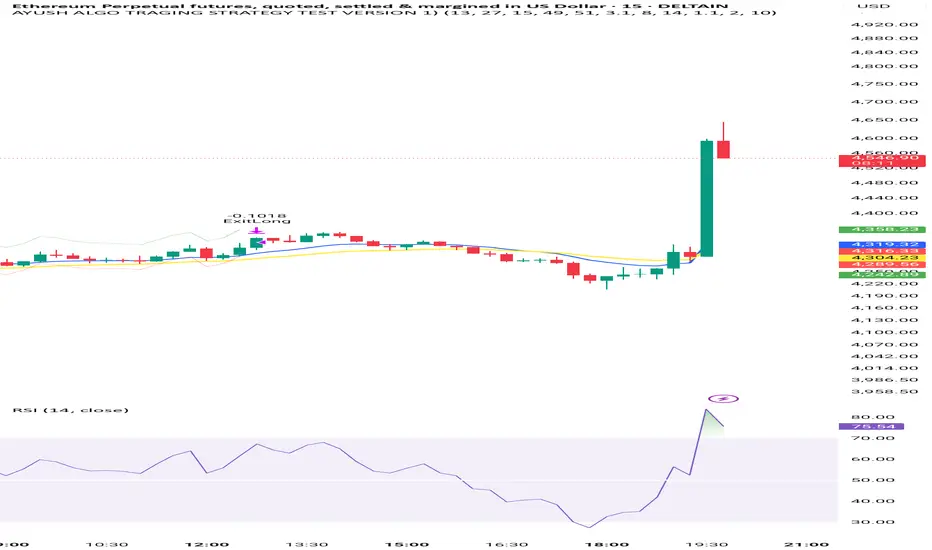
AYUSH ALGO TRAGING STRATEGY TEST VERSION 1)Very good strategy , it uses two moving avg crossovers and also rsi and atr for confirmation, this strategy is fully automated
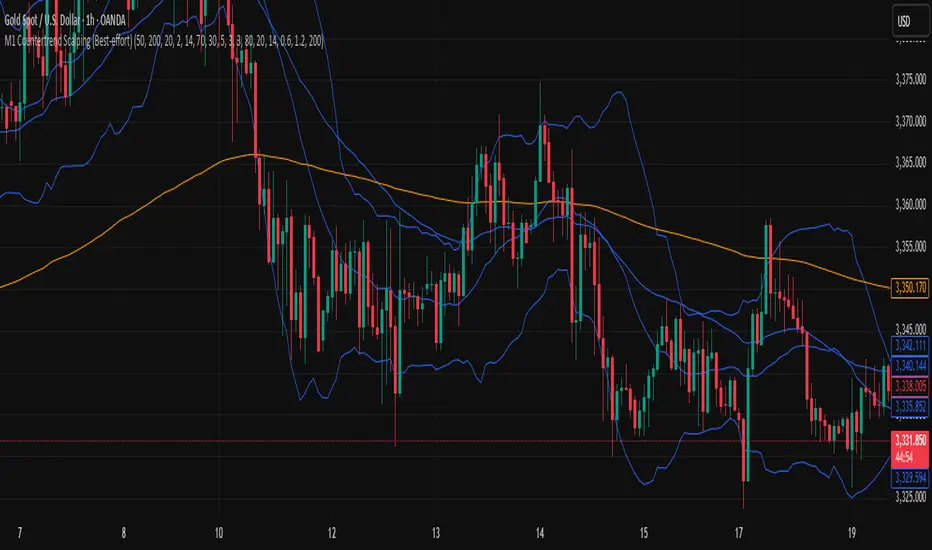
M1 Countertrend Scalping (Best-effort)M1 Countertrend Scalping (Best-effort)
M1 Countertrend Scalping (Best-effort)
Renko WPR Color ChangerChanges color when williams percent R is between 0 and -20 or when between -80 and -100. Works with renko, HA and regular candles. Can change color.
