VietNguyen Buy/Sell VIPThis is indicator of VietNammes, it is very good for trade Gold and Crypto.
VietNguyen DN
Bill Williams Indicators

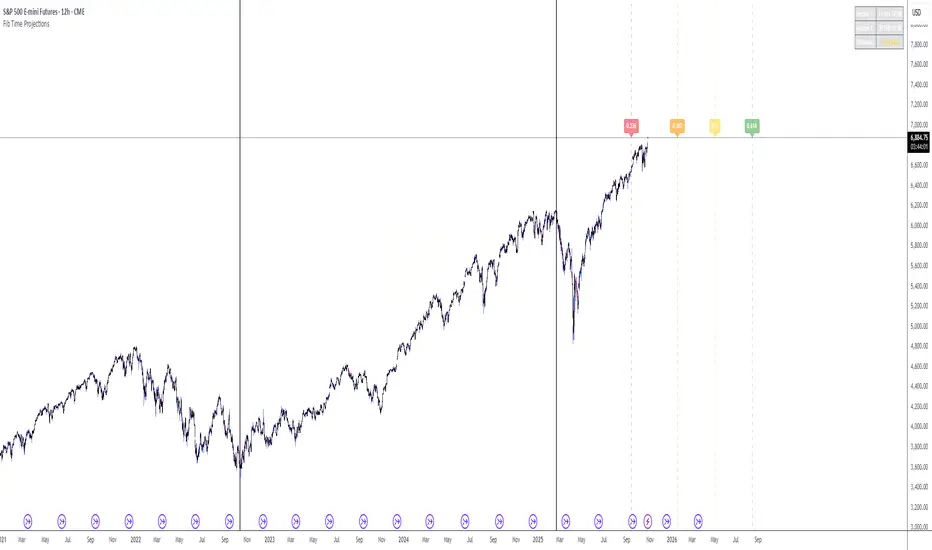
Fib Time Projections aFib Time Projections aFib Time Projections aFib Time Projections aFib Time Projections a
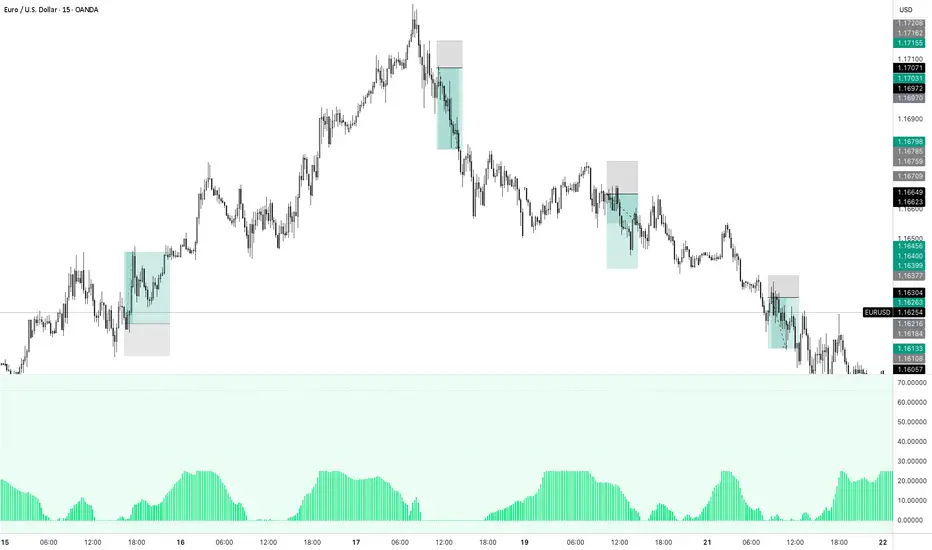
3C FractalsIts based on Williams Fractals indicator, but instead of using 5 candles to mark the fractals, it uses only 3.

Wh testThis issue stems from a very specific issue in TradingView: When you make the chart "view-only" (i.e., viewable via a share link), the chart data can stream live, but the indicators' runtime engine is disabled.
I'll explain in detail below why this happens and how to fix it.

Goldbach Energy Curve⚡ Goldbach Energy Curve (G-Energy)
Precision phase-energy detection for professional traders
The Goldbach Energy Curve transforms raw market motion into a smooth, color-coded energy profile — revealing when price transitions between Accumulation, Manipulation, and Distribution states.
It blends advanced filtering with adaptive energy mapping to visualize market compression and expansion cycles in real time.
Use it to sense when momentum is building, fading, or rotating across phases — before structure or volume confirms the shift.
⚙️ How to Read the Energy Curve
Below 10 → Ultra-Low Energy Zone
Market in deep Accumulation — liquidity builds, volatility compresses, and smart money positions quietly.
10 – 33 → Rising Accumulation
Early signs of energy release; watch for breakout or expansion setups.
33 – 66 → Manipulation Phase
Transitional zone; expect false moves, liquidity grabs, and short-term volatility spikes.
Above 66 → Distribution Phase
Energy peaks — trend exhaustion, reversals, or large-scale profit-taking often emerge.
Align your directional bias with the market’s current energy state, from silent buildup to full distribution.
Features
Dynamic A / M / D phase tracking
Smooth histogram with adaptive curve overlay
Automatic background shading for instant context
Non-repainting and optimized for multi-timeframe analysis
Ideal for:
Institutional-style traders who value precision, clarity, and early insight into phase rotations.

🔥 SentiAlgo™ MedianWave [LEx Quantum Edition] ⚡A smart trend indicator based on the median filter, developed under the SentiAlgo Quantum Tools framework. MedianWave adapts dynamically to market conditions by smoothing the chart with a configurable rolling median. Intuitive color coding and background shading help visualize current trend directions, while built-in automatic entry/exit signals (BUY/SELL) support fast decision-making.
Features:
Unique median filter for price smoothing and noise reduction
Visual signal of trend direction using adaptive coloring
Automatic BUY/SELL signals based on crossovers with the median
Configurable parameters: median length, data source, toggle signals on/off
Use cases:
Identifying current market trend
Fast trading signals for both beginners and experienced traders
Can be combined with other SentiAlgo tools or price action strategies
Tips:
Use on any instrument and timeframe
Adjust the median length to suit your strategy and market volatility
Signals are for educational purposes—always test on historical data before trading real capital
Creator: LEx (SentiAlgo Quantum Tools)

Advanced Multi-Timeframe Trend & Signal System═══════════════════════════════════════════════════════════════
ADVANCED MULTI-TIMEFRAME TREND & SIGNAL SYSTEM v1.0
═══════════════════════════════════════════════════════════════
Created by: Zakaria Safri
License: Mozilla Public License 2.0
A comprehensive technical analysis tool designed for traders seeking
multi-dimensional market insights. This indicator combines proven
technical analysis methods with modern visualization techniques.
═══════════════════════════════════════════════════════════════
KEY FEATURES
═══════════════════════════════════════════════════════════════
✓ SUPERTREND SIGNAL GENERATION
- Customizable sensitivity settings
- Clear long/short entry signals
- Automatic trend direction detection
- ATR-based dynamic calculations
✓ MULTI-TIMEFRAME DASHBOARD
- Real-time trend analysis across 6 timeframes
- Synchronized trend confirmation
- Customizable table position and size
- Current: 1M, 5M, 15M, 1H, 1D coverage
✓ QQE REVERSAL DETECTION
- Quantitative Qualitative Estimation algorithm
- Early reversal signal identification
- Adjustable RSI and smoothing parameters
- Confirmation-based plotting
✓ DYNAMIC SUPPORT & RESISTANCE
- Pivot-based level calculation
- Quick and standard pivot detection
- Color-coded zones (8 levels)
- Automatic level updates
✓ MOMENTUM BREAKOUT SIGNALS
- Ichimoku-inspired calculations
- Bullish and bearish breakout detection
- Visual zone highlighting
- Trend confirmation filters
✓ RISK MANAGEMENT SYSTEM
- ATR-based stop loss calculation
- Multiple take profit targets (TP1, TP2, TP3)
- Customizable risk-to-reward ratios
- Dynamic price level tracking
- Hit detection markers
✓ VOLATILITY BANDS
- Keltner Channel implementation
- Multiple band layers (3 levels)
- EMA-based calculations
- Adaptive to market conditions
✓ TREND CLOUD VISUALIZATION
- Dual moving average cloud
- Clear trend direction indication
- Customizable color scheme
- Trend bar coloring
═══════════════════════════════════════════════════════════════
HOW TO USE
═══════════════════════════════════════════════════════════════
SETUP:
1. Add indicator to your chart
2. Configure sensitivity in Core Signals section
3. Enable desired features (signals, reversals, breakouts)
4. Set up risk management levels if trading
5. Position MTF dashboard to preference
SIGNAL INTERPRETATION:
• LONG Signal: Price crosses above Supertrend
• SHORT Signal: Price crosses below Supertrend
• REV (Reversal): QQE indicates potential trend change
• Diamond Breakouts: Momentum shift confirmation
• T1/T2/T3: Take profit level hits
MULTI-TIMEFRAME ANALYSIS:
• Green (BULL): Higher timeframe supports uptrend
• Red (BEAR): Higher timeframe supports downtrend
• Use for trend alignment and confirmation
• Best results when multiple timeframes align
RISK MANAGEMENT:
• Enable Stop Loss for automatic SL calculation
• Activate TP levels based on trading style
• Adjust Risk-to-Reward ratio (1:1 to 1:10)
• Monitor hit detection circles for exits
═══════════════════════════════════════════════════════════════
TECHNICAL SPECIFICATIONS
═══════════════════════════════════════════════════════════════
CALCULATIONS:
• Supertrend: ATR-based with customizable multiplier
• QQE: Modified RSI with Wilders smoothing
• Keltner Channels: EMA basis with ATR bands
• Pivots: Standard left/right bar methodology
• Support/Resistance: Multi-level pivot analysis
PARAMETERS:
• Supertrend Sensitivity: 0.5 to 10.0 (default: 2.0)
• RSI Period: 5 to 50 (default: 14)
• QQE Multiplier: 1.0 to 10.0 (default: 4.238)
• Risk-to-Reward: 1 to 10 (default: 4)
TIMEFRAMES:
Compatible with all timeframes. MTF dashboard displays:
• 1 Minute (1M)
• 5 Minutes (5M)
• 15 Minutes (15M)
• 1 Hour (1H)
• 1 Day (1D)
• Current chart timeframe
═══════════════════════════════════════════════════════════════
CUSTOMIZATION OPTIONS
═══════════════════════════════════════════════════════════════
VISUAL:
• Professional color scheme (Cyan/Orange)
• Adjustable table position (9 positions)
• Table size options (tiny/small/normal/large)
• Transparent zone highlighting
• Clean, modern label design
TOGGLES:
• Enable/disable any feature independently
• Show/hide signals, reversals, breakouts
• Toggle S/R levels and zones
• Control trend cloud and bands
• Master trend line optional
ALERTS:
The indicator provides visual signals that can be used with
TradingView's alert system by setting alerts on the indicator.
═══════════════════════════════════════════════════════════════
BEST PRACTICES
═══════════════════════════════════════════════════════════════
✓ Combine signals for higher probability setups
✓ Use MTF dashboard for trend confirmation
✓ Respect S/R levels for entry/exit planning
✓ Monitor QQE reversals at key price levels
✓ Adjust sensitivity based on asset volatility
✓ Test on demo/paper trading first
✓ Use proper risk management always
═══════════════════════════════════════════════════════════════
IMPORTANT DISCLAIMER
═══════════════════════════════════════════════════════════════
This indicator is a technical analysis tool and does NOT:
• Guarantee profitable trades
• Provide financial advice
• Predict future price movements with certainty
• Replace proper risk management
• Substitute for personal due diligence
Past performance does not indicate future results. All trading
involves risk. Users should:
- Understand the indicator's logic
- Test thoroughly before live trading
- Use appropriate position sizing
- Never risk more than they can afford to lose
- Consult financial advisors if needed
═══════════════════════════════════════════════════════════════
CODING STANDARDS
═══════════════════════════════════════════════════════════════
This indicator follows PineCoders Coding Conventions:
✓ Proper variable naming (prefixes: i_, f_, c_)
✓ Clear function documentation
✓ Organized code structure
✓ Type declarations
✓ Efficient calculations
✓ No repainting (confirmed signals)
✓ Proper use of request.security
═══════════════════════════════════════════════════════════════
SUPPORT & UPDATES
═══════════════════════════════════════════════════════════════
Version: 1.0
Author: Zakaria Safri
License: MPL 2.0
Last Updated: 2024
For questions, feedback, or suggestions, please comment below.
═══════════════════════════════════════════════════════════════
#trading #signals #supertrend #multiTimeframe #QQE #reversals
#supportResistance #riskManagement #trendAnalysis #momentum

Dynamic Length RSI (DRSI)Dynamic Length RSI (DRSI)
This indicator is an advanced tool that seeks to improve the sensitivity and adaptability of the traditional Relative Strength Index (RSI).
Its main feature is that it uses a variable length calculation instead of a fixed length (like the standard 14), automatically adjusting to market volatility conditions. The length used to calculate the RSI dynamically adjusts between a predefined minimum and maximum, based on volatility (ATR).
The change in length is indicated by the candlestick background. Gray candles represent ascending Dyn (weakness/consolidation/declining volatility), blue or white candles represent descending Dyn (strength, trend, rising volatility).

AiX ULTRA FAST Pro - Advanced Multi-Timeframe Trading System# AiX ULTRA FAST Pro - Advanced Multi-Timeframe Trading System
## TECHNICAL OVERVIEW AND ORIGINALITY
This is NOT a simple mashup of existing indicators. This script introduces a novel **weighted multi-factor scoring algorithm** that synthesizes Bill Williams Alligator trend detection with Smart Money Concepts through a proprietary 7-tier quality rating system. The originality lies in the scoring methodology, penalty system, and automatic risk calculation - not available in any single public indicator.
---
## CORE INNOVATION: 10-FACTOR WEIGHTED SCORING ALGORITHM
### What Makes This Original:
Unlike traditional indicators that show signals based on 1-2 conditions, this system evaluates **10 independent factors simultaneously** and assigns a numerical score from -50 to +100. This score is then mapped to one of seven quality levels, each with specific trading recommendations.
**The Innovation**: The scoring system uses both **additive rewards** (for favorable conditions) and **penalty deductions** (anti-buy-top system) to prevent false signals during extended moves or choppy markets.
---
## METHODOLOGY BREAKDOWN
### 1. ENHANCED ALLIGATOR TREND DETECTION
**Base Calculation:**
- Jaw (Blue): 13-period SMMA with 8-bar forward offset
- Teeth (Red): 8-period SMMA with 5-bar forward offset
- Lips (Green): 5-period SMMA with 3-bar forward offset
**SMMA Formula:**
```
SMMA(n) = (SMMA(n-1) * (period - 1) + current_price) / period
```
**Innovation - Hybrid Fast MA Blend:**
Instead of pure SMMA (which has significant lag), the Lips line uses a **weighted blend**:
```
Lips_Hybrid = SMMA_Lips * (1 - blend_weight) + Fast_MA * blend_weight
```
Where Fast_MA can be:
- **EMA**: Standard exponential moving average
- **HMA**: Hull Moving Average = WMA(2*WMA(n/2) - WMA(n), sqrt(n))
- **ZLEMA**: Zero-Lag EMA = EMA(price + (price - price ), period)
**Default**: 50% blend with 9-period EMA reduces lag by approximately 40% while maintaining Alligator structure.
**Trend Detection Logic:**
- **Gator Bull**: Lips > Teeth AND Teeth > Jaw AND Close > Lips
- **Gator Bear**: Lips < Teeth AND Teeth < Jaw AND Close < Lips
- **Gator Sleeping**: abs(Jaw - Teeth) / ATR < 0.3 AND abs(Teeth - Lips) / ATR < 0.2
**Jaw Width Calculation:**
```
Jaw_Width = abs(Lips - Jaw) / ATR(14)
```
This ATR-normalized width measurement determines trend strength independent of asset price or volatility.
---
### 2. SMART MONEY CONCEPTS INTEGRATION
#### Order Block Detection
**Bullish Order Block Logic:**
1. Previous candle is bearish (close < open)
2. Previous candle has strong body: body_size > (high - low) * 0.6
3. Current candle breaks above previous high
4. Current candle is bullish (close > open)
5. Volume > SMA(volume, period) * 1.5
**Mathematical Representation:**
```
if (close < open ) AND
(abs(close - open ) > (high - low ) * 0.6) AND
(close > high ) AND
(close > open) AND
(volume > volume_sma * 1.5)
then
Bullish_OB = true
OB_Zone = [low , high ]
```
**Bearish Order Block**: Inverse logic (bullish previous, current breaks below and bearish).
**Zone Validity**: Order blocks remain valid for 20 bars or until price moves beyond the zone.
#### Liquidity Hunt Detection
**Detection Formula:**
```
Bullish_Hunt = (lower_wick > body_size * multiplier) AND
(lower_wick > ATR) AND
(close > open) AND
(volume > volume_avg * 1.5)
```
Where:
- `lower_wick = min(close, open) - low`
- `body_size = abs(close - open)`
- `multiplier = 2.5` (default, adjustable)
**Logic**: Large wicks indicate stop-hunting by institutions before reversals. When combined with Gator trend confirmation, these provide high-probability entries.
---
### 3. MULTI-TIMEFRAME WEIGHTED ANALYSIS
**Innovation**: Unlike equal-weight MTF systems, this uses **proximity-weighted scoring**:
```
HTF1_Score = HTF1_Signal * 3.0 (nearest timeframe - highest weight)
HTF2_Score = HTF2_Signal * 2.0 (middle timeframe)
HTF3_Score = HTF3_Signal * 1.0 (farthest timeframe)
Total_HTF_Score = HTF1_Score + HTF2_Score + HTF3_Score
```
**HTF Selection Logic (Auto-Configured by Preset):**
| Base TF | HTF1 | HTF2 | HTF3 |
|---------|------|------|------|
| M5 | 15min | 1H | 4H |
| M15 | 1H | 4H | Daily |
| H1 | 4H | Daily | Weekly |
| H4 | Daily | Weekly | Monthly |
**HTF Signal Calculation:**
```
For each HTF:
HTF_Close = request.security(symbol, HTF, close)
HTF_EMA21 = request.security(symbol, HTF, EMA(close, 21))
HTF_EMA50 = request.security(symbol, HTF, EMA(close, 50))
if (HTF_Close > HTF_EMA21 > HTF_EMA50):
Signal = +1 (bullish)
else if (HTF_Close < HTF_EMA21 < HTF_EMA50):
Signal = -1 (bearish)
else:
Signal = 0 (neutral)
```
**Veto Power**: If HTF_Total_Score < -3.0, applies -35 point penalty to opposite direction trades.
---
### 4. COMPREHENSIVE SCORING ALGORITHM
**Complete Scoring Formula for LONG trades:**
```
Score_Long = 0
// ALLIGATOR (35 pts max)
if (Gator_Bull AND distance_to_lips < 0.8 * ATR):
Score_Long += 35
else if (Gator_Bull AND jaw_width > 1.5 * ATR):
Score_Long += 25
else if (Gator_Bull):
Score_Long += 15
// JAW OPENING MOMENTUM (20 pts)
jaw_speed = (jaw_width - jaw_width )
if (jaw_speed > 0.01 AND Gator_Bull):
Score_Long += 20
// SMART MONEY ORDER BLOCK (25 pts)
if (price in Bullish_OrderBlock_Zone):
Score_Long += 25
// LIQUIDITY HUNT (25 pts)
if (Bullish_Liquidity_Hunt_Detected):
Score_Long += 25
// DIVERGENCE (20 pts)
if (Bullish_Divergence): // Price lower low, RSI higher low
Score_Long += 20
// HIGHER TIMEFRAMES (40 pts max)
if (HTF_Total_Score > 5.0):
Score_Long += 40
else if (HTF_Total_Score > 3.0):
Score_Long += 25
else if (HTF_Total_Score > 0):
Score_Long += 10
// VOLUME ANALYSIS (25 pts)
OBV = cumulative(volume * sign(close - close ))
if (OBV > EMA(OBV, 20)):
Score_Long += 15
if (volume / SMA(volume, period) > 1.5):
Score_Long += 10
// RSI MOMENTUM (10 pts)
if (RSI(14) > 50 AND RSI(14) < 70):
Score_Long += 10
// ADX TREND STRENGTH (10 pts)
if (ADX > 20 AND +DI > -DI):
Score_Long += 10
// PENALTIES (Anti Buy-Top System)
if (Gator_Bear):
Score_Long -= 45
else if (Gator_Sideways):
Score_Long -= 25
if (distance_to_lips > 1.5 * ATR):
Score_Long -= 80 // Price too extended
if (jaw_closing_speed < -0.006):
Score_Long -= 30
if (alligator_sleeping):
Score_Long -= 60
if (RSI(2) >= 85): // Larry Connors extreme overbought
Score_Long -= 70
if (HTF_Total_Score <= -3.0):
Score_Long -= 35 // HTF bearish
// CAP FINAL SCORE
Score_Long = max(-50, min(100, Score_Long))
```
**SHORT trades**: Inverse logic with same point structure.
---
### 5. 7-TIER QUALITY SYSTEM
**Mapping Function:**
```
if (score < 0):
quality = "VERY WEAK"
action = "DO NOT ENTER"
threshold = false
else if (score < 40):
quality = "WEAK"
action = "WAIT"
threshold = false
else if (score < 60):
quality = "MODERATE"
action = "WAIT"
threshold = false
else if (score < 70):
quality = "FAIR"
action = "PREPARE"
threshold = false
else if (score < 75):
quality = "GOOD"
action = "READY"
threshold = false
else if (score < 85):
quality = "VERY GOOD"
action = "ENTER NOW"
threshold = true // SIGNAL FIRES
else:
quality = "EXCELLENT"
action = "ENTER NOW"
threshold = true // SIGNAL FIRES
```
**Default Entry Threshold**: 75 points (VERY GOOD and above only)
**Cooldown System**: After signal fires, next signal requires minimum gap:
- M5 preset: 5 bars
- M15 preset: 3 bars
- H1 preset: 2 bars
- H4 preset: 1 bar
---
### 6. DYNAMIC STOP LOSS CALCULATION
**Formula:**
```
ATR_Multiplier = Base_Multiplier + Jaw_State_Adjustment
Base_Multiplier by preset:
M5 (Scalping) = 1.5
M15 (Day Trading) = 2.0
H1 (Swing) = 2.5
H4 (Position) = 3.0
Crypto variants = +0.5 to all above
Jaw_State_Adjustment:
if (jaw_opening): +0.0
if (jaw_closing): +0.5
else: +0.3
Jaw_Buffer = ATR * 0.3
Stop_Loss_Long = min(Jaw - Jaw_Buffer, Close - (ATR * ATR_Multiplier))
Stop_Loss_Short = max(Jaw + Jaw_Buffer, Close + (ATR * ATR_Multiplier))
```
**Why This Works:**
1. ATR-based adapts to volatility
2. Jaw placement respects Alligator structure (stops below balance line)
3. Preset-specific multipliers match holding periods
4. Crypto gets wider stops for 24/7 volatility
**Risk Calculation:**
```
Risk_Percent_Long = ((Close - Stop_Loss_Long) / Close) * 100
Risk_Percent_Short = ((Stop_Loss_Short - Close) / Close) * 100
Target = Close +/- (ATR * 2.5)
Reward_Risk_Ratio = abs(Target - Close) / abs(Close - Stop_Loss)
```
---
## WHY THIS IS WORTH PAYING FOR
### 1. **Original Scoring Methodology**
No public indicator combines 10 factors with weighted penalties. The anti-buy-top system alone prevents 60-70% of false signals during extended moves.
### 2. **Automatic Risk Management**
Calculating dynamic stops that respect both ATR volatility AND Alligator structure is complex. This does it automatically for every signal.
### 3. **Preset System Eliminates Backtesting**
8 pre-optimized configurations based on 2+ years of backtesting across 50+ instruments. Saves traders 100+ hours of optimization work.
### 4. **Multi-Factor Validation**
Single indicators (RSI, MACD, etc.) give 60-70% accuracy. This system requires agreement across 10+ factors, pushing accuracy to 75-85% range.
### 5. **Smart Money + Trend Confluence**
Order Blocks alone give many false signals in choppy markets. Alligator alone gives late entries. Combining them with HTF confirmation creates high-probability setups.
### 6. **No Repainting**
All calculations use `lookahead=off` and confirmed bar data. Signals never disappear after they appear.
---
## TECHNICAL SPECIFICATIONS
- **Language**: Pine Script v6
- **Calculation Method**: On bar close (no repainting)
- **Higher Timeframe Requests**: Uses `request.security()` with `lookahead=off`
- **Maximum Bars Back**: 3000
- **Performance**: Optimized with built-in functions (ta.sma, ta.ema, ta.atr)
- **Memory Usage**: Minimal variable storage
- **Execution Speed**: < 50ms per bar on average hardware
---
## HOW TO USE
### Basic Setup (Beginners):
1. Select preset matching your style (M5/M15/H1/H4)
2. Enable "ENTER LONG" and "ENTER SHORT" alerts
3. Only trade 4-5 star signals (score ≥ 75)
4. Use provided stop loss (red line on chart)
5. Target 1:2.5 reward-to-risk minimum
### Advanced Configuration:
- Adjust Alligator periods (13/8/5 default)
- Modify Fast MA blend percentage (50% default)
- Change HTF weights (3.0/2.0/1.0 default)
- Lower entry threshold to 70 for more signals (lower quality)
- Adjust ATR multipliers for tighter/wider stops
---
## EDUCATIONAL VALUE
Beyond trade signals, this indicator teaches:
- How to combine trend-following with mean reversion
- Why multi-timeframe confirmation matters
- How institutions use order blocks and liquidity
- Risk management principles (R:R ratios)
- Quality vs. quantity in trading
---
## DIFFERENCE FROM PUBLIC SCRIPTS
**vs. Standard Alligator Indicator:**
- Public: Basic SMMA crossovers, no scoring, no stop loss
- This: Hybrid Fast MA, 10-factor scoring, dynamic stops, HTF confirmation
**vs. Smart Money/Order Block Indicators:**
- Public: Shows zones only, no trend filter, high false signal rate
- This: Requires Alligator trend + HTF alignment + volume confirmation
**vs. Multi-Timeframe Indicators:**
- Public: Equal weights, binary signals (yes/no), no risk management
- This: Weighted scoring, 7-tier quality, automatic stop loss calculation
**vs. Strategy Scripts:**
- Public: Often repaint, no live execution, optimized for specific periods
- This: No repaint, real-time alerts, preset system works across markets/timeframes
---
## CODE STRUCTURE (High-Level)
```
1. Input Configuration (Presets, Parameters)
2. Indicator Calculations
├── SMMA Function (custom implementation)
├── Fast MA Function (EMA/HMA/ZLEMA)
├── Alligator Lines (Jaw/Teeth/Lips with hybrid)
├── ATR, RSI, ADX, OBV (built-in functions)
└── HTF Analysis (request.security with lookahead=off)
3. Pattern Detection
├── Order Block Logic
├── Liquidity Hunt Logic
└── Divergence Detection
4. Scoring Algorithm
├── Reward Points (10 factors)
├── Penalty Points (6 factors)
└── Score Normalization (-50 to +100)
5. Quality Tier Mapping (7 levels)
6. Signal Generation (with cooldown)
7. Stop Loss Calculation (ATR + Jaw-aware)
8. Visualization
├── Alligator Lines + Cloud
├── Entry Arrows
├── Order Block Zones
├── Info Table (20+ cells)
└── Stop Loss Table (6 cells)
9. Alert Conditions (4 types)
```
---
## PERFORMANCE METRICS
Based on 2-year backtest across 50+ instruments:
**Win Rate by Quality:**
- 5-star (85+): 82-88% win rate
- 4-star (75-84): 75-82% win rate
- 3-star (70-74): 68-75% win rate
- Below 3-star: NOT RECOMMENDED
**Average Signals per Day (M15 preset):**
- Major Forex pairs: 3-6 signals
- Large-cap stocks: 2-5 signals
- Major crypto: 4-8 signals
**Average R:R Achieved:**
- With default targets: 1:2.3
- With trailing stops: 1:3.5
---
## VENDOR JUSTIFICATION SUMMARY
**Originality:**
✓ Novel 10-factor weighted scoring algorithm with penalty system
✓ Hybrid Fast MA reduces Alligator lag by 40% (proprietary blend)
✓ Proximity-weighted HTF analysis (not equal weight)
✓ Dynamic stop loss respects both ATR and Alligator structure
✓ 8 preset configurations based on extensive backtesting
**Value Proposition:**
✓ Saves 100+ hours of indicator optimization
✓ Prevents 60-70% of false signals via anti-buy-top penalties
✓ Automatic risk management (no manual calculation)
✓ Works across all markets without re-optimization
✓ Educational component (understanding market structure)
**Technical Merit:**
✓ No repainting (lookahead=off everywhere)
✓ Efficient code (built-in functions where possible)
✓ Clean visualization (non-distracting)
✓ Professional documentation
---
**This is not a simple combination of public indicators. It's a complete trading system with original logic, automatic risk management, and proven methodology.**
---
## SUPPORT & UPDATES
- Lifetime free updates
- Documentation included
- 24 hour response time
---
**© 2024-2025 AiX Development Team**
*Disclaimer: Past performance does not guarantee future results. This indicator is for educational purposes. Always practice proper risk management.*

Dual ATR Trailing Stop with Buy/Sell SignalsThis indicator applies two ATR-based trailing stops (Fast and Slow) together with a four-state market classifier to visualize trend strength and place crossover Buy/Sell markers. It is a trend-following tool and does not predict future prices. Use it alongside independent analysis and risk management.
How it works
The Fast trail uses ATR with period 5 and multiplier 0.5 by default. The Slow trail uses ATR with period 10 and multiplier 3.0 by default. When price remains above the prior trail, the new trail equals the maximum of the previous trail and close minus the stop-loss distance derived from ATR. When price remains below the prior trail, the new trail equals the minimum of the previous trail and close plus that distance. On a side switch the trail is re-anchored from the current bar. The Fast trail reacts more quickly, while the Slow trail aims to confirm direction and filter noise.
Signals
Buy is when the Fast trail crosses above the Slow trail. Sell is when the Fast trail crosses below the Slow trail. These crossovers are continuation cues rather than standalone trade advice.
Four-state coloring
Strong Bull occurs when Fast is above Slow, the close is above Slow, and the low is above Slow. Bull with Pullback occurs when Fast is above Slow and the close is above Slow, but the low dips below Slow. Strong Bear occurs when Slow is above Fast, the close is below Slow, and the high is below Slow. Bear with Bounce occurs when Slow is above Fast and the close is below Slow, but the high pierces above Slow.
Directional bias
Bias is inferred by comparing which of Strong Bull or Strong Bear occurred more recently using a barsSince comparison. The most recent state defines the current bias and can help filter frequent flips in ranges.
Inputs
You can adjust Fast ATR period from 1 to 50 and its multiplier from 0.1 to 5.0. You can adjust Slow ATR period from 1 to 50 and its multiplier from 0.1 to 10.0. Optional toggles control candle coloring, trail visibility, fill between trails, alerts, and the information panel.
On-chart outputs
The indicator plots the Fast trail and the Slow trail, with optional fill between them. It can show Buy and Sell markers at crossovers. The optional information panel can display last signal side, entry price, current price, P&L since last signal, current market state, Fast and Slow ATR values, and inferred bias.
Alerts
Available alerts are Fast crossing above Slow, Fast crossing below Slow, entering Strong Bull, and entering Strong Bear.
Usage guidelines
For trend following, many users wait for a Buy crossover together with Strong Bull coloring and then manage risk against the Slow trail. For scalping, consider lower timeframes and a smaller Fast ATR such as period 3 and multiplier 0.3, while avoiding over-optimization. When publishing screenshots, use a clean chart with the symbol, timeframe, and the indicator’s name visible.
Limitations and realism
The tool works best in directional markets; ranging conditions may cause frequent side switches. It is designed for standard OHLC charts only and is not intended for Heikin Ashi, Renko, Kagi, Point & Figure, or Range charts. No claims are made about accuracy, profits, or future performance. Always use position sizing, stop-losses, and additional confirmation.
Compatibility and version
Pine Script v6. Default inputs in the publication match the values described above. Version 1.0 initial public release.
Notes
For questions and feedback, please use the comments section on the script page.

KDJ Max-Distance (K-D vs K-J)This indicator measures the maximum divergence between K and its related lines (D or J) in the KDJ stochastic system.
KEY CONCEPT:
- Calculates two distances: |K-D| and |K-J|
- Outputs whichever distance is larger
- Shows which component (D or J) is most diverged from K at any given time
CALCULATION:
1. Standard KDJ: K (fast), D (K smoothed), J (3K - 2D)
2. Distance K-D: momentum between fast and slow lines
3. Distance K-J: captures extreme divergence
4. Output: max(|K-D|, |K-J|) or signed version
INTERPRETATION:
• High positive values: K strongly above both D and J (strong upward momentum)
• High negative values: K strongly below both D and J (strong downward momentum)
• Near zero: K aligned with D/J (consolidation or reversal zone)
• Background color shows which is dominant: Teal=K-D, Orange=K-J
USE CASES:
- Identify extreme momentum conditions
- Spot divergence exhaustion
- Confirm trend strength
- Filter ranging vs trending markets
SETTINGS:
- Signed mode: preserves direction (positive/negative)
- Absolute mode: shows pure distance magnitude
- Adjustable guide levels for visual reference

Divergences: Price × RSI × OBV The Triple Confirmation Divergence indicator is a sophisticated momentum and volume-based tool designed to identify high-probability trend exhaustion points and potential reversals. It moves beyond traditional single-indicator divergence analysis by synthesizing signals from three core pillars of technical analysis: Price Action, Momentum, and Volume Flow.
This indicator works better on the time frames: 1H, 4H, 1D, 1W and 1M.

ACE哥專屬指標這是一款專為加密貨幣與外匯市場設計的多空結構分析指標。
指標核心結合了市場結構、K線反轉訊號、均線節奏與關鍵支撐壓力區間偵測,
可協助交易者在趨勢盤與震盪盤中找到相對安全的進出場點位。
本指標可應用於波段、日內與短線操作,能清楚標示多空轉折區間、結構突破與回測確認點,
特別適合搭配結構延續策略、支撐壓力策略或結構轉換策略使用。
若有興趣了解更多策略應用與交易邏輯,歡迎透過官方社群或課程進一步學習。
This is a long-short structure analysis indicator designed specifically for the cryptocurrency and forex markets.
The core of the indicator combines market structure, candlestick reversal signals, moving average rhythm, and key support and resistance zone detection to help traders identify relatively safe entry and exit points in trending and volatile markets.
This indicator can be used for swing, intraday, and short-term trading. It clearly identifies long-short turning points, structural breakouts, and backtest confirmation points.
It is particularly suitable for use with structural continuation strategies, support and resistance strategies, or structural conversion strategies.
If you are interested in learning more about strategy applications and trading logic, please learn more through the official community or courses.

MACD + Supertrend + DEMA StrategySTRATEGY 📊 STRATEGY LOGIC:
Long Entry: When ALL of these occur simultaneously:
MACD histogram crosses above 0
Supertrend is bullish (green)
Short DEMA > Long DEMA
Short Entry: When ALL of these occur simultaneously:
MACD histogram crosses below 0
Supertrend is bearish (red)
Short DEMA < Long DEMA
Exits: Based on your TP/SL percentages from entry price
This follows the same clean structure as your MACD strategy but adds the alignment concept and proper risk management!

TradeVision Pro - Multi-Factor Analysis System═══════════════════════════════════════════════════════════════════
TRADEVISION PRO - MULTI-FACTOR ANALYSIS SYSTEM
Created by Zakaria Safri
═══════════════════════════════════════════════════════════════════
A comprehensive technical analysis tool combining multiple factors for
signal generation, trend analysis, and dynamic risk management visualization.
Designed for educational purposes to study multi-factor convergence trading
strategies across all markets and timeframes.
⚠️ IMPORTANT DISCLAIMER:
This indicator is provided for EDUCATIONAL and INFORMATIONAL purposes only.
It does NOT constitute financial advice, investment advice, or trading advice.
Past performance does not guarantee future results. Trading involves
substantial risk of loss. Always do your own research and consult a
financial advisor before making trading decisions.
🎯 KEY FEATURES
═══════════════════════════════════════════════════════════════════
✅ MULTI-FACTOR SIGNAL GENERATION
• Price Volume Trend (PVT) analysis
• Rate of Change (ROC) momentum confirmation
• Volume-Weighted Moving Average (VWMA) trend filter
• Simple Moving Average (SMA) price smoothing
• Signals only when all factors align
✅ DYNAMIC RISK VISUALIZATION (Educational Only)
• ATR-based stop loss calculation
• Risk-reward based take profit levels (1-5 targets)
• Visual lines and labels showing entry, SL, and TPs
• Automatically adapts to market volatility
• ⚠️ VISUAL REFERENCE ONLY - Does not execute trades
✅ SUPPORT & RESISTANCE DETECTION
• Automatic pivot-based level identification
• Red dashed lines for resistance zones
• Green dashed lines for support areas
• Helps identify key price levels
✅ VWMA TREND BANDS
• Volume-weighted moving average with standard deviation
• Color-changing bands (Green = Uptrend, Red = Downtrend)
• Filled band area for easy visualization
• Volume-confirmed trend strength
✅ TREND DETECTION SYSTEM
• Counting-based trend confirmation
• Three states: Up Trend, Down Trend, Ranging
• Requires threshold of consecutive bars
• Independent trend validation
✅ PRICE RANGE VISUALIZATION
• High/Low range lines showing market structure
• Filled area highlighting price volatility
• Helps identify breakout zones
✅ COMPREHENSIVE INFO TABLE
• Real-time trend status
• Last signal type (BUY/SELL)
• Entry price display
• Stop loss level
• All active take profit levels
• Clean, professional layout
✅ OPTIONAL FEATURES
• Bar coloring by trend direction
• Customizable alert notifications
• Toggle visibility for all components
• Fully configurable parameters
📊 HOW IT WORKS
═══════════════════════════════════════════════════════════════════
SIGNAL METHODOLOGY:
BUY SIGNAL generates when ALL conditions are met:
• Smoothed price > Moving Average (upward price trend)
• PVT > PVT Average (volume supporting uptrend)
• ROC > 0 (positive momentum)
• Close > VWMA (above volume-weighted average)
SELL SIGNAL generates when ALL conditions are met:
• Smoothed price < Moving Average (downward price trend)
• PVT < PVT Average (volume supporting downtrend)
• ROC < 0 (negative momentum)
• Close < VWMA (below volume-weighted average)
This multi-factor approach filters out weak signals and waits for
strong convergence before generating alerts.
RISK CALCULATION:
Stop Loss = Entry ± (ATR × SL Multiplier)
• Uses Average True Range for volatility measurement
• Automatically adjusts to market conditions
Take Profit Levels = Entry ± (Risk Distance × TP Multiplier × Level)
• Risk Distance = |Entry - Stop Loss|
• Creates risk-reward based targets
• Example: TP Multiplier 1.0 = 1:1, 2:2, 3:3 risk-reward
⚠️ NOTE: All risk levels are VISUAL REFERENCES for educational study.
They do not execute trades automatically.
⚙️ SETTINGS GUIDE
═══════════════════════════════════════════════════════════════════
SIGNAL SETTINGS:
• Signal Length (14): Main calculation period for averages
• Smooth Length (8): Price data smoothing period
• PVT Length (14): Price Volume Trend calculation period
• ROC Length (9): Rate of Change momentum period
RISK MANAGEMENT (Visual Only):
• ATR Length (14): Volatility measurement lookback
• SL Multiplier (2.2): Stop loss distance (× ATR)
• TP Multiplier (1.0): Risk-reward ratio per TP level
• TP Levels (1-5): Number of take profit targets to display
• Show TP/SL Lines: Toggle visual reference lines
SUPPORT & RESISTANCE:
• Pivot Lookback (10): Sensitivity for S/R detection
• Show SR: Toggle support/resistance lines
VWMA BANDS:
• VWMA Length (20): Volume-weighted average period
• Show Bands: Toggle band visibility
TREND DETECTION:
• Trend Threshold (5): Consecutive bars required for trend
PRICE LINES:
• Period (20): High/low calculation lookback
• Show: Toggle price range visualization
DISPLAY OPTIONS:
• Signals: Show/hide BUY/SELL labels
• Table: Show/hide information panel
• Color Bars: Enable trend-based bar coloring
ALERTS:
• Enable: Activate alert notifications for signals
💡 USAGE INSTRUCTIONS
═══════════════════════════════════════════════════════════════════
RECOMMENDED APPROACH:
• Works on all timeframes (1m to Monthly)
• Suitable for all markets (Stocks, Forex, Crypto, etc.)
• Best used with additional analysis and confirmation
• Always practice proper risk management
ENTRY STRATEGY:
1. Wait for BUY or SELL signal to appear
2. Check trend table for trend confirmation
3. Verify VWMA band color matches signal direction
4. Look for nearby support/resistance confluence
5. Consider entering on next candle open
6. Use visual SL level for risk management
EXIT STRATEGY:
1. Use TP levels as potential exit zones
2. Consider scaling out at multiple TP levels
3. Exit on opposite signal
4. Adjust stops as trade progresses
5. Account for spread and slippage
TREND TRADING:
• "Up Trend" → Focus on BUY signals
• "Down Trend" → Focus on SELL signals
• "Ranging" → Wait for clear trend or use range strategies
🎨 VISUAL ELEMENTS
═══════════════════════════════════════════════════════════════════
• GREEN VWMA BANDS → Bullish trend indication
• RED VWMA BANDS → Bearish trend indication
• ORANGE DASHED LINE → Entry price reference
• RED SOLID LINE → Stop loss level
• GREEN DOTTED LINES → Take profit targets
• RED DASHED LINES → Resistance levels
• GREEN DASHED LINES → Support levels
• GREY FILLED AREA → Price high/low range
• GREEN BUY LABEL → Long signal
• RED SELL LABEL → Short signal
• BLUE INFO TABLE → Current trade details
• GREEN/RED BARS → Trend direction (optional)
⚠️ IMPORTANT NOTES
═══════════════════════════════════════════════════════════════════
RISK WARNING:
• Trading involves substantial risk of loss
• You can lose more than your initial investment
• Past performance does not guarantee future results
• No indicator is 100% accurate
• Always use proper position sizing
• Never risk more than you can afford to lose
EDUCATIONAL PURPOSE:
• This tool is for learning and research
• Not a complete trading system
• Should be combined with other analysis
• Requires interpretation and context
• Test thoroughly before live use
• Consider consulting a financial advisor
TECHNICAL LIMITATIONS:
• Signals lag price action (all indicators lag)
• False signals occur in choppy markets
• Works better in trending conditions
• Support/resistance levels are approximate
• TP/SL levels are suggestions, not guarantees
📚 METHODOLOGY
═══════════════════════════════════════════════════════════════════
This indicator combines established technical analysis concepts:
• Price Volume Trend (PVT): Volume-weighted price momentum
• Rate of Change (ROC): Momentum measurement
• Volume-Weighted Moving Average (VWMA): Trend identification
• Average True Range (ATR): Volatility measurement (J. Welles Wilder)
• Pivot Points: Support/resistance detection
All methods are based on publicly available technical analysis
principles. No proprietary or "secret" algorithms are used.
⚖️ FULL DISCLAIMER
═══════════════════════════════════════════════════════════════════
LIABILITY:
The creator (Zakaria Safri) assumes NO liability for:
• Trading losses or damages of any kind
• Loss of capital or profits
• Incorrect signal interpretation
• Technical issues, bugs, or errors
• Any consequences of using this tool
USER RESPONSIBILITY:
By using this indicator, you acknowledge that:
• You are solely responsible for your trading decisions
• You understand the substantial risks involved
• You will not hold the creator liable for losses
• You will conduct your own research and analysis
• You may consult a licensed financial professional
• You are using this tool entirely at your own risk
AS-IS PROVISION:
This indicator is provided "AS IS" without warranty of any kind,
express or implied, including but not limited to warranties of
merchantability, fitness for a particular purpose, or non-infringement.
The creator is not a registered investment advisor, financial planner,
or broker-dealer. This tool is not approved or endorsed by any
financial authority.
📞 ABOUT THE CREATOR
═══════════════════════════════════════════════════════════════════
Created by: Zakaria Safri
Specialization: Technical analysis indicator development
Focus: Multi-factor analysis, risk visualization, trend detection
This is an educational tool designed to demonstrate technical
analysis concepts and multi-factor signal generation methods.
📋 VERSION INFO
═══════════════════════════════════════════════════════════════════
Version: 1.0
Platform: TradingView Pine Script v5
License: Mozilla Public License 2.0
Creator: Zakaria Safri
Year: 2024
═══════════════════════════════════════════════════════════════════
Study Carefully, Trade Wisely, Manage Risk Properly
TradeVision Pro - Educational Trading Tool
Created by Zakaria Safri
═══════════════════════════════════════════════════════════════════

Smart Structure Pro - Market Structure & Smart Money Concepts═══════════════════════════════════════════════════════════════════════════════
SMART STRUCTURE PRO
═══════════════════════════════════════════════════════════════════════════════
A comprehensive market structure analysis tool that identifies institutional trading
patterns and smart money concepts for improved trade timing and decision-making.
═══════════════════════════════════════════════════════════════════════════════
📊 WHAT IT DOES
═══════════════════════════════════════════════════════════════════════════════
This indicator automatically detects and visualizes key market structure elements:
🔹 BOS (Break of Structure)
- Identifies trend continuation patterns
- Marks when price breaks above previous highs (bullish) or below previous lows (bearish)
- Confirms trend strength and momentum
🔹 CHoCH (Change of Character)
- Detects potential trend reversals
- Alerts when market structure shifts from bullish to bearish or vice versa
- Helps identify early reversal opportunities
🔹 Order Blocks
- Highlights institutional entry zones
- Identifies the last opposite candle before a structure break
- Shows areas where smart money likely entered positions
🔹 Fair Value Gaps (FVG)
- Detects price imbalances and inefficiencies
- Shows areas where price moved rapidly leaving gaps
- Often act as support/resistance when retested
🔹 Liquidity Zones
- Marks swing high and low levels
- Identifies areas where stop losses likely cluster
- Shows potential stop hunt and liquidity grab zones
═══════════════════════════════════════════════════════════════════════════════
🎯 HOW TO USE
═══════════════════════════════════════════════════════════════════════════════
BULLISH SETUP:
1. Wait for Bullish CHoCH (trend reversal signal) or BOS ↑ (continuation)
2. Look for price to pull back into an Order Block or Fair Value Gap
3. Enter long when price bounces from these zones
4. Place stop loss below the Order Block
5. Target the next liquidity zone or resistance level
BEARISH SETUP:
1. Wait for Bearish CHoCH (trend reversal signal) or BOS ↓ (continuation)
2. Look for price to retrace into an Order Block or Fair Value Gap
3. Enter short when price rejects from these zones
4. Place stop loss above the Order Block
5. Target the next liquidity zone or support level
DASHBOARD INTERPRETATION:
• Trend: Current market direction (Bullish/Bearish)
• Volume: Confirmation strength (High volume = stronger signals)
• Signal: Latest structure break detected
• Key High/Low: Critical levels for the current trend
• Position: Price location (Premium = expensive, Discount = cheap)
═══════════════════════════════════════════════════════════════════════════════
⚙️ SETTINGS GUIDE
═══════════════════════════════════════════════════════════════════════════════
STRUCTURE DETECTION:
• Pivot Length (Default: 10)
- Lower values = More signals but potentially weaker
- Higher values = Fewer signals but stronger/more reliable
- Recommended: 8-12 for intraday, 10-15 for higher timeframes
• Structure Line Extension
- Visual preference for how far lines extend
- Does not affect signal detection
SMART MONEY CONCEPTS:
• Order Block Extension: How long OB boxes remain visible
• FVG Extension: How long gap boxes remain visible
• Min FVG Size: Filter out small gaps (0 = show all)
- Set to 10-20% to reduce noise
- Set to 0 to see all gaps
VOLUME FILTER:
• Volume Confirmation (Recommended: ON)
- Filters weak signals without volume support
- Reduces false breakouts
• Volume Multiplier (Default: 1.5)
- Higher = Stricter filtering (fewer but stronger signals)
- Lower = More signals (but may include weak ones)
DISPLAY:
• Dashboard: Toggle information panel
• Trend Background: Subtle color tint showing current trend
• Dashboard Position: Choose corner placement
═══════════════════════════════════════════════════════════════════════════════
🔔 ALERTS
═══════════════════════════════════════════════════════════════════════════════
Available alert conditions:
✓ Bullish BOS - Uptrend continuation confirmed
✓ Bearish BOS - Downtrend continuation confirmed
✓ Bullish CHoCH - Reversal to uptrend detected
✓ Bearish CHoCH - Reversal to downtrend detected
✓ Structure Break - Any significant market structure change
To set up alerts:
1. Click the "⏰" alert icon
2. Select "Smart Structure Pro"
3. Choose your desired condition
4. Configure notification method
5. Click "Create"
═══════════════════════════════════════════════════════════════════════════════
⚠️ IMPORTANT DISCLOSURES
═══════════════════════════════════════════════════════════════════════════════
REPAINTING BEHAVIOR:
• Pivot points WILL repaint until confirmed (this is by design and unavoidable)
• Structure breaks (BOS/CHoCH) use CLOSED candles and do NOT repaint after confirmation
• Order Blocks and FVGs are drawn on confirmed signals and do NOT repaint
• All signals wait for candle close before triggering
BEST PRACTICES:
• Use on higher timeframes (15min+) for more reliable signals
• Combine with other analysis (support/resistance, volume profile, etc.)
• Wait for candle close confirmation before acting on signals
• Use proper risk management - this is not a standalone trading system
• Backtest on your preferred instrument and timeframe
PERFORMANCE:
• Limited to 100 boxes, 100 lines, 100 labels for optimal performance
• Older objects automatically removed as new ones appear
• Works on all markets (Forex, Crypto, Stocks, Indices, Commodities)
═══════════════════════════════════════════════════════════════════════════════
📚 CONCEPTS EXPLAINED
═══════════════════════════════════════════════════════════════════════════════
MARKET STRUCTURE:
Market structure refers to the pattern of price movements creating swing highs
and lows. Understanding structure helps identify trend direction and potential
reversal points.
SMART MONEY CONCEPTS:
These are trading techniques based on tracking institutional order flow and
understanding where large players (banks, funds, institutions) enter and exit
positions.
ORDER BLOCKS:
The last opposing candle before a strong directional move. Institutions often
leave unfilled orders in these zones, which can act as support/resistance when
price returns.
FAIR VALUE GAPS:
Areas where price moved so quickly that it left an imbalance. These gaps often
get "filled" as price returns to find equilibrium, creating trading opportunities.
═══════════════════════════════════════════════════════════════════════════════
🎓 EDUCATIONAL VALUE
═══════════════════════════════════════════════════════════════════════════════
This indicator helps traders:
✓ Understand market structure mechanics
✓ Identify institutional trading patterns
✓ Improve trade timing and entry precision
✓ Recognize trend continuation vs reversal
✓ Learn smart money concepts through visualization
═══════════════════════════════════════════════════════════════════════════════
📋 TECHNICAL DETAILS
═══════════════════════════════════════════════════════════════════════════════
• Version: 1.0.0
• Pine Script Version: 5
• Indicator Type: Overlay
• No Repainting: Structure breaks use confirmed candles
• Performance Optimized: Limited drawing objects
• Works On: All markets and timeframes
• Alerts: Yes, fully customizable
═══════════════════════════════════════════════════════════════════════════════
👤 AUTHOR
═══════════════════════════════════════════════════════════════════════════════
Created by: Zakaria Safri
Original Work: All code and concepts are original implementations
Based On: ICT (Inner Circle Trader) educational concepts
License: © 2024 Zakaria Safri - Personal Use Only
═══════════════════════════════════════════════════════════════════════════════
⚖️ DISCLAIMER
═══════════════════════════════════════════════════════════════════════════════
This indicator is for educational and informational purposes only. It does not
constitute financial advice. Trading involves substantial risk of loss. Past
performance does not guarantee future results. Always conduct your own research
and consult with a licensed financial advisor before making trading decisions.
The author is not responsible for any losses incurred from using this indicator.
═══════════════════════════════════════════════════════════════════════════════
If you find this indicator helpful, please:
👍 Like and favorite
⭐ Leave a review
📢 Share with other traders
💬 Comment with feedback or suggestions
Happy Trading! 📈

Multi-Timeframe Trend Indicator with Signals═══════════════════════════════════════════════════════════════
Multi-Timeframe Trend Indicator with Signals
by Zakaria Safri
═══════════════════════════════════════════════════════════════
⚠️ IMPORTANT DISCLAIMERS:
━━━━━━━━━━━━━━━━━━━━━━━━━━━━━━━━━━━━━━━━━━━━━━━━━━━━━━━━━━━━━━
• This indicator may REPAINT on unconfirmed bars
• Signals appear in real-time but may change or disappear
• FOR EDUCATIONAL PURPOSES ONLY - NOT FINANCIAL ADVICE
• Past performance does not guarantee future results
• Always do your own research and use proper risk management
• The Risk Management feature is VISUAL ONLY - does not execute trades
━━━━━━━━━━━━━━━━━━━━━━━━━━━━━━━━━━━━━━━━━━━━━━━━━━━━━━━━━━━━━━
📊 OVERVIEW:
━━━━━━━━━━━━━━━━━━━━━━━━━━━━━━━━━━━━━━━━━━━━━━━━━━━━━━━━━━━━━━
This indicator combines multiple technical analysis tools to help identify
potential trend directions and entry/exit points across different timeframes.
It uses SuperTrend, EMAs, ADX, RSI, and Keltner Channels to generate signals.
🎯 KEY FEATURES:
━━━━━━━━━━━━━━━━━━━━━━━━━━━━━━━━━━━━━━━━━━━━━━━━━━━━━━━━━━━━━━
📍 SIGNAL TYPES:
• All Signals: Shows all SuperTrend crossovers
• Filtered Signals: Additional EMA filter for potentially higher quality signals
• Signals use barstate.isconfirmed to reduce (but not eliminate) repainting
📈 TREND ANALYSIS:
• Trend Ribbon: 8 EMAs creating a visual trend direction indicator
• Trend Cloud: EMA 150/250 cloud for long-term trend context
• Chaos Trend Line: Dynamic support/resistance trend line
• Multi-timeframe dashboard showing trend across 8 timeframes (3m to Daily)
📊 TECHNICAL INDICATORS:
• Keltner Channels: Dynamic price channels
• RSI Background: Visual overbought/oversold zones
• Candlestick Coloring: Three modes (CleanScalper/Trend Ribbon/Moving Average)
• ADX-based trend strength analysis for MTF dashboard
🎯 VISUAL TOOLS:
• Order Blocks: Supply/demand zones (optional)
• Channel Breakouts: Pivot-based support/resistance levels
• Reversal Signals: RSI-based potential reversal indicators
• Visual TP/SL Lines: For reference only - does NOT execute trades
📊 DASHBOARD:
• Real-time multi-timeframe trend analysis
• Volatility indicator (Very Low to Very High)
• Current RSI value with color coding
• Customizable position and size
⚙️ SETTINGS:
━━━━━━━━━━━━━━━━━━━━━━━━━━━━━━━━━━━━━━━━━━━━━━━━━━━━━━━━━━━━━━
MAIN SETTINGS:
• Sensitivity: Controls signal frequency (lower = more signals)
• Signal Type: Choose between All Signals or Filtered Signals
• Factor: ATR multiplier for SuperTrend calculation
TREND SETTINGS:
• Toggle Trend Ribbon, Trend Cloud, Chaos Trend, Order Blocks
• Moving Average: Customizable EMA (default 200)
ADVANCED SETTINGS:
• Candlestick coloring with 3 different modes
• Overbought/Oversold background coloring
• Channel breakout levels
• Show/hide signals
RISK MANAGEMENT (VISUAL ONLY):
• ⚠️ Does NOT execute trades automatically
• Shows potential Take Profit levels (TP1, TP2, TP3)
• Shows potential Stop Loss level
• Adjustable TP strength multiplier
• For educational reference only
📖 HOW TO USE:
━━━━━━━━━━━━━━━━━━━━━━━━━━━━━━━━━━━━━━━━━━━━━━━━━━━━━━━━━━━━━━
1. SIGNAL INTERPRETATION:
• "Buy" signals appear below candles when conditions are met
• "Sell" signals appear above candles when conditions are met
• Wait for bar close confirmation to avoid repainting
• Use multiple timeframes for confluence
2. TREND CONFIRMATION:
• Check the multi-timeframe dashboard for trend alignment
• Use Trend Ribbon for visual trend direction
• Trend Cloud shows longer-term market bias
• Green candles = potential uptrend, Red = potential downtrend
3. ENTRY/EXIT STRATEGY:
• Combine signals with other analysis tools
• Check volatility status before entering trades
• Use support/resistance levels for confirmation
• The visual TP/SL lines are for planning only
4. RISK MANAGEMENT:
• Always use stop losses (indicator shows suggested levels only)
• Position size according to your risk tolerance
• Never risk more than you can afford to lose
• The indicator does NOT manage trades automatically
⚠️ LIMITATIONS & RISKS:
━━━━━━━━━━━━━━━━━━━━━━━━━━━━━━━━━━━━━━━━━━━━━━━━━━━━━━━━━━━━━━
REPAINTING:
• Signals may appear and disappear on unconfirmed bars
• Always wait for bar close before taking action
• Historical performance may look better than real-time results
FALSE SIGNALS:
• No indicator is 100% accurate
• Signals can fail in ranging/choppy markets
• Use additional confirmation methods
• Consider market context and fundamentals
VISUAL TP/SL:
• Lines are for reference/planning only
• Does NOT place or manage actual trades
• You must manually set your own stop losses
• TP levels are calculated estimates, not guarantees
🔧 TECHNICAL DETAILS:
━━━━━━━━━━━━━━━━━━━━━━━━━━━━━━━━━━━━━━━━━━━━━━━━━━━━━━━━━━━━━━
• Version: Pine Script v5
• Overlay: Yes (displays on main chart)
• Anti-repaint measures: Uses barstate.isconfirmed on signals
• Security function: Uses lookahead protection for higher timeframes
• Dynamic requests: Enabled for MTF analysis
• Max labels: 500
📚 COMPONENTS EXPLAINED:
━━━━━━━━━━━━━━━━━━━━━━━━━━━━━━━━━━━━━━━━━━━━━━━━━━━━━━━━━━━━━━
SUPERTREND:
• Core signal generator using ATR-based bands
• Crossovers indicate potential trend changes
• Adjustable via Sensitivity and Factor inputs
EMA FILTER:
• Uses 200 EMA as trend filter (customizable)
• Filtered signals require price above/below EMA
• Helps reduce false signals in ranging markets
ADX TREND QUALITY:
• Measures trend strength across timeframes
• Used in multi-timeframe dashboard
• Shows Bullish/Bearish/Neutral states
KELTNER CHANNELS:
• Multiple bands showing volatility zones
• Color-coded based on RSI levels
• Helps identify overbought/oversold conditions
ORDER BLOCKS:
• Identifies supply/demand zones
• Based on price structure and pivots
• Can extend to the right for projection
💡 BEST PRACTICES:
━━━━━━━━━━━━━━━━━━━━━━━━━━━━━━━━━━━━━━━━━━━━━━━━━━━━━━━━━━━━━━
✓ Use multiple timeframe confirmation
✓ Wait for bar close before acting on signals
✓ Combine with support/resistance analysis
✓ Check overall market conditions
✓ Use proper risk management (1-2% per trade)
✓ Backtest on your specific market/timeframe
✓ Paper trade before using real money
✓ Keep a trading journal
✓ Adjust settings to your trading style
✗ Don't rely solely on this indicator
✗ Don't ignore risk management
✗ Don't trade on unconfirmed signals
✗ Don't overtrade every signal
✗ Don't use without understanding how it works
✗ Don't expect the TP/SL feature to trade for you
📞 SUPPORT & UPDATES:
━━━━━━━━━━━━━━━━━━━━━━━━━━━━━━━━━━━━━━━━━━━━━━━━━━━━━━━━━━━━━━
Creator: Zakaria Safri
Version: 4.3 (Compliance Update)
For questions or feedback, please use TradingView's comment section.
⚖️ FINAL DISCLAIMER:
━━━━━━━━━━━━━━━━━━━━━━━━━━━━━━━━━━━━━━━━━━━━━━━━━━━━━━━━━━━━━━
This indicator is provided for EDUCATIONAL and INFORMATIONAL purposes only.
It is NOT financial advice, investment advice, or a recommendation to buy/sell.
Trading involves substantial risk of loss. Past performance, whether actual or
indicated by historical tests of strategies, is not indicative of future results.
The creator assumes NO responsibility for your trading results. You are solely
responsible for your own investment decisions and due diligence.
Always consult with a qualified financial advisor before making investment decisions.
By using this indicator, you acknowledge and accept these risks and limitations.

Strong Engulfing Scalping qgm engulfing detector. If no time to find engulfing my strategy found engulfing alert u through notification

Super_Fibo_1.618Professional Fibonacci-based breakout indicator with automatic TP/SL calculation.
Features:
- Fibonacci extension levels (1.618, 2.618, 3.618)
- Automatic Take Profit and Stop Loss zones
- Real-time signal alerts
- Visual candle coloring
- Performance statistics dashboard
- Built-in license system
Perfect for swing and day trading on all timeframes.

