BluePrint SessionsBlueprint Sessions is a multi-session visual tool designed to help traders identify the three most important global market opens with precision.
Features:
Adaptive to chart timezone — sessions automatically adjust to the time zone you select in TradingView.
Three Key Market Sessions:
Asian Session
London Session
New York Session
Bill Williams Indicators

RUDWAN OSMAN MUHUMED redsco trader
this indicator will help you to use ema 9 and ema 20 together with one indicator.

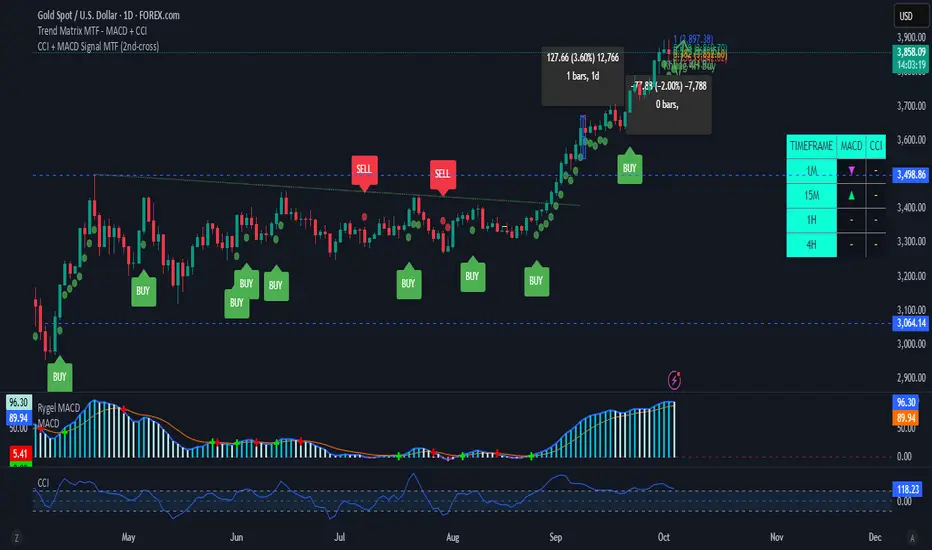
CCI + MACD Signal MTF (2nd-cross)This custom indicator combines the Commodity Channel Index (CCI) and the MACD to generate trading signals.
Basic signals (dots):
A green dot is plotted when CCI is above +100 and MACD is positive.
A red dot is plotted when CCI is below –100 and MACD is negative.
These dots help visualize momentum alignment between the two indicators.
Second-cross signals (text + alert):
The indicator also tracks cycles of the CCI.
When CCI first moves above +100 and later falls back below +100, this is counted as one completed cycle.
The next time CCI crosses back above +100 (the second cross), if MACD is still positive, a “BUY” label is plotted and a buy alert is triggered.
Conversely, when CCI first moves below –100 and later rises back above –100, that is one completed cycle.
The next time CCI crosses back below –100 (the second cross), if MACD is negative, a “SELL” label is plotted and a sell alert is triggered.
Alerts:
Alerts are only fired on the second-cross events (BUY or SELL), making them rarer but potentially more reliable than the basic dot conditions.
Timeframe flexibility:
Both the CCI and the MACD can be calculated on custom timeframes independently of the chart’s timeframe.
Top-CM_EMA Trend Bars with Alerts and Arrows (03102025) v01🟢 Top-CM_EMA Trend Bars with Alerts and Arrows (03102025) v01
🔎 Indicator Overview:
Top-CM_EMA Trend Bars is a technical analysis tool that utilizes an Exponential Moving Average (EMA) to help traders visually identify market trends. It automatically colors the candles based on trend direction and provides real-time alerts and arrows when a potential trend reversal occurs.
⚙️ Key Features:
✅ 1. EMA-Based Trend Detection
Uses a user-defined EMA (default: 34 periods).
If the average price of a candle (hlc3) is above the EMA → trend is considered uptrend (bullish).
If the price is below the EMA → trend is considered downtrend (bearish).
✅ 2. Color-Coded Trend Bars
Candles are automatically colored to reflect the current trend:
🟩 Green (lime): Uptrend
🟥 Red: Downtrend
Helps traders quickly understand the market direction without manual analysis.
✅ 3. Optional EMA Line Display
Users can choose to show or hide the EMA line with a simple toggle (Show EMA Trend is Based On?).
✅ 4. Real-Time Buy/Sell Alerts
Alerts are triggered when the trend changes:
Transition from bearish to bullish → Buy Signal
Transition from bullish to bearish → Sell Signal
Compatible with TradingView’s alert system for automated notifications.
✅ 5. Directional Arrows on Chart
Displays visual markers:
🔼 Up Arrow (green) below the bar on a Buy Signal
🔽 Down Arrow (red) above the bar on a Sell Signal
Makes it easier to spot trend reversal points directly on the chart.
🧠 Who Is This For?
Technical traders looking for quick visual confirmation of trend direction.
Users who want to automate signal detection and receive instant alerts.
Beginners who prefer a clean and straightforward trend-following tool.

EBCLUB 📌 Indicator Summary – XAUUSD (Fano Chart)
This indicator is designed for traders who work with Smart Money (SMC/ICT) concepts and need a clear reading of key levels and market imbalances.
🔑 Key Features:
Daily and Weekly Levels:
Open Day: Opens the daily session to clearly define the range reference.
PDL/PDH (Previous Day Low/High): High-impact levels used as liquidity magnets.
Current Day High (H4 or Intraday): Tracks short-term structures.
Market Sessions (UTC):
Visualizes which session is active (London, New York, Tokyo, Sydney).
Helps identify when volatility tends to increase.
Liquidity Blocks and Institutional Zones:
Indicates areas of imbalance and accumulation (colored rectangles).
Facilitates the identification of possible entries or continuations.

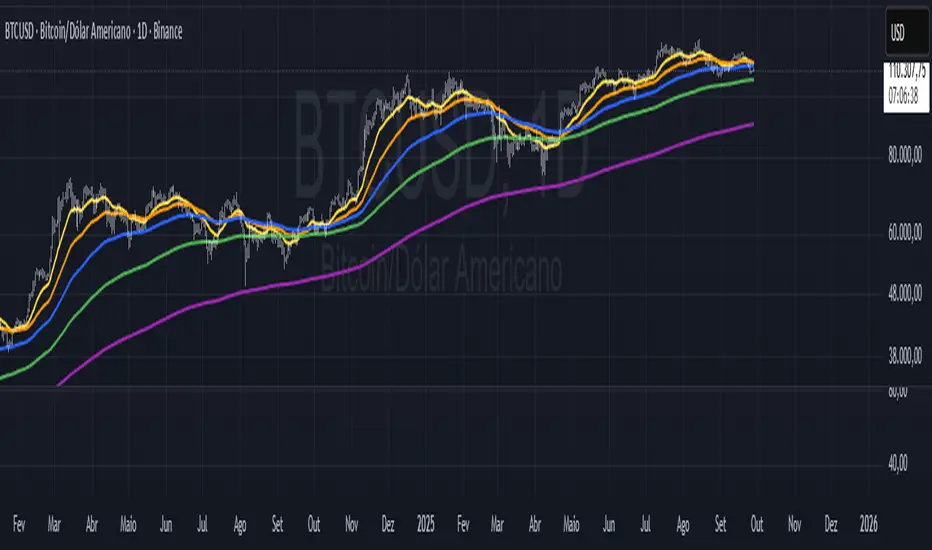
BTC Pro – Modular v6 (Final Version with Clean Labels)A complete Bitcoin charting toolkit built for clarity and decision-making.
✅ EMA levels (21, 50, 200, 800)
✅ Daily EMA 50 (constant across timeframes)
✅ SuperTrend for directional bias
✅ Liquidity zones based on ±2×ATR around SMA50
✅ On-Balance Volume (manual calculation)
✅ ADX trend strength with threshold labeling
✅ RSI divergence detection (bullish/bearish)
✅ Market structure: HH/LL breaks
✅ Entry zones with auto-generated SL/TP boxes
✅ Clean right-side labels (stacked)
✅ Modular toggles for full control via settings
Created by WhyPhy – modular, readable, and ready for live use.

fartbombLinReg fit (history): solid line showing the best-fit linear trend over the last len bars.
Projected offset (visual): same line shifted h bars right so you can see direction.
Future projection (segments): the actual next-h forecast, drawn from the last bar.
Forecast made h bars ago: circle at each bar’s target showing what was predicted h bars earlier.
H / X markers: a hit if that earlier forecast fell inside the bar’s high–low range.

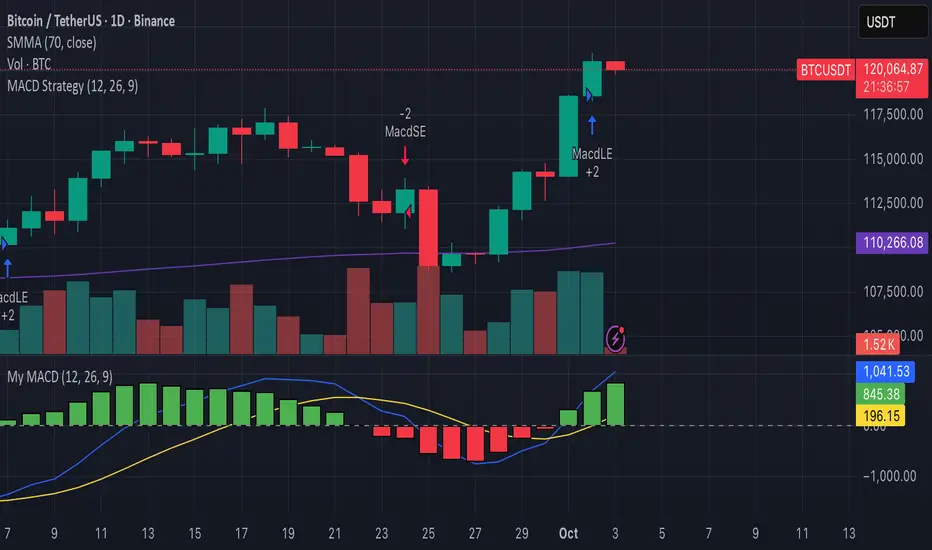
Investorjordann - Script I have developed a script for the BTC pair. I'm currently trialing this...it is using multiple indicators and timeframes to trigger a trade. So far it seems very profitable across many timeframes, but I am still trailing.

EMAs Personalizáveis (até 5)📘 Indicator Explanation – Customizable EMAs (up to 5)
This indicator was developed in Pine Script v6 to make it easier to visualize multiple Exponential Moving Averages (EMAs) on a single chart.
🔑 Main features:
Supports up to 5 different EMAs.
Ability to enable or disable each EMA individually.
Fully customizable period for each EMA.
Flexible color selection for better visual organization.
Adjustable line thickness to highlight the most relevant levels.
📌 How to use:
Open the indicator settings.
Select which EMAs you want to display (from 1 to 5).
Define the period (e.g., 20, 50, 100, 200, etc.).
Choose a color for each EMA.
Observe price behavior relative to the EMAs to identify:
Trends → price above long EMAs indicates bullish strength.
Reversals → EMA crossovers may signal a change in direction.
Dynamic support and resistance → EMAs often act as reaction zones for price.
💡 Practical example:
Short EMA (20) → shows short-term movement.
Mid-term EMA (50 or 100) → confirms trend direction.
Long EMA (200 or 500) → indicates the overall market trend.
👉 This indicator is flexible and can be used for scalping, swing trading, or position trading, depending on the chosen periods.
XAUUSD CSI+RSI+Delta (15m)XAUUSD 15m
Candle Stability Index: 0.4
RSI Index: 80
Candle Delta Length: 6
Disable Repeating Signals: Enabled

1 juicy newXenia BabyBlue is a clean Pine Script indicator designed to keep your chart readable while still giving you the most useful session context. It paints Tokyo, London, and New York as a gentle blue watermark using bgcolor(), so the shading always spans the full pane behind price and never distorts autoscaling. There are no boxes, borders, or labels cluttering the candles—just a soft backdrop that makes session rhythm obvious at a glance.
Time handling is robust and product independent. You can switch between America/New_York and Europe/Berlin presets, and the script builds session windows with explicit timestamps, including overnight ranges such as Tokyo. That means the shading stays aligned even when you change exchanges, symbols, or chart timeframes.
On top of the watermark, Xenia BabyBlue includes a classic EMA 50 for trend bias and a compact two-candle manipulation detector. The logic flags a bullish trap when a bearish candle is followed by a sweep below its low and a close back above its high, and flags the bearish counterpart when a bullish candle is followed by a sweep above its high and a close back below its low. Signals are plotted with soft, unobtrusive labels so they remain visible without overwhelming price action.
The default styling aims for “set and forget.” Still, you can customize the blue intensity, toggle the EMA, and tighten or relax the manipulation rules to match your playbook. The code uses lightweight operations, avoids lookahead, and draws only what is needed per bar, which keeps it responsive on lower timeframes and long histories.
Use Xenia BabyBlue when you want fast session awareness and tidy, actionable hints—whether you’re trading London reversals, New York continuations, or Asia range breaks. It pairs well with ICT-style models, liquidity maps, and structure tools, and it’s intentionally simple to combine with other overlays. Trade focused, not distracted.

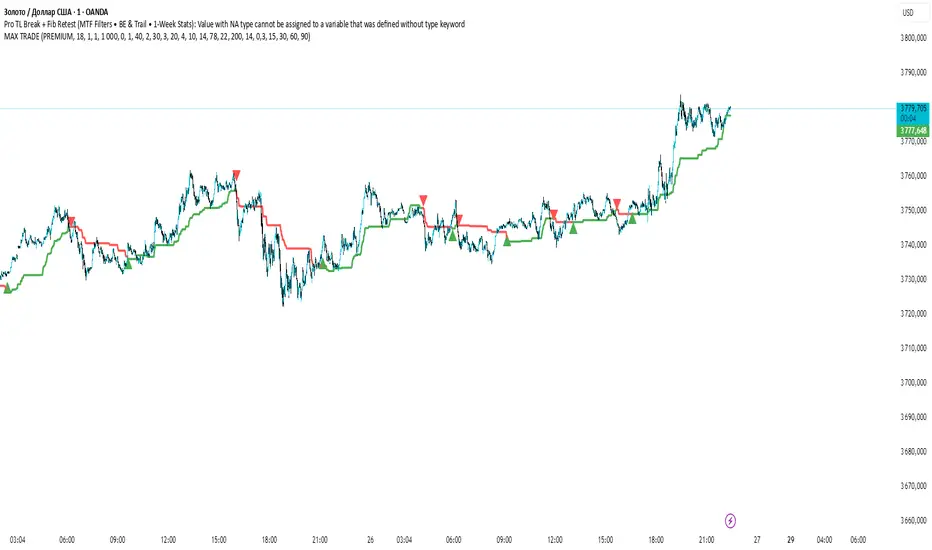
MAX TRADE C1MAX TRADE is designed to identify strong market trends and precise reversal points.
🔹 Built on Fibonacci levels
🔹 Generates Buy & Sell signals
🔹 Calculates Risk/Reward ratios
🔹 Automatically displays TP (Take Profit) and SL (Stop Loss) zones

MAX TRADEMAX TRADE is designed to identify strong market trends and precise reversal points.
🔹 Built on Fibonacci levels
🔹 Generates Buy & Sell signals
🔹 Calculates Risk/Reward ratios
🔹 Automatically displays TP (Take Profit) and SL (Stop Loss) zones
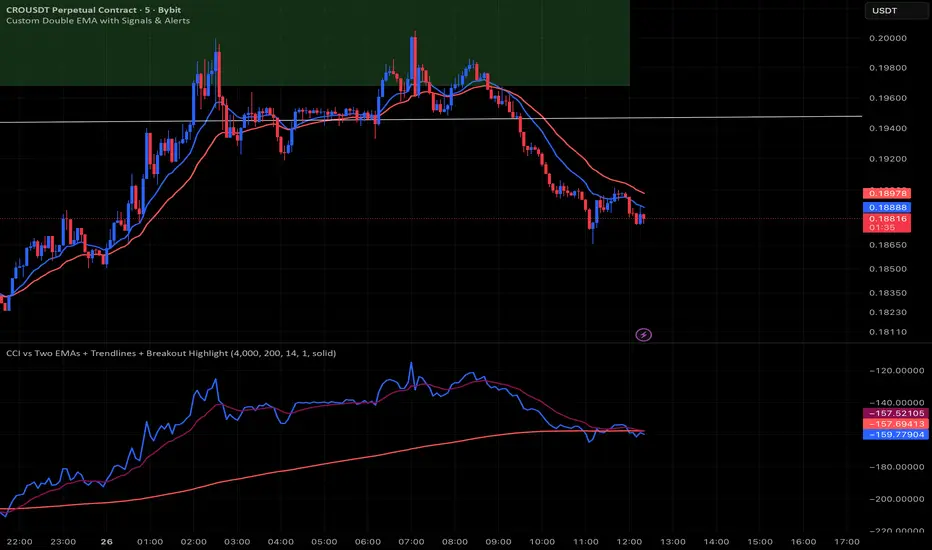
CCI vs Two EMAs + Trendlines + Breakout HighlightPerfect indicator which analyzes the cci4000 & 2 EMAS.
Painel Tendência Multi-TF (EMA Customizável)📊 Multi-Timeframe Trend Panel (Customizable EMA)
This indicator was designed for traders who need clarity and agility when analyzing trends across multiple timeframes.
It provides a quick overview of the relationship between two customizable EMAs and helps spot potential entry or exit points.
✨ Features:
✅ Multi-Timeframe Panel: Instantly check if the short EMA is above (bullish) or below (bearish) the long EMA across different timeframes (from 1m up to 1W).
✅ Automatic Sound Alerts: Configurable notifications for EMA crossovers on the 1H and 4H timeframes.
✅ Customization: Choose the EMA periods that best match your trading strategy.
✅ Full Control: Enable or disable alerts anytime through the settings panel.
🚨 How to use:
Add the indicator to your chart.
Set the EMA periods according to your strategy (default: 9 and 21).
Enable sound alerts for EMA crossovers on 1H and/or 4H as needed.
Create an alert in TradingView (Alerts menu) → select this indicator → choose the condition → receive real-time notifications.
🎯 Benefits:
Clear panoramic view of several timeframes in one panel.
Automatic alerts on key timeframes for trend confirmation.
Saves time: no need to manually switch between charts.
📌 Important Note:
This indicator is not financial advice. It is a tool to support your technical analysis. Always combine it with your own strategy and risk management.

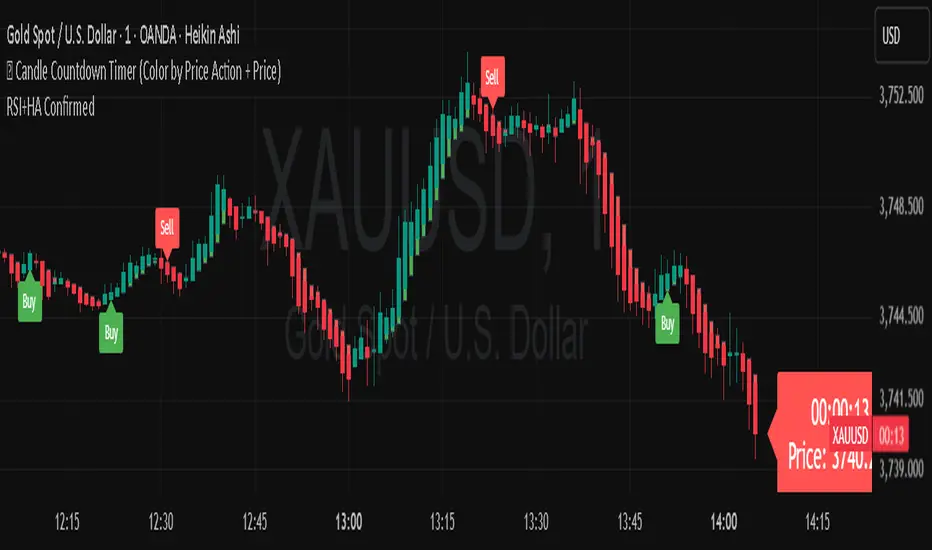
TOP-RSI Double Confirm + Heiken Ashi + Buy/Sell Labels v01📊 RSI Double Confirm + Heiken Ashi + Labels
🔎 Concept
This indicator combines a Zero-based RSI filter with strict candle close confirmation, overlays Heiken Ashi candles for clearer trend visualization, and adds Buy/Sell labels directly on the chart for easier interpretation.
⚙️ Components
1. RSI Double Confirm
RSI is calculated from OHLC4 (open+high+low+close)/4.
The RSI value is shifted by -50 to center it around zero (above 0 = bullish, below 0 = bearish).
Uses user-defined thresholds: Overbought (OB) and Oversold (OS).
📌 Entry conditions:
Buy Signal → RSI crosses upward through OS and the last closed candle is higher than the previous candle.
Sell Signal → RSI crosses downward through OB and the last closed candle is lower than the previous candle.
2. Heiken Ashi Candles
Custom Heiken Ashi values are calculated: haOpen, haClose, haHigh, haLow.
Candles are colored green (if haClose > haOpen) or red (if haClose < haOpen).
Helps smooth price action and highlight trend direction.
3. Alerts
alertcondition is set for both Buy and Sell signals.
Users can create TradingView alerts that trigger whenever a new signal appears.
4. Signals & Labels
A green up arrow is plotted under the candle when a Buy signal is triggered.
A red down arrow is plotted above the candle when a Sell signal is triggered.
Additionally, labels ("Buy" or "Sell") are added at the respective candle to make signals more visible.
📝 How to Use
Add the indicator to your chart (it overlays directly on price).
Adjust inputs:
OB (Overbought) → e.g. 20
OS (Oversold) → e.g. -20
RSI Length → e.g. 7
Watch for signals:
Buy Signal → Green arrow + "Buy" label → potential bullish entry.
Sell Signal → Red arrow + "Sell" label → potential bearish entry.
Set up alerts in TradingView to be notified when new signals appear.
✅ Benefits
Combines RSI confirmation + Heiken Ashi trend filter + Clear chart labels.
Reduces false signals by requiring both RSI cross and strict close confirmation.
Easy to interpret visually with arrows and text labels.
⚠️ Notes
This indicator is meant as a signal confirmation tool, not a standalone strategy.
Best used alongside support/resistance analysis, price action, or volume.
Does not provide automatic stop loss / take profit levels → risk management must be applied by the trader.


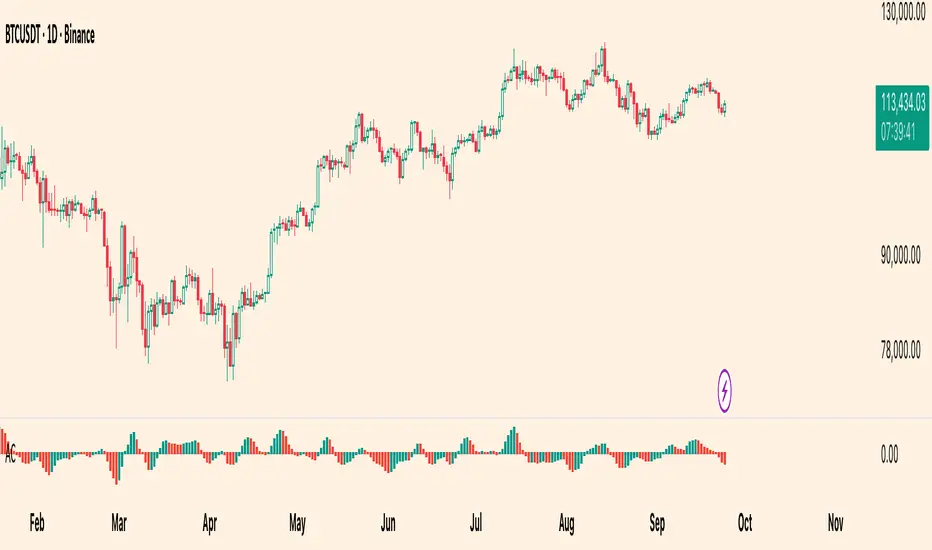
Williams Accelerator Oscillator — ACWhat it is
The Accelerator Oscillator (AC) measures the acceleration/deceleration of momentum. It’s derived from the Awesome Oscillator (AO) and shows whether momentum is speeding up or slowing down. In this implementation, columns are green when AC rises vs. the previous bar and red when it falls.
How it’s calculated
Price source: Median Price (HL2) by default; Close can be used instead.
AO = SMA(HL2, fastLen) − SMA(HL2, slowLen) (defaults: 5 & 34).
AC = AO − SMA(AO, signalLen) (default: 5).
Coloring: Green if AC > AC , else Red.
Zero line (optional) helps contextualize acceleration around neutral.
How to read it (typical interpretation)
Above 0: Upside acceleration (bullish pressure increasing).
Below 0: Downside acceleration (bearish pressure increasing).
Color sequences: Consecutive green columns suggest increasing upside acceleration; consecutive red columns suggest increasing downside acceleration.
Note: AC reflects change in momentum, not trend direction by itself. Many traders confirm with trend filters or price structure before acting.
Inputs
AO Fast SMA (default 5)
AO Slow SMA (default 34)
AC Signal SMA (default 5) — smoothing for the AO used in AC calc
Use Median Price (HL2) for AO (on/off)
Show zero line (on/off)
Show AO (for reference) (on/off)
Show AC signal (SMA of AO) (on/off)
Plots
AC Histogram — column chart colored by acceleration (green/red).
Zero — optional baseline at 0.
AO — optional reference line.
AO Signal (SMA) — optional smoothing line of AO.
Alerts
AC crosses above 0 — acceleration flips positive.
AC crosses below 0 — acceleration flips negative.
AC green above zero — AC rising and > 0.
AC red below zero — AC falling and < 0.
Usage tips
On lower timeframes, consider a slightly larger signalLen to reduce noise.
Confirm with price action, trend filters, or volatility context.
Values update intrabar; for stricter signals, confirm on bar close.
Limitations
AC is built from moving averages and is therefore lagging relative to raw price.
It is not normalized; behavior can vary by instrument and timeframe.
Do not use in isolation for entries/exits without risk management.
Credits
Concept by Bill Williams. This script is an independent implementation for educational and research purposes.
Disclaimer
No financial advice. Markets involve risk; test thoroughly before live use.
Market Weather CompassMarket Weather Compass: Your At-a-Glance Market Condition Dashboard
Markets move like the weather: sometimes calm, sometimes stormy. This indicator acts as your personal market weather station, providing an intuitive, at-a-glance view of current conditions across major markets. Instead of juggling dozens of charts, you can instantly assess risk and identify opportunities with a single, easy-to-read tool.
Key Features
Multi-Market Analysis: Automatically detects and evaluates conditions for US Stocks (NYSE, NASDAQ), Korean Stocks (KRX), and the Crypto market.
Composite Weather Score: Synthesizes complex data from key economic drivers—VIX (volatility), DXY (dollar index), US10Y (bond yields), and USD/KRW (FX rate)—into a single, smoothed score line on your chart.
Intuitive Dashboard: Displays the current "Weather State" (e.g., Sunny, Cloudy, Risk), a corresponding strategy, and real-time values of key indicators in a clean table at the bottom-right of your chart.
Crypto-Specific States: For crypto markets, it identifies unique conditions like "Alt Season" or "Bitcoin Bull" by analyzing total market cap and Bitcoin dominance (BTC.D) trends.
Intelligent Alert System: Provides timely, configurable alerts for significant changes, including weather state shifts, index spikes/crashes, volatility surges, and trend changes in key drivers.
Bilingual Support: Fully localized interface with a simple language toggle (English/Korean) in the settings.
How to Use
Load the Indicator: Add the "Market Weather Compass" to your TradingView chart.
💡 Important: The indicator auto-detects the market (US, KR, Crypto) based on the current chart. To receive alerts for a specific market, you must apply the indicator to a chart of a ticker from that market (e.g., AAPL for US stocks, BTCUSDT for crypto).
Configure Settings:
In the indicator settings, choose your preferred Language.
Enable or disable the Dashboard and Alerts for each market type as needed.
Fine-tune thresholds for alerts and criteria for the weather score to match your trading style.
Interpret the Visuals:
Dashboard: Use the dashboard for a quick summary of the current market state, index performance, and key metric trends (indicated by 🔺 or 🔻).
Weather Score Line: Follow the main score line in the indicator pane. A rising line indicates improving conditions (moving toward green), while a falling line suggests worsening conditions (moving toward red). The zero-line acts as a neutral baseline.
Detailed Alerts Guide
This indicator acts as your personal market radar. You can configure alerts for the following key events:
Market Weather Change: Get notified instantly when the overall market condition shifts (e.g., from Sunny to Cloudy or Risk).
Index Volatility: Receive alerts for sudden market spikes or drops based on your custom percentage threshold for the main index (e.g., Nasdaq futures, KOSPI).
Volatility Index Trends : Alerts for when the VIX (for US) or VKOSPI (for KR) begins a new rising or falling trend, signaling shifts in market sentiment.
Currency & Bond Yields: Notifications when the Dollar Index (DXY) or USD/KRW exchange rate breaks key trends, or when the US 10-Year Treasury Yield (US10Y) crosses into a risk zone.
Crypto Market Dynamics: Specific alerts for the start of an "Alt Season," a shift in Bitcoin dominance, or changes in the ETH/BTC trend.
Example Strategies
The indicator's output is not a signal, but a guide to inform your strategy.
Weather = Sunny → Conditions are favorable. Consider focusing on strong sectors or scaling into positions.
Weather = Risk → Conditions are unfavorable. Consider reducing exposure, taking profits, or increasing cash positions.
Crypto = Alt Season → Broad market rally. Capital may be flowing from majors to altcoins.
Crypto = Bitcoin Bull → Bitcoin is leading the market. Altcoins may underperform.
Disclaimer
This indicator is a tool for market analysis and should not be considered financial advice. It provides a simplified model of complex market dynamics. All trading and investment decisions involve risk, and you are solely responsible for your own choices. Always conduct your own thorough research before entering a trade. Past performance is not indicative of future results.
Final Note
Investing is a constant balance between risk and opportunity. The Market Weather Compass aims to make that balance as clear and intuitive as a daily weather forecast. Next time you open a chart, let this compass be your guide.
