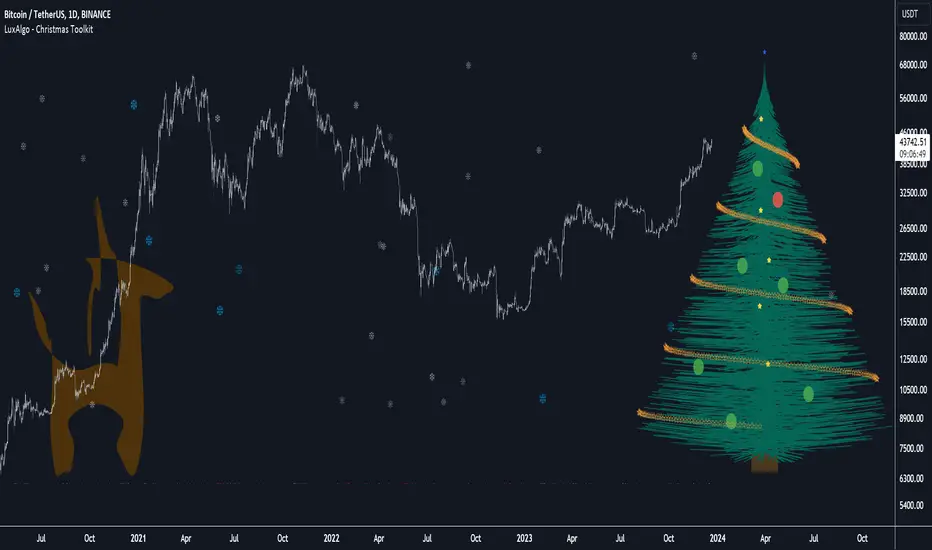
Christmas Toolkit [LuxAlgo]It's that time of the year... and what would be more appropriate than displaying Christmas-themed elements on your chart?
The Christmas Toolkit displays a tree containing elements affected by various technical indicators. If you're lucky, you just might also find a precious reindeer trotting toward the tree, how fancy!
🔶 USAGE
Each of the 7 X-mas balls is associated with a specific condition.
Each ball has a color indicating:
lime: very bullish
green: bullish
blue: holding the same p
Indicators and strategies
GuageLibrary "Gauge"
The gauge library utilizes a gaugeParams object, encapsulating crucial parameters for gauge creation. Essential attributes include num (the measured value) , min (the minimum value equating to 100% on the gauge's minimum scale) , and max (the maximum value equating to 100% on the gauge's maximum scale) . The size attribute (defaulting to 10) splits the scale into increments, each representing 100% divided by the specified size.
The num value dynamically shif
MarketHolidaysLibrary "MarketHolidays"
The MarketHolidays library compiles market holidays (including historical special market closures) into arrays, which can then be utilized in TradingView indicators and strategies to account for non-trading days. The datasets were split into different libraries to overcome compiling limitations, streamline the process of removing specific time frames if not needed, and to enhance code execution speed. The timestamps are generated using a custom Python script that empl
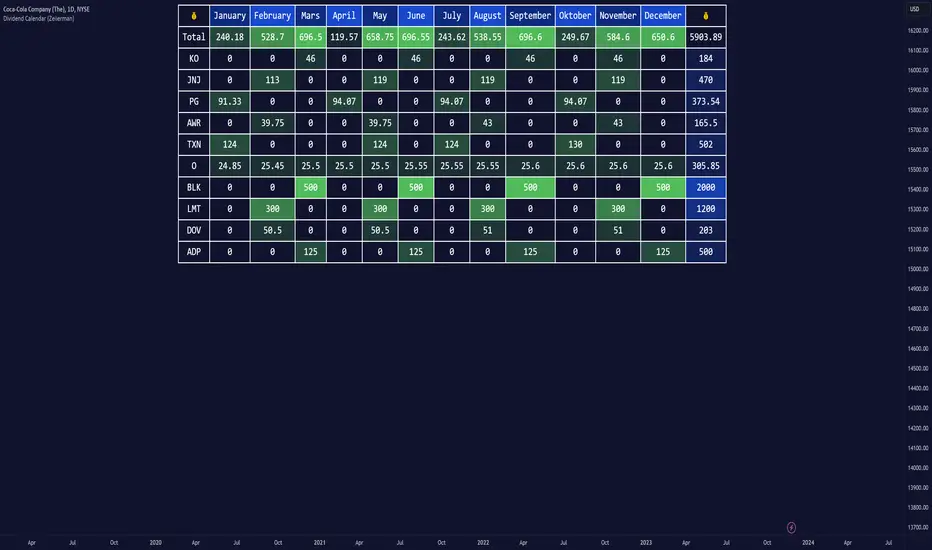
Dividend Calendar (Zeiierman)█ Overview
The Dividend Calendar is a financial tool designed for investors and analysts in the stock market. Its primary function is to provide a schedule of expected dividend payouts from various companies.
Dividends, which are portions of a company's earnings distributed to shareholders, represent a return on their investment. This calendar is particularly crucial for investors who prioritize dividend income, as it enables them to plan and manage their investment strategies with gr
Liquidity Price Depth Chart [LuxAlgo]The Liquidity Price Depth Chart is a unique indicator inspired by the visual representation of order book depth charts, highlighting sorted prices from bullish and bearish candles located on the chart's visible range, as well as their degree of liquidity.
Note that changing the chart's visible range will recalculate the indicator.
🔶 USAGE
The indicator can be used to visualize sorted bullish/bearish prices (in descending order), with bullish prices being highlighted on the left side of the
Intersection Value FunctionsWinning entry for the first Pinefest contest. The challenge required providing three functions returning the intersection value between two series source1 and source2 in the event of a cross, crossunder, and crossover.
Feel free to use the code however you like.
🔶 CHALLENGE FUNCTIONS
🔹 crossValue()
//@function Finds intersection value of 2 lines/values if any cross occurs - First function of challenge -> crossValue(source1, source2)
//@param source1 (float) source value 1
//@par
AR Forecast Scatterplot [SS]This is a showcase indicator of my recently released SPTS library (the partner of the SPTS indicator).
This is just to show some of the practical applications of the boring statistical functions contained within the library/SPTS indicator :-).
This is an autoregressive (AR), scatter plot forecaster. What this means is it tags a lag of 1, performs an autoregressive assessment over the desired training time, then uses what it learns over that training time to forecast the likely outcome.
Its
Volume Profile with a few polylinesThe base of "Volume Profile with a few polylines" is another script of mine, Volume Profile (Maps) .
The structure of maps is used to gather the data. However, the drawings is done with polylines.
This enables coders to draw an entire volume profile with just a few polylines, while the range is broader.
This results in the benefit to draw more "lines" than with line.new() / box.new() alone.
🔶 CONCEPTS
🔹 Polylines
polyline.new creates a new polyline instance and displays it
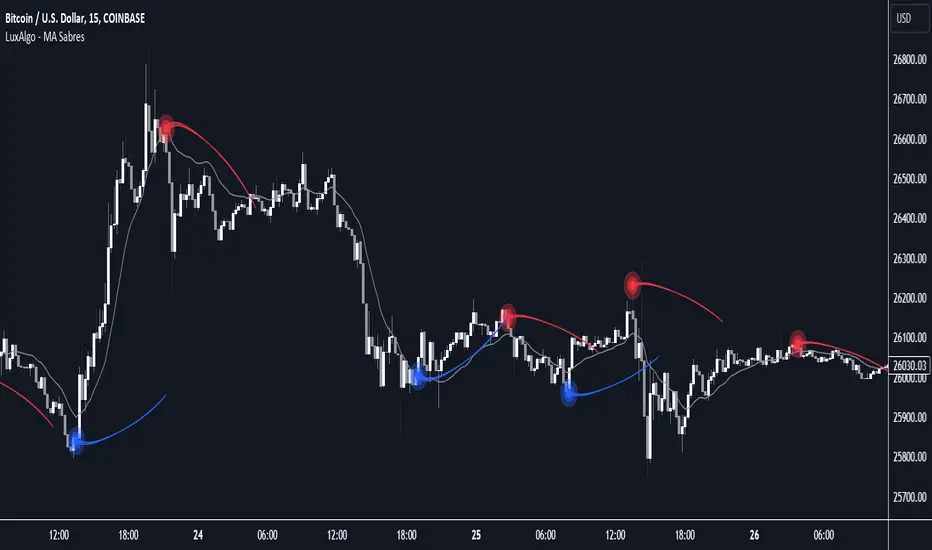
MA Sabres [LuxAlgo]The "MA Sabres" indicator highlights potential trend reversals based on a moving average direction. Detected reversals are accompanied by an extrapolated "Sabre" looking shape that can be used as support/resistance and as a source of breakouts.
🔶 USAGE
If a selected moving average (MA) continues in the same direction for a certain time, a change in that direction could signify a potential reversal.
In this publication, when a trend change occurs, a sabre-shaped figure is drawn which
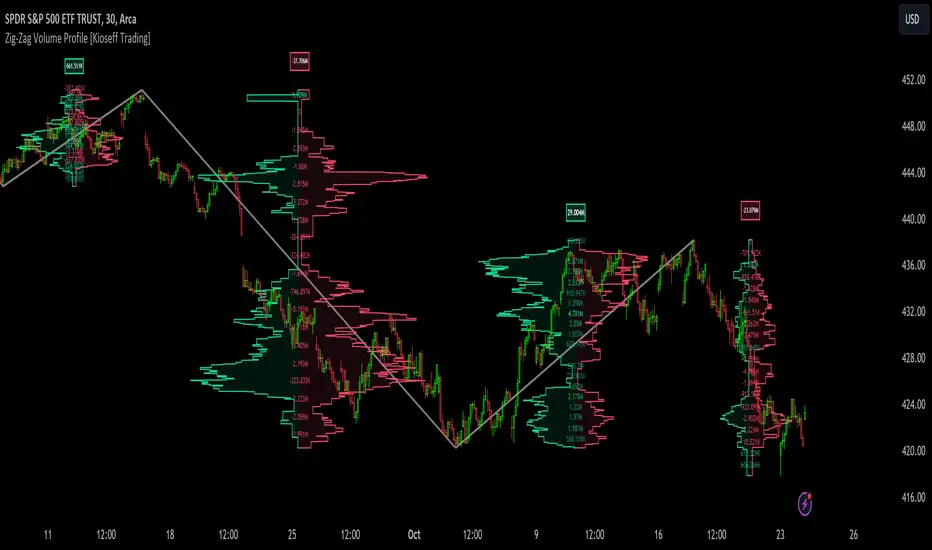
Zig-Zag Volume Profile (Bull vs. Bear) [Kioseff Trading]Hello!
Thank you @Pinecoders and @TradingView for putting polylines in production and making this viable!!
This script "Zig Zag Volume Profile" implements the polyline feature for Pine Script!
Features
Volume Profile anchored to zig zag trends
Bull vs Bear profiles!
Delta x price level
Standard POC and value area lines, in addition to separated POCs and value area lines for bull profiles and bear profiles
Up to 9999 profile rows per zigzag trend
Stylistic options for profiles
Volume and Price Z-Score [Multi-Asset] - By LeviathanThis script offers in-depth Z-Score analytics on price and volume for 200 symbols. Utilizing visualizations such as scatter plots, histograms, and heatmaps, it enables traders to uncover potential trade opportunities, discern market dynamics, pinpoint outliers, delve into the relationship between price and volume, and much more.
A Z-Score is a statistical measurement indicating the number of standard deviations a data point deviates from the dataset's mean. Essentially, it provides insight into
Machine Learning using Neural Networks | EducationalThe script provided is a comprehensive illustration of how to implement and execute a simplistic Neural Network (NN) on TradingView using PineScript.
It encompasses the entire workflow from data input, weight initialization, implicit neuron calculation, feedforward computation, backpropagation for weight adjustments, generating predictions, to visualizing the Mean Squared Error (MSE) Loss Curve for monitoring the training phase.
In the visual example above, you can see that the prediction is
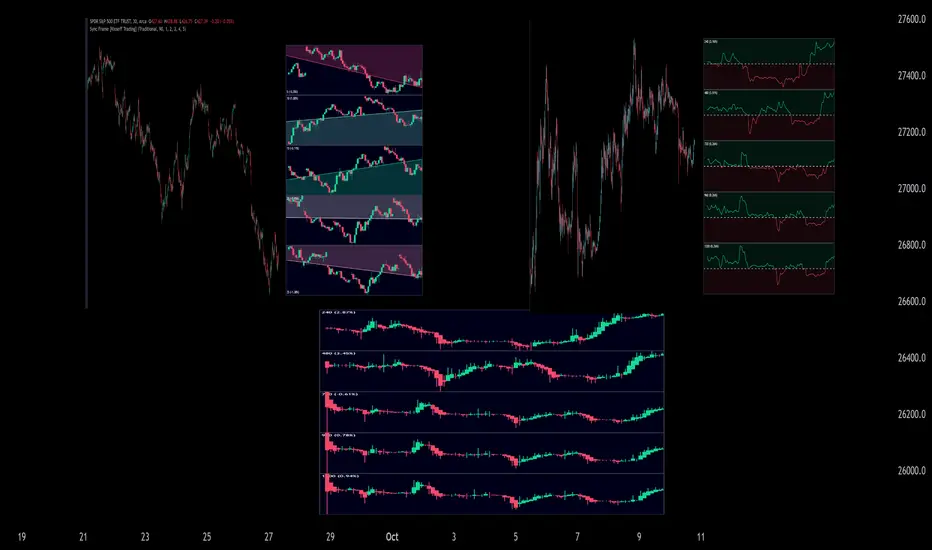
Sync Frame (MTF Charts) [Kioseff Trading]Hello!
This indicator "Sync Frame" displays various lower timeframe charts for the asset on your screen!
5 lower timeframe candle charts shown
Timeframes auto-calculated using the new timeframe.from_seconds() function
Heikin-Ashi candles available
Baseline chart type available
Dynamic Scaling for ease of use
User customizable timeframes
Simple script (:
The image above shows the baseline chart type.
Time image above shows a traditional candlestick chart.
The image abo
Tops & Bottoms - Time of Day Report█ OVERVIEW
The indicator tracks and reports the percentage of occurrence of daily tops and bottoms by the time of the day.
█ CONCEPTS
At certain times during the trading day, the market reverses and marks the high or low of the day. Tops and bottoms are vital when entering a trade, as they will decide if you are catching the train or being straight offside. They are equally crucial when exiting a position, as they will determine if you are closing at the optimal price or seeing your unrea
Monte Carlo Simulation - Your Strategy [Kioseff Trading]Hello!
This script “Monte Carlo Simulation - Your Strategy” uses Monte Carlo simulations for your inputted strategy returns or the asset on your chart!
Features
Monte Carlo Simulation: Performs Monte Carlo simulation to generate multiple future paths.
Asset Price or Strategy: Can simulate either future asset prices based on historical log returns or a specific trading strategy's future performance.
User-Defined Input: Allows you to input your own historical returns for simulation.
Sta
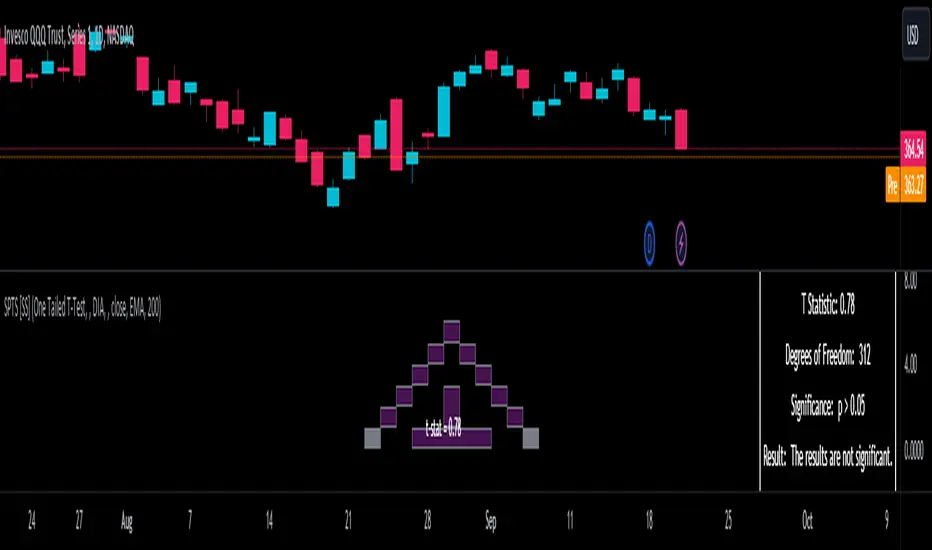
Statistical Package for the Trading Sciences [SS]
This is SPTS.
It stands for Statistical Package for the Trading Sciences.
Its a play on SPSS (Statistical Package for the Social Sciences) by IBM (software that, prior to Pinescript, I would use on a daily basis for trading).
Let's preface this indicator first:
This isn't so much an indicator as it is a project. A passion project really.
This has been in the works for months and I still feel like its incomplete. But the plan here is to continue to add functionality to it and actually h
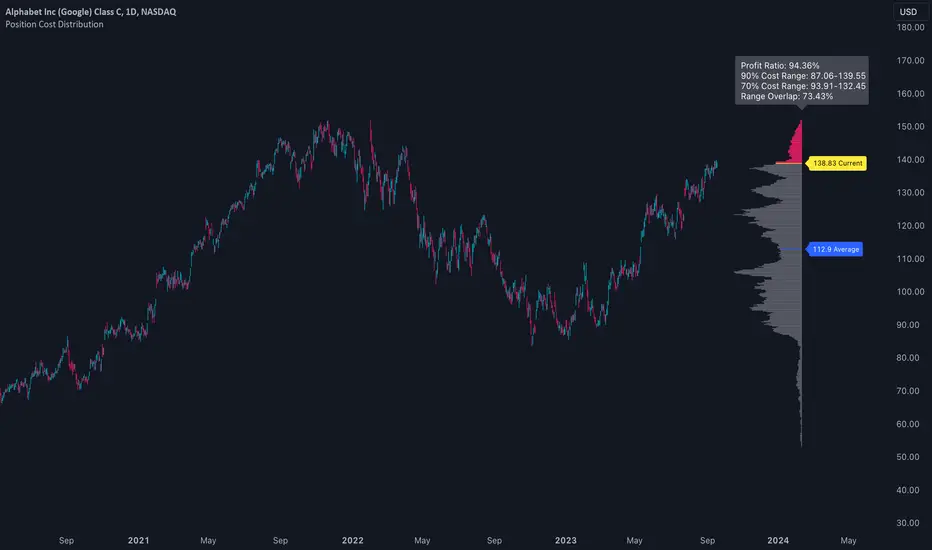
Position Cost DistributionThe Position Cost Distribution indicator (also known as the Market Position Overview, Chip Distribution, or CYQ Algorithm) provides an estimate of how shares are distributed across different price levels. Visually, it resembles the Volume Profile indicator, though they rely on distinct computational approaches.
🟠 Principle
The Position Cost Distribution algorithm is based on the principle that a security's total shares outstanding usually remains constant, except under conditions like stock
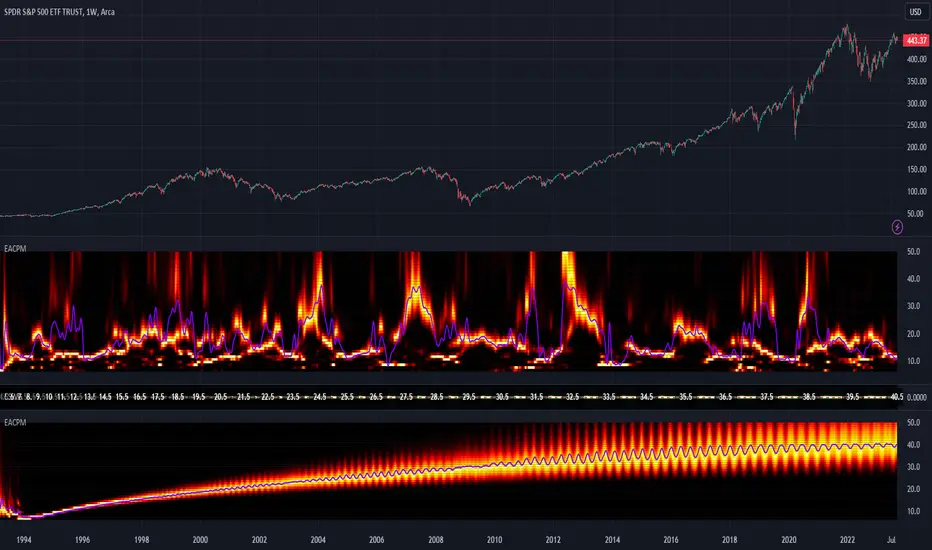
[Excalibur] Ehlers AutoCorrelation Periodogram ModifiedKeep your coins folks, I don't need them, don't want them. If you wish be generous, I do hope that charitable peoples worldwide with surplus food stocks may consider stocking local food banks before stuffing monetary bank vaults, for the crusade of remedying the needs of less than fortunate children, parents, elderly, homeless veterans, and everyone else who deserves nutritional sustenance for the soul.
DEDICATION:
This script is dedicated to the memory of Nikolai Dmitriyevich Kondratiev (Ник
Support & Resistance AI (K means/median) [ThinkLogicAI]█ OVERVIEW
K-means is a clustering algorithm commonly used in machine learning to group data points into distinct clusters based on their similarities. While K-means is not typically used directly for identifying support and resistance levels in financial markets, it can serve as a tool in a broader analysis approach.
Support and resistance levels are price levels in financial markets where the price tends to react or reverse. Support is a level where the price tends to stop falling and mig
ABC on Recursive Zigzag [Trendoscope]There are several implementations of ABC pattern in tradingview and pine script. However, we have made this indicator to provide users additional quantifiable information along with flexibility to experiment and develop their own strategy based on the patterns.
🎲 Highlights of this indicator over other ABC implementations are:
Implementation is based on recursive multi level zigzag allows bigger as well as smaller patterns to be identified
Allows users to set their trading rules with r
Signal AdapterThis Signal Adapter script can compose a signal based on inputs from other simple (non-signal) indicators and can forwards it to the "Template Trailing Strategy".
It allows the user to combine up to eight external inputs and define the conditions that will trigger the start, end, cancel start and cancel end deals.
A signal will be composed from those user-defined conditions. The "indicator on indicator" feature is needed so you can forward the resulted signal to the "Template Trailing Strategy".
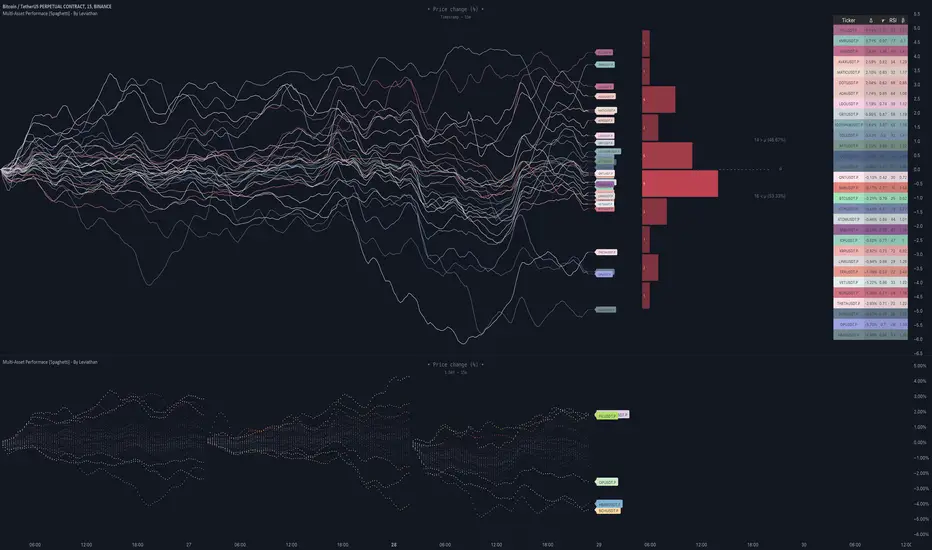
Multi-Asset Performance [Spaghetti] - By LeviathanThis indicator visualizes the cumulative percentage changes or returns of 30 symbols over a given period and offers a unique set of tools and data analytics for deeper insight into the performance of different assets.
Multi Asset Performance indicator (also called “Spaghetti”) makes it easy to monitor the changes in Price, Open Interest, and On Balance Volume across multiple assets simultaneously, distinguish assets that are overperforming or underperforming, observe the relative strength of di
SimilarityMeasuresLibrary "SimilarityMeasures"
Similarity measures are statistical methods used to quantify the distance between different data sets
or strings. There are various types of similarity measures, including those that compare:
- data points (SSD, Euclidean, Manhattan, Minkowski, Chebyshev, Correlation, Cosine, Camberra, MAE, MSE, Lorentzian, Intersection, Penrose Shape, Meehl),
- strings (Edit(Levenshtein), Lee, Hamming, Jaro),
- probability distributions (Mahalanobis, Fidelity, Bhattacharyya, Hell
All Candlestick Patterns on Backtest [By MUQWISHI]▋ INTRODUCTION :
The “All Candlestick Patterns on Backtest” indicator generates a table that offers a clear visualization of the historical return percentages for each candlestick pattern strategy over a specified time period. This table serves as an organized resource, serving as a launching point for in-depth research into candle formations. It may help to rectify any misconceptions surrounding candlestick patterns, refine trading approaches, and it could be foundation to make informed decisi