Live Position Sizer (LPS)Description (EN)
(Magyar leíráshoz görgess lejjebb!)
Live Position Sizer (LPS) is a discretionary trading utility designed to visualize risk, reward, and position size directly on the chart in real time.
The indicator draws a TradingView-style long or short position box and calculates the required position size based on your defined capital, maximum risk, stop-loss distance, and a user-defined lot conversion factor.
LPS is intended strictly as a decision-support and risk management tool. It does not place trades or generate automated signals.
Core features:
Automatic Long / Short position visualization
Dynamic Entry, Stop Loss, and Take Profit levels
Real-time position size calculation
Configurable Risk/Reward ratio
Fully customizable colors, transparency, and line styles
Clean, minimal on-chart labels showing direction, RR, and lot size
Only one active position box at a time for a clutter-free chart
Position sizing logic:
TradingView internally calculates position size in units, not broker-specific lots.
To bridge this difference, LPS uses a user-defined “Units per 1 Lot” multiplier.
Examples:
Forex (standard lot): 100000
Gold (XAUUSD): 1 or 100 (broker dependent)
Indices (e.g. NAS100): 1
The indicator first calculates the position size in TradingView units and then converts it to lots using this multiplier.
The displayed lot size is rounded to 0.01 lots.
Stop Loss logic:
The Stop Loss level is derived from the High or Low of a selectable previous candle.
Increasing the bar-back value places the Stop Loss further away, which:
increases stop distance
reduces position size for the same risk
Intended use:
Manual / discretionary trading
Risk management and position sizing
Trade planning and visualization
Educational purposes
Important notes:
This indicator does not execute trades
No alerts or automation by default
Lot size and contract specifications vary by broker
Always verify the exact lot or contract size with your broker before trading
------------------------------------
Description (HU)
A Live Position Sizer (LPS) egy diszkrecionális kereskedést támogató segédindikátor, amely valós időben jeleníti meg a kockázatot, a célárat és a pozícióméretet közvetlenül a charton.
Az indikátor TradingView-stílusú long vagy short pozíció boxot rajzol, és kiszámolja a szükséges pozícióméretet a megadott tőke, maximális kockázat, stop-loss távolság és egy felhasználó által definiált LOT szorzó alapján.
Az LPS nem stratégia, kizárólag döntéstámogató és kockázatkezelési eszköz.
Fő funkciók:
Automatikus Long / Short pozíció megjelenítés
Entry, Stop Loss és Take Profit szintek vizuális ábrázolása
Valós idejű pozícióméret számítás
Állítható Risk/Reward arány
Teljesen testreszabható színek, átlátszóság és vonalstílus
Letisztult chart label (irány, RR, lot méret)
Egyszerre csak egy aktív pozíció box
Pozícióméretezési logika:
A TradingView belsőleg egységekben (units) számol, nem bróker-specifikus LOT-okban.
Ennek kezelésére az LPS egy „Units per 1 Lot” beállítást használ.
Példák:
Forex standard lot: 100000
Arany (XAUUSD): 1 vagy 100 (brókertől függ)
Indexek (pl. NAS100): 1
Az indikátor először TradingView egységekben számol, majd ezt átváltja LOT-ra a megadott szorzó segítségével.
A kijelzett LOT méret 0.01-re van kerekítve.
Stop Loss logika:
A Stop Loss szint a kiválasztott korábbi gyertya high vagy low értékéből kerül meghatározásra.
Nagyobb bar-back érték:
távolabb helyezi a stopot
azonos kockázat mellett kisebb pozícióméretet eredményez
Ajánlott felhasználás:
Manuális, diszkrecionális kereskedés
Kockázatkezelés és pozícióméretezés
Trade tervezés
Oktatási célok
Fontos megjegyzések:
Az indikátor nem köt automatikusan
Alapértelmezetten nincs alert vagy automatizmus
A LOT és contract méret brókerenként eltérhet
Kereskedés előtt mindig ellenőrizd a pontos LOT / contract specifikációt a brókerednél
Loss

ATR or % Based Trailing Stop for Delta Exchange (trade_crush)This indicator calculates and visually displays a dynamic trailing stop line on the chart based on either the Average True Range (ATR) or a fixed percentage of the current close price. Designed especially for futures or crypto traders using Delta Exchange, it helps determine where to place trailing stop loss orders to manage risk effectively.

Stop Loss and TargetsEnter your purchase price, SL% and up to 3x TP%s. Automatically plots them on your chart to enable quicker set up of alerts.

Profit booking Indicatorell signal when RSI < 40, MACD crosses zero or signal line downward in negative zone, close below 50 EMA, candle bearish.
Strong sell signal confirmed on 5-minute higher timeframe with same conditions.
Square off half/full signals as defined.
Target lines drawn bold based on previous swing lows and extended as described.
Blue candle color when RSI below 30.
One sell and one full square off per cycle, blocking repeated sells until full square off.

% / ATR Buy, Target, Stop + Overlay & P/L% / ATR Buy, Target, Stop + Overlay & P/L
This tool combines volatility‑based and fixed‑percentage trade planning into a single, on‑chart overlay—with built‑in profit‑and‑loss estimates. Toggle between ATR or percentage modes, plot your Buy, Target and Stop levels, and see the dollar gain or loss for a specified position size—all in one interactive table and chart display.
NOTE: To activate plotted lines, price labels, P/L rows and table values, enter a Buy Price greater than zero.
What It Does
Mode Toggle: Choose between “ATR” (volatility‑based) or “%” (fixed‑percentage) calculations.
Buy Price Input: Manually enter your entry price.
ATR Mode:
Target = Buy + (ATR × Target Multiplier)
Stop = Buy − (ATR × Stop Multiplier)
Percentage Mode:
Target = Buy × (1 + Target % / 100)
Stop = Buy × (1 – Stop % / 100)
P/L Estimates: Specify a dollar amount to “invest” at your Buy price, and the script calculates:
Gain ($): Profit if Target is hit
Loss ($): Cost if Stop is hit
Visual Overlay: Draws horizontal lines for Buy, Target and Stop, with optional price labels on the chart scale.
Interactive Table: Displays Buy, Target, Stop, ATR/timeframe info (in ATR mode), percentages (in % mode), and P/L rows.
Customization Options
Line Settings:
Choose color, style (solid/dashed/dotted), and width for Buy, Target, Stop lines.
Extend lines rightward only or in both directions.
Table Settings:
Position the table (top/bottom × left/right).
Toggle individual rows: Buy Price; Target (multiplier or %); Stop (multiplier or %); Target ATR %; Stop ATR %; ATR Time Frame; ATR Value; Gain ($); Loss ($).
Customize text colors for each row and background transparency.
General Inputs:
ATR length and optional ATR timeframe override (e.g. use daily ATR on an intraday chart).
Target/Stop multipliers or percentages.
Dollar Amount for P/L calculations.
How to Use It for Trading
Plan Your Entry: Enter your intended Buy Price and position size (dollar amount).
Select Mode: Toggle between ATR or % mode depending on whether you prefer volatility‑based or fixed offsets.
Assess R:R and P/L: Instantly see your Target, Stop levels, and potential profit or loss in dollars.
Visual Reference: Lines and price labels update in real time as you tweak inputs—ideal for live trading, backtesting or trade journaling.
Ideal For
Traders who want both volatility‑based and percentage‑based exit options in one tool
Those who need on‑chart P/L estimates based on position size
Swing and intraday traders focused on objective, rule‑based trade management
Anyone who uses ATR for adaptive stops/targets or fixed percentages for simpler exits
NQ Position Size CalculatorNQ Position Size Line Calculator is designed specifically for Nasdaq 100 futures (NQ) and micro futures (MNQ) traders who want to maintain disciplined risk management. This visual tool eliminates the guesswork from position sizing by displaying distance lines and contract calculations directly on your chart.
The indicator creates horizontal lines at 10-tick intervals from your stop loss level, showing you exactly how many contracts to trade at each distance to maintain your predetermined risk amount. Whether you're trading regular NQ contracts or micro MNQ contracts, this calculator ensures you never risk more than intended while providing instant visual feedback for optimal position sizing decisions.
How to Use the Indicator
Step 1: Configure Your Settings
Stop Loss Price: Enter your exact stop loss level (e.g., 20000.00)
Risk Amount ($): Set your maximum dollar risk per trade (e.g., $500)
Contract Type: Choose between:
NQ (Regular): $5 per tick - for larger accounts
MNQ (Micro): $0.50 per tick - for smaller accounts or conservative sizing
Display Options:
Max Lines: Number of distance lines to show (default: 30)
Show Labels: Toggle tick distance and contract count labels
Line Color: Customize the color of distance lines
Label Size: Choose tiny, small, or normal label sizes
Step 2: Read the Visual Display
Once configured, the indicator displays:
Stop Loss Line:
Thick yellow line marking your exact stop loss level
Yellow label showing the stop loss price
Distance Lines:
Dashed red lines at 10-tick intervals above and below your stop loss
Lines appear on both sides for long and short position planning
Labels (if enabled):
Green labels (right side): For long positions above your stop loss
Red labels (left side): For short positions below your stop loss
Format: "20T 5x" means 20 ticks distance, 5 contracts maximum
Step 3: Use the Information Tables
The indicator provides two helpful tables:
Position Size Table (top-right):
Shows common tick distances (10, 20, 40, 80, 160 ticks)
Displays risk per contract at each distance
Contract count for your specified risk amount
Total risk with rounded contract numbers
Settings Table (bottom-right):
Confirms your current risk amount
Shows selected contract type
Displays current settings for quick reference
Step 4: Apply to Your Trading
For Long Positions:
Look at the green labels on the right side of your chart
Find your desired entry level
Read the label to see: distance in ticks and maximum contracts
Example: "30T 8x" = 30 ticks from stop, buy 8 contracts maximum
For Short Positions:
Look at the red labels on the left side of your chart
Find your desired entry level
Read the label for tick distance and contract count
Example: "40T 6x" = 40 ticks from stop, sell 6 contracts maximum
Step 5: Trading Execution
Before Entering a Trade:
Identify your stop loss level and input it into the indicator
Choose your entry point by looking at the distance lines
Note the contract count from the corresponding label
Verify the risk amount matches your trading plan
Execute your trade with the calculated position size
Risk Management Features:
Contract rounding: All position sizes are rounded down (never up) to ensure you don't exceed your risk limit
Zero position filtering: Lines only show where position size is at least 1 contract
Dual-sided display: Plan both long and short opportunities simultaneously

gain indicatorhe "Percentage Ruler" indicator is a custom technical analysis tool designed for the TradingView platform. Its primary function is to visually represent percentage-based price levels on a chart, relative to the closing price of the previous candle. This allows traders to quickly gauge potential support and resistance levels or to estimate possible price movements based on historical data.
Key features of the indicator include:
Dynamic Percentage Levels: The indicator automatically calculates and displays horizontal lines corresponding to predefined percentage levels, both positive and negative, ranging from -5% to +5%.
Previous Candle Close: The percentage calculations are anchored to the closing price of the previous candle, providing a consistent reference point for analysis.
Clear Visual Representation: The percentage levels are represented by horizontal lines extending to the right edge of the chart. The lines are color-coded (green for positive percentages, red for negative percentages) for easy interpretation.
Customizable Appearance: The indicator offers customization options, allowing users to adjust the line thickness and the display of percentage labels.
No Labels by Default: The indicator is designed to display only the horizontal lines by default, without any percentage labels, providing a clean and uncluttered chart view.
In summary, the "Percentage Ruler" indicator is a valuable tool for traders seeking a straightforward way to visualize percentage-based price levels relative to the previous candle's close. It aids in identifying potential support and resistance zones and estimating possible price movements based on historical data.

Liquidity VisualizerThe "Liquidity Visualizer" indicator is designed to help traders visualize potential areas of liquidity on a price chart. In trading, liquidity often accumulates around key levels where market participants have placed their stop orders or pending orders. These levels are commonly found at significant highs and lows, where traders tend to set their stop-losses or take-profit orders. The indicator aims to highlight these areas by drawing unbroken lines that extend indefinitely until breached by the price action.
Specifically, this indicator identifies and marks pivot highs and pivot lows, which are price levels where a trend changes direction. When a pivot high or pivot low is formed, it is represented on the chart with a horizontal line that continues to extend until the price touches or surpasses that level. The line remains in place as long as the level remains unbroken, which means there is potential liquidity still resting at that level.
The concept behind this indicator is that liquidity is likely to be resting at unbroken pivot points. These levels are areas where stop-loss orders or pending buy/sell orders may have accumulated, making them attractive zones for large market participants, such as institutions, to target. By visualizing these unbroken levels, traders can gain insight into where liquidity might be concentrated and where potential price reversals or significant movements could occur as liquidity is taken out.
The indicator helps traders make more informed decisions by showing them key price levels that may attract significant market activity. For instance, if a trader sees multiple unbroken pivot high lines above the current price, they might infer that there is a cluster of liquidity in that area, which could lead to a price spike as those levels are breached. Similarly, unbroken pivot lows may indicate areas where downside liquidity is concentrated.
In summary, this indicator acts as a "liquidity visualizer," providing traders with a clear, visual representation of potential liquidity resting at significant pivot points. This information can be valuable for understanding where price might be drawn to, and where large movements might occur as liquidity is targeted and removed by market participants.

Trailing Stop ProTrailing Stop Pro is a sophisticated TradingView indicator designed to enhance your trading strategy by dynamically managing trailing stops based on market volatility. This tool leverages the Average True Range (ATR) to adjust stop levels, providing traders with a robust mechanism to protect profits and minimize losses.
Key Features:
Dynamic Trailing Stops: Automatically adjusts stop levels using ATR, allowing for responsive and adaptive risk management.
Customizable Inputs: Tailor the indicator to your trading style with adjustable parameters such as ATR Length, ATR Multiplier, and Source Vector.
Visual Clarity: Distinct color settings for long and short stops, with adjustable line thickness and transparency, ensuring clear visualization on your charts.
Professional Grade: The "Pro" designation signifies advanced features suitable for both novice and experienced traders seeking reliable and efficient stop management.
How It Works:
To set up the indicator, begin by defining the Chrono Point, which specifies the exact time you want the trailing stop mechanism to activate. This allows for precise control over when your stops begin to trail. Next, set the Credit Unit as the initial entry price for your trade, serving as the baseline from which the trailing stops will adjust.
The indicator uses ATR-based adjustments to determine stop levels. Customize the sensitivity of the trailing stop by adjusting the ATR Length (default is 14) and ATR Multiplier (default is 0.5). A longer ATR length smooths out volatility, while a higher multiplier increases the distance of the stop from the price.
Select your Source Vector from "High/Low," "Close," or "Open" prices as the basis for stop calculation. This flexibility allows you to align the indicator with your preferred trading strategy. The indicator plots trailing stops directly on the chart, with color-coded lines indicating long (teal) and short (red) positions. You can adjust the line thickness and transparency for optimal visibility.
The Mission Status feature automatically detects whether the trade is long or short and adjusts the trailing stop accordingly. If the price hits the trailing stop, the trade is considered exited, and the indicator calculates the profit or loss percentage.
Benefits:
Risk Management: Protect your trades from adverse market movements while locking in profits as prices move favorably.
Automation: Reduce manual intervention with automatic stop adjustments, allowing you to focus on strategic decision-making.
User-Friendly Interface: Intuitive settings and clear visual cues make it easy to integrate into your existing trading workflow.
Conclusion:
Trailing Stop Pro is an essential tool for traders looking to enhance their risk management strategies with precision and ease. By automating the trailing stop process and providing clear visual feedback, this indicator empowers you to navigate the markets with confidence. Whether you're a seasoned trader or just starting, Trailing Stop Pro offers the functionality and flexibility needed to optimize your trading performance.
The Trailing Stop Pro indicator is a tool designed to assist traders in managing risk and optimizing their trading strategies. However, it should not be considered as financial advice or a guarantee of profitability. Trading involves significant risk, and it is possible to lose more than your initial investment. Users are encouraged to thoroughly test the indicator in a demo environment and consider their own financial situation and risk tolerance before using it in live trading. Past performance is not indicative of future results, and users should seek advice from a qualified financial advisor if needed.

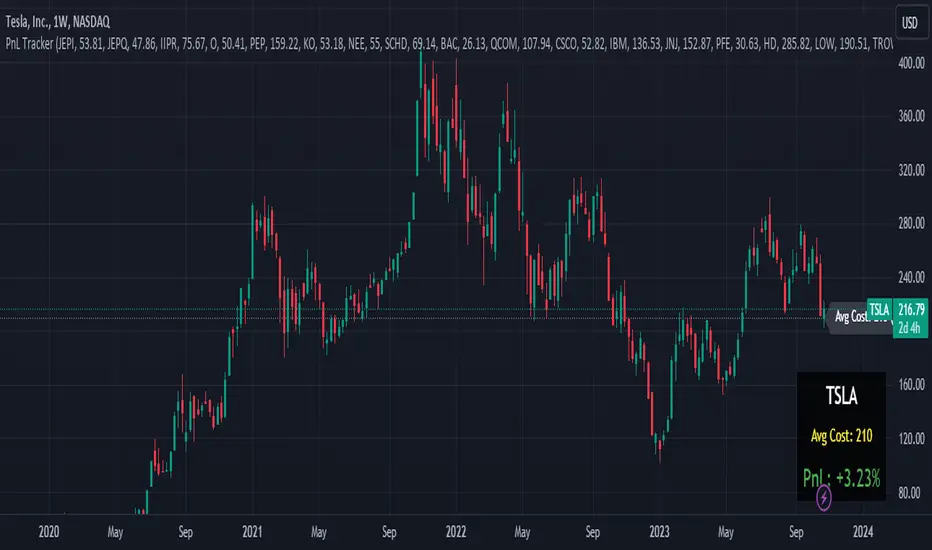
Portfolio PnL Tracker
This is a personal portfolio tracker that helps you track your daily profits and losses. You can track up to 64 stocks or cryptocurrencies. You can set them by specifying the symbol and average price.
FEATURES
- Set up to 64 stock or crypto symbols.
- Shows the average price line
- Show profit or loss as a percentage
- Shows only when on the chart that matches the symbol settings.
HOW TO USE
1. Double click the PnL Tracker indicator at the top left of the chart
2. Enter your symbol and average cost
The average cost line shows your current position.
PnL is calculated based on the average cost you input.
The Profit and Loss (PnL) box and the average cost line will only be displayed when your input symbol matches the chart you are currently viewing.
Realized Profit & Loss [BigBeluga]The Realized Loss & Profit indicator aims to find potential dips and tops in price by utilizing the security function syminfo.basecurrency + "_LOSSESADDRESSES".
The primary objective of this indicator is to present an average, favorable buying/selling opportunity based on the number of people currently in profit or loss.
The script takes into consideration the syminfo.basecurrency, so it should automatically adapt to the current coin.
🔶 USAGE
Users have the option to enable the display of either Loss or Profit, depending on their preferred visualization.
Examples of displaying Losses:
Example of displaying Profits:
🔶 CONCEPTS
The concept aims to assign a score to the data in the ticker representing the realized losses. This score will provide users with an average of buying/selling points that are better to the typical investor.
🔶 SETTINGS
Users have complete control over the script settings.
🔹 Calculation
• Profit: Display people in profit on an average of the selected length.
• Loss: Display people in loss on an average of the selected length.
🔹 Candle coloring
• True: Color the candle when data is above the threshold.
• False: Do not color the candle.
🔹 Levels
- Set the level of a specific threshold.
• Low: Low losses (green).
• Normal: Low normal (yellow).
• Medium: Low medium (orange).
• High: Low high (red).
🔹 Z-score Length: Length of the z-score moving window.
🔹 Threshold: Filter out non-significant values.
🔹 Histogram width: Width of the histogram.
🔹 Colors: Modify the colors of the displayed data.
🔶 LIMITATIONS
• Since the ticker from which we obtain data works only on the daily timeframe, we are
restricted to displaying data solely from the 1D timeframe.
• If the coin does not have any realized loss data, we can't use this script.

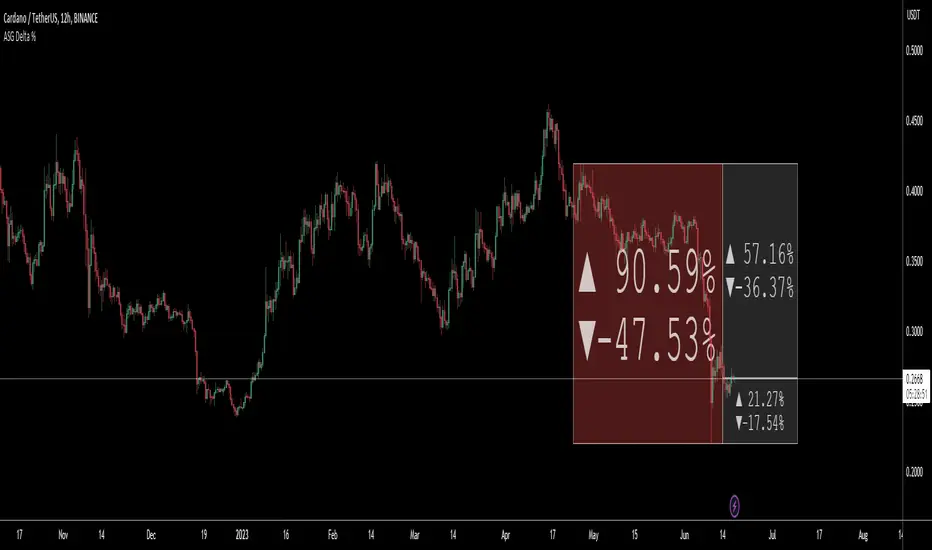
ASG Delta %This utility script provides a convenient way to calculate the percentage gain or drop of a token's price within a user-defined date range. It eliminates the need for manual measurement on individual charts, saving time and effort.
The script is particularly valuable when integrated into a daily token scanning routine for watchlists. By comparing the significant gains or drops among different tokens, traders can identify potential trading opportunities.
Simply select the desired date range, and the script will identify the highest and lowest price points achieved during that period. It then shows a visual representation in the form of a bullish or bearish box, displaying the percentage change (delta %). If the current price falls within the box's upper and lower bounds, additional percentage information can be shown in either the 'normal' or 'reverse' mode.
For instance, if a token experiences a -52.35% drop, enabling the 'Reverse' setting will reveal a potential 109.86% gain (from the low), or a 76.02% gain (from current price) or a potential drop of -16.5% (from current price) etc.. Having these basic statistics available, without having to manually chart them, especially during prolonged bear or bull markets, enables traders to make informed decisions and position themselves for more profitable trades.
I hope you find this script valuable. Your comments and recommendations are welcome as they will help improve the script's functionality further.
Manual PnL (Profit and Loss) % Tracker - spot long only
This is a manual profit and loss tracker. It takes the user's manual input of total cost and quantity, and then outputs a table on the bottom right of the chart showing the profit or loss %, average purchase price, gross profit or loss, and market value.
Instructions:
1. Double click the indicator title at the top left of the chart
2. Select the "Inputs" tab and click the empty field next to "Symbol" to enter the traded symbol+exchange. This entry MUST be the same as the chart you are on, for example BTCUSDT/BINANCE (indicator will not display otherwise)
3. Enter the Total Cost and Qty of shares/coins owned
4. Optional - change positive or negative colors
5. Optional - under the "Style" tab, change the color of the average price (AVG) line
Note that for the average price (AVG) line to be shown/hidden you must enable/disable "Indicator and financials labels" in the scales settings.
For crypto or other tickers that have prices in many decimal places I would suggest, for the sake of accuracy, adjusting the decimal places in the code so that for prices under $1 you will display more info.
For example let's say you purchase x number of crypto at a price of 0.031558 you should change the code displaying "0.00" on line 44 to "0.000000"
This will ensure that the output table and plotted line will calculate an average price with the same number of decimals.

Average Cost (Costo Promedio)ENGLISH
This 'Average Cost' script allows the user to input and visualize profit or loss for different stocks (up to 50) with average cost and quantity data on a single chart. This is useful for tracking the profit or loss of each stock in real-time.
To use this script, the user should follow these steps:
1. Add the 'Average Cost' script to your TradingView chart.
2. In the script's configuration window, input the tickers, average costs, and quantity of shares for each ticker you want to monitor.
3. Click 'Accept' to apply the changes.
This script is primarily designed for stock markets, but can also be useful in other financial markets where the user is interested in tracking the performance of multiple assets.
ESPAÑOL
Este script de "Costo Promedio" permite al usuario ingresar y visualizar si hay ganancia o perdida para diferentes acciones (hasta 50) con los datos de costos promedio y cantidad de acciones en un solo gráfico. Esto es útil para realizar un seguimiento de la ganancia o pérdida de cada acción en tiempo real.
Para utilizar este script, el usuario debe seguir estos pasos:
1. Agregue el script "Costo Promedio" a su gráfico en TradingView.
2. En la ventana de configuración del script, ingrese los tickers, costos promedio y cantidad de acciones para cada ticker que desee monitorear.
3. Haga clic en "Aceptar" para aplicar los cambios.
Este script está diseñado principalmente para los mercados de acciones, pero también puede ser útil en otros mercados financieros donde el usuario esté interesado en rastrear el rendimiento de múltiples activos.

Live PnL v1.0Live P&L for multiple stocks, currencies, crypto and commodities can now be tracked for your favorite scripts, pair trading etc.
This indicator gives provision to add up to 3 stocks/futures/currency with Buy and Sell, Quantity (can be lot size or any other) and Entry Price and set as default so that every time you put back this indicator you can monitor the live Profit / Loss figure.
This indicator will help trade to evaluate and track tips/trades of experts on social media and Media platforms and check their accuracy themselves in an organized way.
Apart from paper trading a trade or multiple positions ones combined together it also gives a feeler of combined Mark to live Market Drawdowns or Profitability.

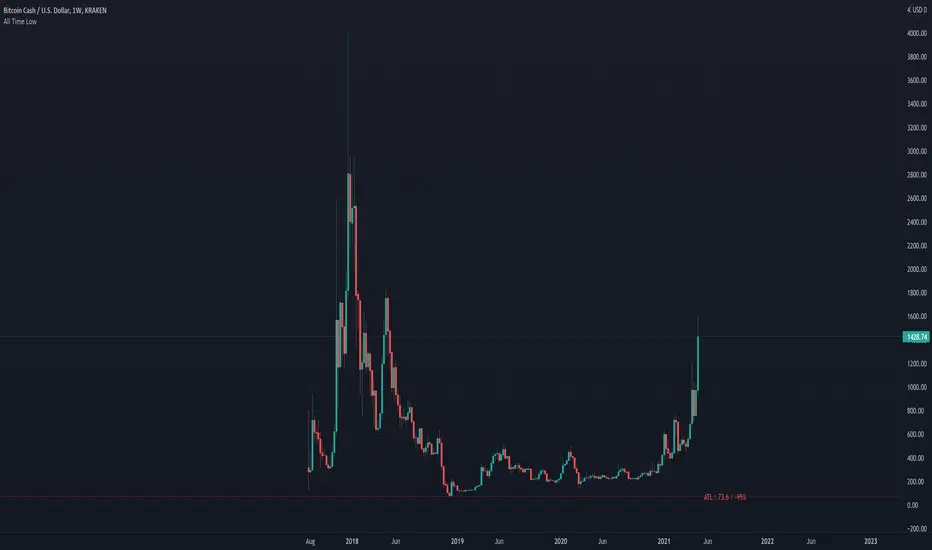
All Time LowThis script is to remind you of how much you would lose if the price went down to the all time low.
This will make you think twice about your purchases!
Position Sizing CalculatorThis is an intuitive risk management tool with a minimalist design.
This calculator will determine your position size per trade, profit, loss, risk/reward ratio and leverage if any.
It will calculate your leverage if you are trading financial instruments e.g. Mini Futures , Turbo Warrants etc. that have a financing level.
Tip: Use this as a complement to the Long/Short Position tool.
Provide the following inputs to get a calculation:
- Position type
- Account balance
- Risk per trade percentage
- Financing level (if any for leveraged instruments), else let it be 0
- Entry price
- Target price
- Stopp loss price
You can also choose the color of the output text, its background and position in the chart window.
Enjoy!

Trailing Stop AlertsThis script is designed as an ATR-based trailing stop tool to assist in managing open positions.
Once you're involved in a profitable trade, if you add this script to your chart you'll be prompted to select a bar to begin trailing from.
You can then adjust the candle lookback distance for swing high/lows (7 by default), the ATR multiplier (1.0 by default), and the direction to trail (Long/Short).
You can also adjust the ATR period in the settings menu if you want to (14 period by default).
Once the script is added to your chart, it will begin drawing your trailing stop and you can then set up alerts.
Alert Options:
Any alert() function call : Will trigger an alert for both conditions (trailing stop updated, trailing stop hit)
Alert Conditions : Trailing Stop Update will trigger whenever the stop is updated, Trailing Stop Hit will trigger whenever the stop is hit.
Note: the alerts will only fire once per bar close and the trailing stop will not update on realtime bars.

Gain/StopLoss Percentage LinesGain/StopLoss Percentage Lines is a quick way to enter your Entry Price in to a stock and track the percentage of gain or loss at the 5% and 10% markers.
Click on the gear settings icon and type in your entry price. The percentage is defaulted to 5%. You can change this to a different percentage at this screen. Note that whatever number you enter will be doubled for the upper and lower lines. For instance, if you want to set your first red line stop loss and green gain line at 2.5%, your two other upper and lower green and red lines will be at 5%.
However, this will not change the text on the tab marker.
To change the tab text, go in to the Pine Editor and change the green text that says "5% Gain" and "5% Loss" to your new percentages.

ATR Stop Loss FinderThis Indicator uses Average True Range (ATR) to determine a safe place to put stop losses to avoid being stop hunted or stopped out of a trade due to a tight stop loss. Default multiplier setting is 1.5. For a more conservative stop loss use 2 and for a tighter stop loss use 1. ATR and stop loss prices are displayed in table at bottom of screen. Use high(red) for shorts and low(teal) for longs.

SL Hunter Tracker SL Hunter Tracker
coded by Bogdan Vaida
SL Hunter Tracker is a meticulous hunter that tracks SL hunters.
First it plots the fractals on the chart, then it draws lines from them
to the last wick that touched that height. You can add sweep alerts, once
per bar close, so that you get notified when a wick was touched.
Tested on: EURUSD 30'
Artharjan Profit & Loss CalculatorHi,
Artharjan Profit and Loss Calculator allows users to calculate Profit and Loss of their trades and see it on the chart itself
Users are supposed to select either Long or Short, Enter quantity and enter traded price. The live P&L will be plotted on the chart.
Happy trading :-)
Rahul
