Moving Avg on all timeframes w/ full controlThis indicator is a multi-moving-average overlay built for intraday traders who want daily context + intraday timing on the same chart. It’s designed to work cleanly on common intraday timeframes like 5-minute, 10-minute, and 65-minute, while still letting you reference your key daily trend levels.
Key ideas
Daily trend context on intraday charts: You can plot moving averages that represent your daily structure (ex: 10/20/50/200) while trading intraday.
Intraday “day-equivalent” moving averages: If you like the Brian Shannon style approach, you can use intraday period equivalents (ex: on 5-min, 5D ≈ 390, 10D ≈ 780, 20D ≈ 1560) so you can “feel” multi-day trend/slope directly on lower timeframes.
Sessions awareness (Premarket + RTH)
Includes session inputs so you can define Premarket (1) and RTH (M) windows.
This helps keep your chart behavior consistent with how you trade (especially if you care about RTH structure vs extended hours).
Each MA slot typically includes:
On/Off toggle (so you can declutter instantly)
Length (any period you want: daily-style or intraday equivalents)
MA type selection (ex: SMA/EMA style options)
Visual controls like line width / style (so your key MA stands out)
Why this is useful
On higher intraday frames (like 65-min) you can track the “intermediate trend” cleanly.
On lower intraday frames (5-min / 10-min) you can time entries/exits while still respecting the bigger MA bias.
Moving Averages

Gold Scalping MACD ProGold Scalping MACD Pro is a custom-built technical indicator specifically optimized for gold (XAUUSD) scalping. It is based on an advanced adaptation of the classic MACD (Moving Average Convergence Divergence) concept, enhanced to provide faster, clearer, and more reliable signals in highly volatile gold markets.
🔹 Core Purpose
The indicator is designed to:
Capture short-term momentum shifts
Reduce market noise
Improve entry and exit timing during fast price movements
This makes it particularly effective for intraday and scalping strategies.
🔹 Key Features
Enhanced MACD-based momentum calculation for higher sensitivity
Early buy and sell signals during strong momentum phases
Noise filtering to reduce false signals in sideways markets
Optimized for gold’s volatility characteristics
Best performance on lower timeframes (M1, M5, M15)
🔹 How It Works
Gold Scalping MACD Pro analyzes the relationship between fast and slow moving averages, combined with momentum smoothing techniques.
By focusing on momentum strength rather than lagging confirmation, the indicator helps traders:
Identify high-probability scalping opportunities
Confirm short-term trend direction
Avoid weak or low-momentum setups
🔹 Best Use
Gold (XAUUSD) scalping
Momentum-based trading strategies
Trend confirmation on lower timeframes
Used alongside price action, support & resistance, or session timing
⚠️ Risk Disclaimer
Gold Scalping MACD Pro is a technical analysis tool and does not provide trading advice. Trading leveraged instruments such as gold involves significant risk. Proper risk management and confirmation from other analysis methods are strongly recommended.

EMA and Dow Theory Strategies V2📘 Overview
This strategy is an advanced evolution of the original EMA × Dow Theory hybrid model. V2 introduces true swing‑based trend detection, gradient trend‑zones, higher‑timeframe swing overlays, and dynamic exit logic designed for intraday to short‑term trading across crypto, forex, stocks, and indices.
The system provides precise entries, adaptive exits, and highly visual guidance that helps traders understand trend structure at a glance.
🧠 Key Features
🔹 1. Dual‑EMA Trend Logic (Symbol + External Index)
Both the chart symbol and an external index (OTHERS.D) are evaluated using fast/slow EMAs to determine correlation‑based trend bias.
🔹 2. Dow Theory Swing Detection (Real‑time)
The script identifies swing highs/lows and updates trend direction when price breaks them. This creates a structural trend model that reacts faster than EMAs alone.
🔹 3. Gradient Trend Zones (Visual Trend Strength)
When trend is up or down, the area between price and the latest swing level is filled with a multi‑step gradient. This makes trend strength and distance-to-structure visually intuitive.
🔹 4. Higher‑Timeframe Swing Trend (htfTrend)
Swing highs/lows from a higher timeframe (e.g., 4H) are plotted to show macro structure. Used only for visual context, not for filtering entries.
🔹 5. RSI‑Based Entry Protection
RSI prevents entries during extreme overbought/oversold conditions.
🔹 6. Dynamic Exit System
Includes:
Custom stop‑loss (%)
Partial take‑profit (TP1/TP2/TP3)
Automatic scale‑out when trend color weakens
“Color‑change lockout” to prevent immediate re‑entry
Real‑time PnL tracking and labels
🔹 7. Alerts for All Key Events
Entry, stop‑loss, partial exits, and trend‑change exits all generate structured JSON alerts.
🔹 8. Visual PnL Labels & Equity Tracking
PnL for the latest trade is displayed directly on the chart, including scale‑out adjustments.
⚙️ Input Parameters
Parameter Description
Fast EMA / Slow EMA EMAs used for symbol trend detection
Index Fast / Slow EMA EMAs applied to external index
StopLoss (%) Custom stop‑loss threshold
Scale‑Out % Portion to exit when trend color weakens
RSI Period / Levels Overbought/oversold filters
Swing Detection Length Bars used to detect swing highs/lows
Stats Display Position of statistics table
🧭 About htfTrend (Higher Timeframe Trend)
The higher‑timeframe swing trend is displayed visually but not used for entry logic.
Why? Strict HTF filtering reduces trade frequency and often removes profitable setups. By keeping it visual‑only, traders retain flexibility while still benefiting from macro structure awareness.
Use it as a contextual guide, not a constraint.
📘 概要
本ストラテジーは、V1 を大幅に拡張した EMA × ダウ理論 × スイング構造 × 上位足トレンド可視化 の複合型モデルです。 短期〜デイトレード向けに最適化されており、仮想通貨・FX・株式・指数など幅広いアセットで利用できます。
V2 では、スイング構造の自動検出、グラデーションによるトレンド強度の可視化、上位足スイングライン、動的な利確/損切りロジック が追加され、視覚的にもロジック的にも大幅に強化されています。
🧠 主な機能
🔹 1. 銘柄+外部インデックスの EMA クロス判定
対象銘柄と OTHERS.D の EMA を比較し、相関を考慮したトレンド方向を判定します。
🔹 2. ダウ理論に基づくスイング高値・安値の自動検出
スイング更新によりトレンド方向を切り替える、構造ベースのトレンド判定を採用。
🔹 3. グラデーション背景によるトレンド強度の可視化
スイングラインから現在価格までを段階的に塗り分け、 「どれだけトレンドが伸びているか」を直感的に把握できます。
🔹 4. 上位足スイングトレンド(htfTrend)の表示
4H などの上位足でのスイング高値・安値を表示し、 大局的なトレンド構造を視覚的に把握できます(ロジックには未使用)。
🔹 5. RSI による過熱・売られすぎフィルター
極端な RSI 状態でのエントリーを防止。
🔹 6. 動的イグジットシステム
カスタム損切り(%)
TP1/TP2/TP3 の段階的利確
トレンド色の弱まりによる自動スケールアウト
色変化後の再エントリー制限(waitForColorChange)
リアルタイム PnL の追跡とラベル表示
🔹 7. アラート完備(JSON 形式)
エントリー、損切り、部分利確、トレンド反転などすべてに対応。
🔹 8. 損益ラベル・統計表示
直近トレードの損益をチャート上に表示し、視覚的に把握できます。
⚙️ 設定項目
設定項目名 説明
Fast / Slow EMA 銘柄の EMA 設定
Index Fast / Slow EMA 外部インデックスの EMA 設定
損切り(%) カスタム損切りライン
部分利確割合 トレンド弱化時のスケールアウト割合
RSI 期間・水準 過熱/売られすぎフィルター
スイング検出期間 スイング高値・安値の検出に使用
統計表示位置 テーブルの表示位置
🧭 上位足トレンド(htfTrend)について
上位足スイングの更新に基づくトレンド判定を表示しますが、 エントリー条件には使用していません。
理由: 上位足を厳密にロジックへ組み込むと、トレード機会が大幅に減るためです。
本ストラテジーでは、 「大局の把握は視覚で、エントリーは柔軟に」 という設計思想を採用しています。
→ 裁量で利確判断や逆張り回避に活用できます。

Daily SMA 10/20/50/200 (Timeframe Agnostic)This indicator plots the 10, 20, 50, and 200-period Simple Moving Averages calculated on a user-selected base timeframe (default: Daily), then displays them on any chart timeframe (intraday, daily, weekly, monthly). Each SMA has independent controls for visibility, color, and line thickness.

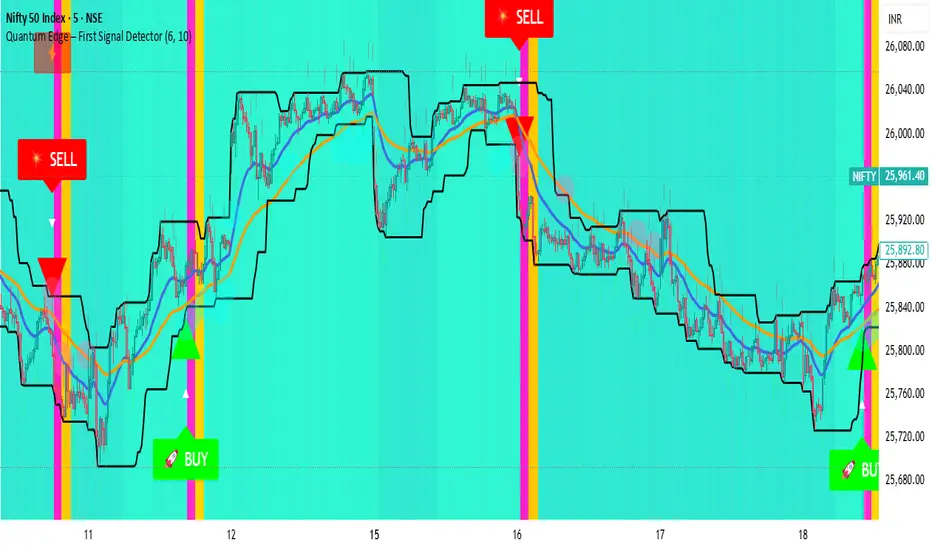
Quantum Edge First Signal DetectorQuantum Edge is a non-repainting, multi-confirmation indicator that detects the first high-probability BUY & SELL signals using momentum, trend, volume, volatility, and price-action voting logic.
🧠 About This Indicator
Quantum Edge – First Signal Detector is designed to solve one common trader problem:
too many late or repeated signals.
Instead of firing continuous entries, this indicator focuses only on the FIRST valid signal after a market shift — helping traders enter early, reduce noise, and avoid over-trading.
It uses a quantum-style voting engine where multiple independent market factors must align before a signal is confirmed.
⚙️ Core Logic (How It Works)
Each candle is evaluated using 6 independent factors:
RSI Momentum
Bullish when RSI > 50
Bearish when RSI < 40
Price Location
Price near recent highs or lows
Volume Expansion
Current volume above moving average
EMA Trend Direction
EMA 20 vs EMA 50
Candle Strength
Strong bullish or bearish candle bodies
Volatility Filter
ATR-based low volatility confirmation
Each factor gives 1 vote.
When minimum confirmations are met, a FIRST BUY or FIRST SELL signal is generated.
🚀 Key Features
✅ First-Signal-Only Logic
Only the first BUY or SELL after trend change
No repeated signals in the same direction
Built-in signal cooldown (user-controlled)
✅ Non-Repainting
Signals are confirmed on candle close
No future data, no repainting
✅ Smart Trend Filtering
EMA-based directional bias
Avoids weak counter-trend entries
✅ Advanced Visual System
Clear BUY / SELL triangles
Trend, volume & momentum backgrounds
Support & resistance zones
Market sentiment bar coloring
✅ Alert Support
Buy alert
Sell alert
📊 Best Timeframes
Scalping: 1m – 5m
Intraday: 5m – 15m
Swing Confirmation: 30m – 1H
Works on:
Forex
Crypto
Indices
Stocks
🎯 How to Trade (Simple Guide)
BUY Setup
✔ First BUY signal appears
✔ Trend is bullish
✔ Use nearby support as reference
SELL Setup
✔ First SELL signal appears
✔ Trend is bearish
✔ Use nearby resistance as reference
Always combine with risk management.
Disclaimer: This indicator is for educational purposes only and does not constitute financial advice. Trading involves risk. Use proper risk management.

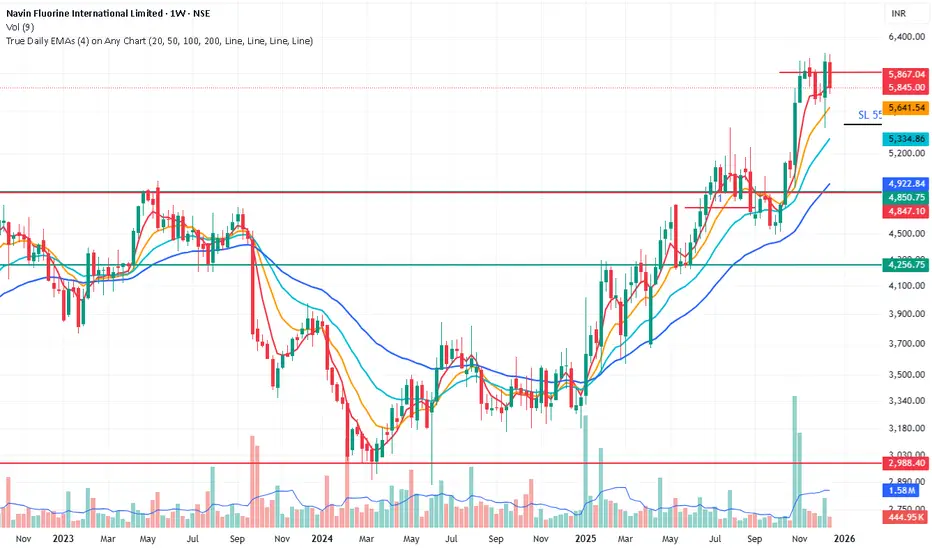
True Daily EMAs (4) on Any ChartIt calculated the 4 EMAs based on days as input. Even on a weekly or monthly chart it shows 20/50/100/200 Day EMAs. Changing the time frame of chart does not effect the EMAs
ATR Distance from 50 SMA By DanBobDanA simple indicator that measures the distance between current price and the 50 SMA
The average momentum swing trade might run 7 times the ATR before pulling back
Therefore, its recommended to not buy a stock that is beyond 4 times its ATR to the 50 SMA
This script will quickly and easily calculate the 50 SMA to ATR distance for you

Beast Mode - Hull Suite ProBeast Mode – Hull Suite Pro is a trend-following overlay indicator built around a dual “Hull ribbon” concept: a fast ribbon for swing/entry timing and an optional slow ribbon for higher-timeframe style trend context. It aims to make trend direction, trend changes, and lower-quality (choppy/ranging) conditions easy to see directly on price.
---
Core concept (what it does)
1) Fast Signal Ribbon (primary direction + flips)
The indicator computes a fast Hull-style moving average using your selected Hull variation and length. It then plots two lines:
- Fast Main = current fast Hull value
- Fast Lag = prior-bar fast Hull value
The space between them is filled to form a ribbon. When Fast Main is above Fast Lag, the ribbon is considered bullish and plotted green. When Fast Main is below Fast Lag, it is considered bearish and plotted red. This creates a simple, visual “slope/continuation” read without needing extra panels.
2) Slow Trend Ribbon (optional trend filter / bias)
A second, slower Hull-style ribbon (default length is user-configurable) can be plotted as a trend context layer. Like the fast ribbon, it uses a main line and its prior-bar value to determine direction. When enabled, it provides a higher-level bias that can be used to filter signals from the fast ribbon.
3) Chop Filter (optional ranging-market filter)
The script includes an optional Choppiness Index filter. When enabled, it blocks buy/sell labels during choppy conditions where trend-following signals often degrade. “Choppy” is defined as Choppiness Index above the user threshold.
4) Visual helpers (optional)
- Candle coloring can be enabled to match the fast ribbon direction.
- A compact dashboard table can be shown on the chart to summarize the current fast trend, slow trend, and whether filters are enabled.
---
How it works (calculation overview)
Hull variations
The indicator lets you choose one of three smoothing/response styles for both the fast ribbon and the slow ribbon:
- Hma: Hull Moving Average
- Ehma: EMA-based Hull variant
- Thma: Triangular/WMA-based Hull variant
A “Length Multiplier” scales the fast length to quickly tune sensitivity without changing your base length.
Preset system
A preset selector automatically adjusts the fast length and Hull variation for common use-cases:
- Fast: shorter length, more responsive (more signals, more noise)
- Balanced: middle ground
- Trend: longer and smoother (fewer signals)
Selecting “Custom” uses your manual inputs.
Fast ribbon direction state
- fastUp is true when the fast Hull value is higher than its previous value (Fast Main > Fast Lag).
- Color and candle coloring (if enabled) follow this state.
Slow ribbon direction state
- slowUp is true when the slow Hull value is higher than its previous value (Trend Main > Trend Lag).
- The slow ribbon is optional and can be hidden.
Choppiness Index
When enabled, the script computes the Choppiness Index over the chosen length and flags the market as choppy if it exceeds the threshold. Signals can be blocked during these flagged periods.
---
Signals (how buy/sell labels are generated)
Buy label (raw):
A Buy is triggered when the fast ribbon flips from bearish to bullish (fastUp becomes true after being false on the prior bar).
Sell label (raw):
A Sell is triggered when the fast ribbon flips from bullish to bearish (fastUp becomes false after being true on the prior bar).
Optional filters:
- Trend Filter (optional):
- If enabled, Buy labels only appear when the slow ribbon is bullish (slowUp = true).
- Sell labels only appear when the slow ribbon is bearish (slowUp = false).
- Chop Filter (optional):
- If enabled, both Buy and Sell labels are suppressed when the market is flagged as choppy (Choppiness Index > threshold).
These filters are designed to reduce low-quality flips in sideways markets and align signals with the broader trend context when desired.
---
How to use it (practical guidance)
1) Trend direction / bias
- Use the fast ribbon color and slope as your near-term trend read.
- If enabled, use the slow ribbon as a higher-level bias filter (e.g., focus on longs when the slow ribbon is green).
2) Entries and timing
- Buy/Sell labels are based on fast ribbon flips. Many traders treat flips as potential momentum shifts rather than guaranteed reversals. Consider confirming with your own market context (structure, levels, volume, session, etc.).
3) Avoiding chop (optional)
- If you trade trend continuation, enabling the Chop Filter can help avoid frequent flips during consolidation.
- Lower chop thresholds are stricter (fewer signals). Higher thresholds allow more signals through.
4) Parameter tuning
- Faster settings will react earlier but can whipsaw.
- Smoother settings reduce noise but can lag.
- The Length Multiplier is a quick way to adjust sensitivity without redesigning the setup.
---
Visual settings
- Show Buy/Sell Labels: toggles label plotting.
- Color Candles: colors bars based on the fast ribbon direction.
- Line Thickness / Fill Transparency: adjust readability.
- Dashboard: shows a small table with current states and filter status. Position is user-selectable.
---
Limitations / notes
- This indicator is not a strategy and does not provide backtest performance results.
- Like all moving-average-based tools, it is lagging by nature and can produce false flips in ranging conditions.
- The Chop Filter helps reduce ranging-market noise but will also filter out some early trend transitions.
- Signals are conditional visual markers and should be used with risk management and confirmation rules appropriate to your trading plan.

EAB: Distance (%) to EMAs/MAsRPL: Distance (%) to EMAs/MAs displays a compact table showing the percentage distance between the current price and selected moving averages, helping to quickly assess price extension relative to key technical references.
Features
• Distance to EMA 10, EMA 20, MA 50 and MA 200 (individually toggleable).
• Up to two custom moving averages , with selectable EMA or MA type and configurable period.
• Customizable colors, opacity, text size and vertical offset to fit the table cleanly on the chart.
How to use
1. Enable or disable moving averages from the “Show” section.
2. To add another average, enable “Custom Moving Average 1/2” and define its type and period.
3. Adjust the visual style from the “Table” section (colors, opacity, size and position).
Notes
• Distance is calculated as: (Close − Moving Average) / Moving Average × 100 .
• Informational indicator only; no entry or exit signals are provided .

Mawhoob (TD - Trend Direction) - v1.1Mawhoob (Trend Direction - TD) Indicator v1.1
Professional Trend Analysis & Market Context Dashboard
----------------------------------------------------
🎯 Overview
----------------------------------------------------
Mawhoob (Trend Direction - TD) is a comprehensive, professional-grade technical analysis tool designed to provide traders with multi-dimensional market insights. This advanced indicator combines a proprietary adaptive trend line with real-time market context data, offering a complete market analysis solution in one elegant package.
✨ Key Features ✨
----------------------------------------------------
📈 Trend Direction Line (TD Line)
----------------------------------------------------
Intelligent Moving Average System: Utilizes a sophisticated blend of EMA, RMA, and WMA with smart adaptive error correction.
1- Dynamic Color Coding:
🟢 Green: Bullish trend (price momentum upward).
🔴 Red: Bearish trend (price momentum downward).
2- Customizable Parameters:
Main Period (1-200): Control long-term vs. short-term sensitivity.
Fast Period (0-50): Fine-tune responsiveness to price changes.
Weighting Factor (0-3): Adjust current price influence on the trend line.
3- Visual Bands: Optional upper and lower bands that create a dynamic channel around the trend line.
----------------------------------------------------
📊 Real-Time Market Dashboard
----------------------------------------------------
A comprehensive information panel displaying multiple technical indicators and market dominance metrics.
Technical Indicators Section:
1- RSI (Relative Strength Index)
Current value with color-coded momentum indication.
Direction status: UP / DOWN / NEUTRAL.
Customizable overbought/oversold levels.
Includes RSI SMA for trend confirmation.
2- MACD (Moving Average Convergence Divergence)
Real-time MACD line value.
Trend direction based on MACD vs. Signal line relationship.
Fully customizable fast, slow, and signal periods.
3- ADX (Average Directional Index)
Trend strength measurement.
Color-coded display: Strong vs. Weak trend.
Adjustable strength threshold.
Market Dominance Section:
1- DXY (US Dollar Index)
Real-time dollar strength tracking.
Direction indicator for forex correlation analysis.
2- BTC.D (Bitcoin Dominance)
Bitcoin market dominance percentage.
Useful for crypto market sentiment analysis.
3- USDT.D (Tether Dominance)
Stablecoin dominance tracking.
Risk-on/risk-off market indicator.
All dominance metrics feature:
Customizable timeframe selection.
UP/DOWN/NEUTRAL directional indicators.
Color-coded values for quick visual assessment.
----------------------------------------------------
🔔 Alert & Signal System
----------------------------------------------------
Price Crossover Alerts: Get notified when price crosses above or below the TD line.
Smart Alert Logic: Filters out neutral/flat market conditions to reduce noise.
Visual Signals: Optional triangle markers on chart (▲ bullish, ▼ bearish).
Once-Per-Bar Frequency: Prevents alert spam while ensuring you don't miss opportunities.
----------------------------------------------------
🎨 Visual Customization
----------------------------------------------------
Candle Color Mode: Option to color candles based on trend direction.
Dashboard Positioning: Choose LEFT, RIGHT, or CENTER placement.
Text Size Options: TINY, SMALL, NORMAL, or LARGE for optimal readability.
Customizable colors for Bullish/Bearish trend lines.
Customizable colors for dashboard backgrounds and borders.
Customizable colors for UP/DOWN/NEUTRAL status indicators.
----------------------------------------------------
📚 Use Cases
----------------------------------------------------
For Day Traders
Quick trend identification with color-coded TD line.
Real-time momentum gauges (RSI, MACD).
Instant crossover alerts for entry/exit timing.
For Swing Traders
Medium-term trend direction with adjustable periods.
ADX strength indicator for high-probability setups.
Market dominance context for broader market analysis.
For Crypto Traders
BTC.D and USDT.D tracking for altcoin season detection.
Integrated multi-indicator analysis.
Customizable timeframes for dominance metrics.
For Multi-Market Analysis
DXY correlation for forex and commodities.
Comprehensive dashboard for quick market scans.
Cross-market sentiment analysis.
----------------------------------------------------
⚙️ Settings & Customization
----------------------------------------------------
Trend Direction Settings
Main TD Period: Adjust overall trend sensitivity.
Fast TD Period: Control responsiveness (0 = no smoothing).
Weighting Factor: Balance between historical and current prices.
Line width and colors for visual preference.
Optional trend bands with adjustable transparency.
Dashboard Settings
Toggle individual indicators on/off.
Customize all indicator periods and thresholds.
Choose timeframe for dominance indices.
Adjust colors, position, size, and borders.
Complete visual control for your trading style.
Alert & Signal Settings
Enable/disable crossover alerts.
Optional visual signals on chart.
Smart built-in filtering to reduce false signals.
----------------------------------------------------
🎓 Best Practices
----------------------------------------------------
Trend Following: Use the TD line as your primary trend filter - trade with the color.
Confirmation: Combine TD direction with RSI and MACD for higher probability setups.
Strength Filter: Use ADX to avoid weak/choppy trends.
Market Context: Check dominance indicators for broader market sentiment.
Alerts: Set alerts to catch reversals without constant chart watching.
----------------------------------------------------
🚀 What Makes This Indicator Special ?
----------------------------------------------------
✅ All-in-One Solution: Multiple professional indicators in one clean package.
✅ Adaptive System: Responds to market conditions, not just static calculations.
✅ Professional Dashboard: Institutional-grade information display.
✅ Real-Time Data: Live updates from multiple markets and assets.
✅ Highly Customizable: Tailor every aspect to your trading style.
✅ Clean Code: Optimized Pine Script v6 for maximum performance.
✅ No Repainting: Uses (barstate.isconfirmed) to ensure calculations only occur on closed bars.
✅ Resource Efficient: Smooth performance even with all features enabled.
----------------------------------------------------
🎯 Perfect For
----------------------------------------------------
Trend identification and following.
Multi-timeframe analysis.
Market sentiment tracking.
Entry and exit timing.
Portfolio management decisions.
Risk assessment through trend strength.
Correlation analysis across markets.
----------------------------------------------------
📝 Notes
----------------------------------------------------
All calculations are performed on confirmed bars to prevent repainting.
Dashboard updates in real-time as market conditions change.
Dominance indices (DXY, BTC.D, USDT.D) require market data access.
Best results achieved when combined with proper risk management.
Suitable for all markets: stocks, forex, crypto, commodities, indices.
----------------------------------------------------
💡 Pro Tips
----------------------------------------------------
Start with default settings and adjust based on your timeframe.
Lower periods (5-10) for scalping, higher (20-50) for swing trading.
Use the dashboard as a quick health check for your current positions.
Combine TD line with support/resistance for confluence.
Watch dominance indicators for early market regime changes.
----------------------------------------------------
⚠️ Important Notes
----------------------------------------------------
This indicator is for educational and informational purposes only.
Always confirm signals with your own analysis before trading.
Use proper risk management and position sizing.
The indicator works on all timeframes and instruments.
Past performance does not guarantee future results.
----------------------------------------------------
🔄 Updates & Support
----------------------------------------------------
Current Version: v1.1
This indicator is actively maintained and updated. Future versions may include additional features and improvements based on user feedback.
----------------------------------------------------
🙏 Acknowledgments
----------------------------------------------------
Created & designed by: @mawhoobx
📝 Remember: The best indicator is the one combined with proper risk management, discipline, and a solid trading plan. This tool is designed to assist your analysis, not replace your judgment.
Trade Smart. Trade Safe. Trade Profitable.

SMA 20/50/100/200Simple Moving Averages indicator plotting the 20, 50, 100, and 200 SMAs based on the **active chart timeframe**. Designed to adapt dynamically as you change timeframes, it helps visualize short-, medium-, and long-term trend structure, momentum shifts, and dynamic support and resistance. Color-coded for clarity with consistent line thickness for clean, readable trend analysis.

EMA 9/21/50 BandEMA band indicator plotting the 9, 21, and 50 exponential moving averages based on the **active chart timeframe**. Designed to adapt dynamically as you change timeframes, helping visualize short-term momentum, trend alignment, and dynamic support and resistance. Useful for identifying trend strength, pullbacks, and momentum shifts without anchoring to a fixed higher timeframe.

Daily SMA 20/50/100/200Simple Moving Averages indicator displaying four commonly used trend lines on the price chart. Plots the 20, 50, 100, and 200 period SMAs to help identify short-, medium-, and long-term trend direction, dynamic support and resistance, and overall market structure. Color-coded for clarity: 20 SMA in green, 50 SMA in blue, 100 SMA in orange, and 200 SMA in red, with uniform line thickness for clean visual consistency.

Opening Power Bar Strategy (Trade Your Edge)💎 GENERAL OVERVIEW:
The Opening Power Bar Strategy indicator identifies high-momentum “Power Bars” during the first 60 minutes of the New York session and generates Long/Short signals using levels from the pre-market session. The indicator plots Stop-Loss and three Take-Profit levels, manages dynamic trailing stop-loss logic (optional), displays pre-market levels, and supports alerts.
This indicator was developed by Flux Charts in collaboration with Steven Adams (Trade Your Edge).
🔹What is the purpose of the Opening Power Bar Strategy?:
The purpose of the Opening Power Bar Strategy is to trade the most active and meaningful part of the trading day, the opening move. It’s designed to take advantage of the volume and volatility that happens right after the market opens, when traders react to overnight news and pre-market movement. The indicator helps identify when that early move has real strength by looking for a large, decisive candle (a Power Bar) forming around key pre-market levels. Once it detects one, it builds a full trade plan automatically with entry, stop-loss, and take-profits.
🔹Why are signals only during the first 60 minutes?:
Most of the day’s total trading volume happens within the first 60 minutes after the market opens. This period usually sets the high or low of the day and defines the bias: whether the market will trend or stay in a range. After this first hour, volume and volatility typically decrease, and price movement becomes less consistent.
🔹What’s the theory behind the Opening Power Bar Strategy?:
The Opening Power Bar Strategy is built on a simple principle: the first hour after the market open sets the tone for the rest of the day. This period consistently shows the highest trading volume, as traders react to overnight news, economic data releases, pre-market movements, etc.
These early reactions often establish the day’s high/low, revealing where buyers or sellers are strongest. When a large, decisive candle (a Power Bar) forms during this time near the pre-market high or low, it confirms that one side is taking control. The pre-market high and low define the range that institutions and short-term traders had already reacted to before the market open. Thus, when a Power Bar forms near one of these levels during the first hour, it often marks the start of a breakout or rejection that shapes the rest of the session.
🎯 OPENING POWER BAR STRATEGY FEATURES:
The Opening Power Bar Strategy indicator includes 5 main features:
Power Bars
Pre-Market High / Low / Mid Levels
Long / Short Signals + Risk Management
Simple Moving Average (SMA)
Alerts
1️⃣ Power Bars:
🔹What are Power Bars?:
Power Bars are large, high-momentum candles that show strength in one direction of the market. They form when a candle’s body (the distance between open and close) dominates most of the candle’s total range (the distance between high and low), meaning price moved strongly in one direction with little to no pullback. To qualify, the candle must also be large relative to nearby candles. This size difference confirms that the candle is a true burst of momentum. In short, Power Bars reveal where real strength has just entered the market and where momentum is most likely to continue.
🔹How to interpret and use Power Bars:
When a Power Bar forms, it signals that price just made a strong directional move with little to no pullback. Traders can use these bars to identify momentum shifts and potential trade setups during the opening session.
A bullish Power Bar means buyers controlled the entire candle, often marking the start of upward momentum. A bearish Power Bar means sellers were in control the entire candle, often signaling the start of downwards momentum. In the Opening Power Bar Strategy, these candles are only used for signals when they appear within the pre-market high and low range. Their location relative to the pre-market midline determines direction bias:
Bullish Power Bars forming near the pre-market low can signal potential long opportunities.
Bearish Power Bars forming near the pre-market high can signal potential short opportunities.
🔹How are Power Bars identified?:
Power Bars are detected and confirmed only after the candle closes, ensuring that the full candlestick body and range can be measured. The indicator does not repaint or change past bars. Once a Power Bar is confirmed, it stays fixed on the chart. Power Bars can be detected on any timeframe or symbol that produces standard candlestick data. However, since the Opening Power Bar Strategy focuses on the first 60 minutes of the trading session, they’re most meaningful on lower intraday timeframes such as 1-minute to 5-minute charts.
The indicator identifies Power Bars using two user-defined inputs: Sensitivity and Body %.
🔹Sensitivity:
The Sensitivity setting determines how large a candle’s body must be relative to nearby candles. It uses the Average True Range (ATR) to compare the current candle’s size with recent candles, and the Sensitivity value acts as a multiplier of that ATR. A higher Sensitivity value means the candle must be much larger than recent candles to qualify, so fewer Power Bars will form. A lower value makes the filter less strict, allowing more candles to qualify.
🔹Body %:
The Body % setting controls what percentage of the candle’s total range must be body rather than Wick. A higher value requires the body to take up more of the candle’s total range, so fewer candles pass the filter. A lower value allows candles with more wick to qualify, so more Power Bars will form.
Body % Example:
If Body % is set to 50, the candle body must cover at least half of the candle’s total range. For example, if a candle’s high is $11, its low is $10, its open is $10.20, and its close is $10.80, then the total range is $1 ($11 - $10) and the body is $0.60 ($10.80 - $10.20). Body % = (Body / Total Range) * 100 = (0.60 ÷ 1.00 × 100) = 60%. Since 60% is greater than the input of 50%, this candle passes the Body % criteria.
Once a candlestick closes and it meets both the Sensitivity and Body % requirements, it will be plotted in a different color, using barcolor() function. Users can adjust the bullish/bearish colors of Power Bars by adjusting the ‘Candle Coloring’ setting. The Power Bar candle coloring is purely visual and does not affect signal logic or strategy calculations.
🔹Do Power Bars form outside the first 60 minutes?:
Power Bars can technically form at any time of day, but the Opening Power Bar Strategy only uses those formed between 9:30 AM and 10:30 AM ET for trade signals.
2️⃣ Pre-Market Levels
The indicator tracks pre-market price action from 4:10 AM EST until 9:29 AM EST to determine the session’s High and Low. When pre-market ends, both levels are drawn and continuously projected to the right throughout the regular session. A midline is calculated as the midpoint between those levels and is used to determine bullish or bearish bias at the open. This midline is calculated in the indicator’s background and not visually plotted.
Long signals require price to be positioned below the midline before breaking upward, and Short signals require price to be positioned above the midline before breaking downward.
Users can enable retest labels, which appear if price touches the pre-market low, and closes above it, or if price touches the pre-market high, and closes below it. Users can also enable/disable the pre-market levels. If disabled, the pre-market high and pre-market low levels will not be displayed.
3️⃣Long/Short Signals:
Long and Short signals only trigger during the first hour of the New York trading session, between 9:30 AM and 10:30 AM EST. These signals form between the Pre-Market Low (PML) and Pre-Market High (PMH).
▫️ A Long entry requires:
1) A bullish power bar forms
1.a) The candle’s low is < the 50% area or Midpoint of the PML/PMH range
1.b) The candle closes above the PML, but below the PMH
2) If this candle occurs between 09:30 AM and 10:30 AM, a long signal will appear.
▫️ A Short Entry requires:
1) A bearish power bar forms
1a) The candle’s high is > the 50% area or Midpoint of the PML/PMH range
1b) The candle closes below the PMH, but above the PML
2) If this candle occurs between 09:30 AM and 10:30 AM, a short signal will appear.
Only one trade can be active at a time. Users can enable or disable Long Signals and Short Signals independently. Entry markers appear directly on the chart at confirmation.
When a signal is plotted on the Power Bar’s candle close, the indicator automatically builds a rule-based trade structure and plots the following information:
Stop-Loss (SL)
Take-Profit 1 (TP 1)
Take-Profit 2 (TP 2)
Take-Profit 3 (TP 3)
For Long signals, the SL is placed at the low of the bullish Power Bar and TP 1 is placed at the PMH. The distances for TP 2 and TP 3 are then measured using the move from the entry price to TP 1. That same distance is added once above TP 1 to set TP 2, and added again above TP 2 to set TP 3.
For Short signals, the SL is placed at the high of the bearish Power Bar, and TP 1 is placed at the PML. The distances for TP 2 and TP 3 are then measured using the absolute value of the move from the entry price to TP 1. That same distance is subtracted once below TP 1 to set TP 2, and subtracted again below TP 2 to set TP 3.
🔹Trailing Stop-Loss Feature:
When the Trailing Stop-Loss setting is enabled, the Stop-Loss (SL) automatically adjusts as price reaches take-profit levels. This feature helps secure profits while keeping the trade logic completely rule-based and non-discretionary.
Here’s exactly how it works step-by-step:
▫️ Initial Stop-Loss placement:
For a Long trade, the initial SL is set at the low of the Power Bar that triggered the entry.
For a Short trade, the initial SL is set at the high of the Power Bar that triggered the entry.
This level stays fixed until one of the Take-Profit targets is reached.
▫️ After TP 1 is hit:
The SL automatically moves to the entry price (breakeven).
This eliminates all downside risk on the trade.
▫️ After TP2 is hit:
The SL automatically moves to TP 1
This locks in a partial profit while allowing the trade to continue toward TP 3.
▫️ Final exit condition:
The trade is considered complete once either the trailing Stop-Loss or TP 3 is reached.
4️⃣Simple Moving Average (SMA)
In addition to the core trade logic, the indicator includes an optional Simple Moving Average (SMA) that provides extra confirmation and context for interpreting Power Bar signals. The SMA is not related to any of the signal generation logic. It does not influence when or where Power Bars or trade signals appear. Instead, it serves as a contextual confirmation tool and should be used as an additional way to interpret the strength and quality of a setup once a signal is triggered.
There are a few ways the SMA can be used for extra context with the Opening Power Bar Strategy:
▫️ #1 Directional Confirmation:
The SMA is mainly used as a confirmation tool for countertrend Power Bar setups. It helps traders identify when a strong reversal may be developing against the prior trend.
When the SMA is sloping downward but a bullish Power Bar closes above it, that can signal a potential shift from bearish to bullish momentum.
When the SMA is sloping upward but a bearish Power Bar closes below it, that can indicate a possible transition from bullish to bearish conditions.
▫️ #2 Timing Entries
When a large Power Bar prints a signal far away from the SMA, it often indicates that price has moved quickly and temporarily extended away from its average level. In these cases, the SMA can be used as a pullback area where price may retrace before resuming its move. Waiting for this pullback can often lead to a better risk-to-reward trade setup.
For example, in the chart below, a strong bullish Power Bar formed and triggered a Long signal while closing well above the SMA. Entering immediately after the signal would have produced a 0.22 risk-to-reward to TP 1. However, waiting for price to retrace back toward the SMA before entering would have resulted in a much stronger 2.46 risk-to-reward ratio.
The SMA provides a simple way to identify areas for safer pullback entries when a Power Bar signal forms too far from its average level. This helps traders maintain consistency with their risk-to-reward targets and align entries with their trading plan.
▫️ #3 Risk/Trade Management:
During active trades, the SMA can also be used to gauge the healthiness of a trend.
If price continues to respect the SMA after entry, it supports holding the position toward later Take-Profit levels. Additionally, the SMA can highlight areas where traders may consider adding to existing positions if price respects it.
If price closes strongly back through the SMA in the opposite direction, traders may use that as an early exit or a signal that momentum has shifted.
▫️ Optional and Visual Only:
The SMA is an optional visual overlay that can be turned on or off in the indicator’s settings. It is purely there for traders who want an added layer of confirmation and structure when evaluating setups from the Opening Power Bar Strategy.
Users can customize the length of the SMA and the color within the settings.
📢 Alerts:
The indicator supports alerts, so you never miss a key market move. You can choose to receive alerts for each of the following conditions:
Long Signal
Short Signal
TP 1 (Take-Profit 1)
TP 2 (Take-Profit 2)
TP 3 (Take-Profit 3)
SL (Stop-Loss)
Pre-Market Low Retest
Pre-Market High Retest
🚩UNIQUENESS:
This indicator automates a structured opening-range strategy that traders typically manage manually each morning. It identifies valid Power Bars only when they occur inside the pre-market high/low range, confirms direction using pre-market midline context, and automatically builds risk targets using the pre-market range itself. Once a valid trigger occurs during the defined trade window, the indicator immediately generates a complete trade idea (entry/SL/TP 1-3) with built-in trailing logic and alerts.

Daily SMA 20/50/100/200Simple Moving Averages indicator displaying four commonly used trend lines on the price chart. Plots the 20, 50, 100, and 200 period SMAs to help identify short-, medium-, and long-term trend direction, dynamic support and resistance, and overall market structure. Color-coded for clarity: 20 SMA in green, 50 SMA in blue, 100 SMA in orange, and 200 SMA in red, with uniform line thickness for clean visual consistency.

Valuation Multi-Asset [MTF]Description This indicator is a specialized Intermarket Analysis tool designed to determine the relative valuation of an asset by comparing its performance against key global benchmarks (Currency, Commodities, Bonds, and Sector ETFs).
Unlike standard oscillators (like RSI) that only look at the asset's own price, this script calculates a Relative Value Index.
Underlying Concepts & Methodology The script operates on the principle of asset correlation and mean reversion ratios. The calculation logic follows these steps:
Ratio Calculation: It computes the price ratio between the Chart Asset and a Benchmark Asset (e.g., Symbol / DXY).
Smoothing: It applies a double smoothing method using Exponential Moving Averages (EMAs) to filter out short-term noise from the ratio.
Historical Normalization: Based on valuation theories (inspired by concepts like Larry Williams' valuation window), the script normalizes the smoothed ratio over a user-defined lookback period (default is 3 years/156 weeks). This ranks the current relative value between 0 and 100.
Key Features
Multi-Benchmark Comparison: Automatically compares the asset against the Dollar Index (DXY), Gold (GC1!), Bonds (ZB1!), and Sector ETFs.
MTF Dashboard: Includes a Multi-Timeframe table to see valuation status across Daily, Weekly, and Monthly views simultaneously.
ETF Reference: A built-in reference table to help you quickly find the correct Sector ETF for stock correlation.
How to Use
Undervalued Zone (< 15): When the line turns Green (or enters the bottom zone), the asset is historically cheap relative to the benchmark. This often indicates a potential accumulation or reversal point.
Overvalued Zone (> 85): When the line turns Red (or enters the top zone), the asset is historically expensive relative to the benchmark, suggesting potential distribution.
Divergences: Watch for divergences between the asset price and the Valuation Index (e.g., Price makes a new high, but the Valuation Index against Gold makes a lower high).
Settings
You can toggle individual benchmark lines (Asset 1 to 4).
Adjust the "Lookback Period" to change the historical normalization window.
Customize the Overbought/Oversold thresholds.
To comply with House Rules regarding non-English UI, here is the translation of the script's settings menu:
1. Seleção de Ativos (Asset Selection)
Usar Timeframe Personalizado = Use Custom Timeframe
Mostrar Ativo = Show Asset
Símbolo = Symbol
2. Tabela de Referência de ETFs (ETF Reference Table)
Posição da Tabela = Table Position
Categoria = Category (Sectors, Metals, Energy, Grains, Softs, Livestock)
3. Parâmetros do Índice (Index Parameters)
Comprimento EMA = EMA Length
Comprimento R do VIndex = VIndex Lookback Period
4. Níveis de Valuation (Valuation Levels)
Sobrevaloração = Overvaluation
Subvaloração = Undervaluation
Nível Neutro = Neutral Level
5. Configurações de Tabela (Table Settings)
Tamanho do Texto = Text Size
Tema = Theme (Dark/Light)
Usar Cores Personalizadas = Use Custom Colors
Mostrar Setas de Momentum = Show Momentum Arrows
6. Análise Multi-Timeframe (MTF Analysis)
Mostrar Colunas = Show Columns
Descrição Este indicador é uma ferramenta de Análise Intermercado projetada para determinar o "Valuation" (valor relativo) de um ativo comparando seu desempenho com benchmarks globais (Dólar, Ouro, Títulos e ETFs Setoriais).
Conceitos e Metodologia O script opera com base no princípio de correlação de ativos e reversão à média de ratios. A lógica de cálculo:
Cálculo da Razão: Calcula a divisão de preço entre o Ativo do Gráfico e o Benchmark (ex: Ativo / DXY).
Suavização: Aplica Médias Móveis Exponenciais (EMAs) para filtrar o ruído.
Normalização Histórica: Baseado em teorias de valuation (inspirado no método de "Valuation Index" de Larry Williams), o script normaliza esse ratio dentro de uma janela histórica (padrão de 3 anos/156 semanas), classificando o valor atual entre 0 e 100.
Como Usar
Zona Subvalorizada (< 15): Quando a linha fica Verde, o ativo está historicamente barato em relação ao benchmark.
Zona Sobrevalorizada (> 85): Quando a linha fica Vermelha, o ativo está historicamente caro em relação ao benchmark.

ORB Breakout & RetestORB Breakout & Breakdown Indicator - Complete Opening Range Strategy
Description :
The ORB (Opening Range Breakout) Breakout & Retest Indicator is a simple tool designed to identify opening range breakouts and breakdowns with retest confirmation. This indicator works on ANY timeframe while automatically analyzing 1-minute price action to detect precise entry signals.
What makes this indicator unique:
- ✅ Multi-Timeframe ORB Analysis - Simultaneously tracks 5-min, 15-min, and 30-min opening ranges
- ✅ Smart Retest Logic - Filters false breakouts by requiring price to retest and confirm the level
- ✅ Works on Any Chart Timeframe - View on 5-min, 15-min, 1-hour, or daily charts while getting 1-minute precision
- ✅ Both Long & Short Signals - Detects bullish breakouts AND bearish breakdowns
- ✅ Customizable Alerts - Get notified when confirmed setups occur
- ✅ Clean Visual Display - Compact table showing all ORB levels and signal status
How it Works:
Opening Range Detection :
- 5-Min ORB: Captures high/low from 9:30-9:35 AM
- 15-Min ORB: Captures high/low from 9:30-9:45 AM
- 30-Min ORB: Captures high/low from 9:30-10:00 AM
Breakout Confirmation (3-Step Process) :
1. Initial Break - Price closes above ORB High (or below ORB Low for shorts)
2. Retest - Price pulls back to retest the broken level
3. Confirmation - Price breaks through again, confirming the trend
This retest requirement dramatically reduces false signals and helps you enter trades with better risk/reward.
Perfect For :
- Day traders looking for opening range strategies
- Scalpers who need precise entry signals
- Swing traders identifying strong intraday momentum
- Anyone trading stocks, futures, forex, or crypto during market hours
---
⚙️ Settings & Customization :
Display Options :
- ☑️ Show ORB High (Default: OFF) - Display the high of each opening range in the table
- ☑️ Show ORB Low (Default: OFF) - Display the low of each opening range in the table
- ☑️ Show Breakout+Retest (Default: ON) - Show bullish breakout confirmation status
- ☑️ Show Breakdown+Retest (Default: ON) - Show bearish breakdown confirmation status
Alert Options :
- ☑️ Enable 5-Min Alerts (Default: OFF) - Get alerts for 5-minute ORB confirmations
- ☑️ Enable 15-Min Alerts (Default: OFF) - Get alerts for 15-minute ORB confirmations
- ☑️ Enable 30-Min Alerts (Default: OFF) - Get alerts for 30-minute ORB confirmations
Visual Indicators :
- Green triangles (▲) below bars = Breakout confirmed (bullish)
- Red triangles (▼) above bars = Breakdown confirmed (bearish)
- Triangle sizes: Tiny (5-min), Small (15-min), Normal (30-min)
---
Table Legend:
Timeframe Row: Shows the three ORB periods being tracked
ORB High Row: (Optional) The highest price during each opening range period
ORB Low Row: (Optional) The lowest price during each opening range period
Breakout+Retest Row:
- 🟢 YES = Bullish setup confirmed (price broke high, retested, and confirmed)
- 🔴 NO = No confirmed bullish setup yet
- ⚪ N/A = Opening range not yet established
Breakdown+Retest Row:
- 🟢 YES = Bearish setup confirmed (price broke low, retested, and confirmed)
- 🔴 NO = No confirmed bearish setup yet
- ⚪ N/A = Opening range not yet established
How to Use :
1. Add to Chart - Works best on stocks, futures, and indices with regular market hours (9:30 AM EST open)
2. Choose Your Timeframe - View on any timeframe; indicator automatically analyzes 1-minute data
3. Monitor the Table - Watch for "YES" signals in Breakout or Breakdown rows
4. Set Alerts - Enable alerts for your preferred ORB timeframes
5. Plan Your Trade - Use ORB levels as entry points and initial stop-loss levels
Tips :
- Combine multiple timeframe confirmations for higher probability setups
- Use ORB High/Low levels as natural support/resistance zones
- The 5-min ORB gives faster signals; 30-min ORB gives stronger trends
- Best results typically occur in the first 1-2 hours after market open
- Works on all markets but optimized for regular trading hours (9:30 AM EST)
Key Features Summary :
✓ Multi-timeframe opening range tracking (5, 15, 30-minute)
✓ Retest confirmation logic to filter false breakouts
✓ Works on any chart timeframe with 1-minute precision
✓ Bullish and bearish signal detection
✓ Customizable visual display with toggle options
✓ Individual alerts for each timeframe and direction
✓ Clean, professional table interface
✓ No repainting - signals are final once confirmed
✓ Suitable for all experience levels

Daily SMA 20/50/100/200Simple Moving Averages indicator displaying four commonly used trend lines on the price chart. Plots the 20, 50, 100, and 200 period SMAs to help identify short-, medium-, and long-term trend direction, dynamic support and resistance, and overall market structure. Color-coded for clarity: 20 SMA in green, 50 SMA in blue, 100 SMA in orange, and 200 SMA in red, with uniform line thickness for clean visual consistency.


EMA Strategy Flip/DCA + PnL (Aidan)This is a long only , trend focused EMA strategy designed for capital preservation and entries in sustained market movement, rather than short term trading.
At its core, the system is intentionally simple:
-Uses a dual EMA trend structure to identify bullish and bearish regimes
-Avoids unnecessary exits when price action is indecisive
-Emphasizes staying aligned with the larger market direction
All of these characteristics inherently work best on longer time frames, I typically use the 1D view but have also tested in the 1W and 4H views as well.
Philosophy 🧠
Markets do not move in clean, continuous trends. They alternate between:
-Expansion (breakouts/breakdowns)
-Compression (consolidation/chop)
Most traditional EMA crossover strategies fail because they:
-Overreact during consolidation
-Constantly flip positions
-Slowly bleed capital in sideways markets
This indicator attempts to solve that issue by filtering how sell signals are treated depending on market behavior, rather than blindly acting on every crossover. These are denoted by the "weak sell" indications which are defined by the length of each EMA expansion period.
HOW IT WORKS ⚙️
Buy Signals
Buy signals are generated when the EMA structure flips bullish.
On higher timeframes, these buys aim to align with broader market momentum, not short-term noise.
Weak Sell vs Strong Sell
Not every bearish EMA flip is treated equally. Short, flickering EMA flips (common in consolidation) are treated as “weak sells”, meaning the position is held. The length that defines each "weak sell" can be edited through settings under "flip-distance regime" if you so choose. I keep mine between 20-30 ticks.
Capital is not forced out of the market prematurely. Only when an EMA move shows sufficient trend persistence does the indicator issue a strong sell, fully closing the position.
DCA-Friendly by Design
One of the strengths of this indicator is that it can be used in a dollar-cost-averaging (DCA) mindset.
Some users may choose to:
-Simply buy on each buy signal
-Hold positions through weak sell periods
-Use strong sell signals as higher-confidence exits
This approach can be particularly effective for traders or investors with a long-term outlook who prefer gradual position building with less emotion on each buy. The amount of max tolerable DCA entries can be edited through settings (default 6)
Best Practices & Usage Notes
-This indicator performs best on 4H and 1D charts (be sure to note your "flip distance regime" in settings or the weak sell periods may be inaccurate)
-Blue chip and macro markets prove to yield the most consistent results during back testing, although I've seen impressive results on volatile markets as well.
-It is not designed for scalping or very low timeframes
-No indicator is perfect — not every buy or sell will be optimal
-For best results, it should be used alongside:
-Higher-timeframe trend analysis
-Market structure (higher highs / higher lows)
-Macro context or sector strength
-Your own risk management rules
Think of this tool as a framework, not a prediction engine. When used with discipline and proper context, it can serve as a reliable indicator for traders focused on sustainable growth rather than constant activity.
I am always open to suggestions on improvements; please feel free to comment below and let me know any ideas you might have for bettering the indicator, or if you just have questions I'll be happy to answer any!
Good luck out there!!

Nifty 50 Indicator Indicator Name:
9 & 20 EMA + ADX(7) Full System (Confirmed Breakout - Stable)
Purpose:
To identify buy/sell signals based on EMA crossovers and ADX confirmation.
To track confirmed breakout levels and calculate a trailing stop-loss (SL).
To display relevant trading information in a table and visually on the chart.
Logic and Components:
1️⃣ Indicators Used
EMA(9) and EMA(20):
Used to detect trend direction and crossovers.
ADX(7):
Measures trend strength to classify signals as strong or weak.
2️⃣ Signal Generation
Strong Buy: EMA9 crosses above EMA20 and ADX > 20
Weak Buy: EMA9 crosses above EMA20 and ADX ≤ 20
Strong Sell: EMA9 crosses below EMA20 and ADX > 20
Weak Sell: EMA9 crosses below EMA20 and ADX ≤ 20
3️⃣ Confirmed Breakout Logic
Tracks the highest high after a buy signal (confirmedHigh).
Tracks the lowest low after a sell signal (confirmedLow).
Only updates confirmed levels if price continues in the signal direction.
4️⃣ Trailing Stop-Loss (SL)
Calculated from confirmed price, not entry price.
Buy: trailingSL = confirmedHigh * (1 - 0.009)
Sell: trailingSL = confirmedLow * (1 + 0.009)
Plotted on the chart as a red line, thicker and extending to the right.
5️⃣ Visual Elements on Chart
EMAs:
EMA9 (green), EMA20 (red).
Triangles for signals:
Medium size, hollow, colored outline.
Up triangles for buy, down triangles for sell.
Trailing SL line:
Red, width=3, extends 50 bars to the right.
6️⃣ Table Display
Shows key variables for each active signal:
Signal Type (Strong/Weak Buy/Sell)
Entry Price
Confirmed Price
Confirmed Move (Price difference from entry to confirmed)
ADX Value
Trailing SL
Summary of Workflow
Detect EMA crossovers.
Filter signals by ADX to determine strength.
Record entry price and initial confirmed high/low.
Update confirmed high/low if price continues in trend.
Calculate trailing SL from confirmed price.
Plot EMAs, signals (triangles), and trailing SL line.
Display all key information in a table on the chart.
✅ Key Features:
Dynamic trailing stoploss based on confirmed breakout.
Distinguishes strong vs weak signals.
Visual cues: hollow triangles for signals, SL line, and table summary.
Works entirely on the chart, ready for trading analysis.

MA Cross + Trend Stats (Probabilistic)Short description (one-liner)
A MA-regime framework with historical regime stats + forward performance + optional trend/noise filters for trending context.
________________________________________
Full description (TradingView-ready)
Overview
This indicator turns a classic Moving Average Cross into a regime-based trend dashboard. Instead of treating a cross as a standalone “buy/sell” event, it measures what historically happened after similar regime shifts on the current symbol and timeframe, and displays the results in a compact table.
It supports:
• EMA or SMA
• Custom fast/slow lengths (including .5 lengths via floor/ceil averaging)
• Optional trend quality filters for trending decisions:
o Slope filter (Slow MA slope)
o Market noise filter using Efficiency Ratio (ER) in real time
________________________________________
What the table shows (how to read it)
The table has two rows: Bull (Fast > Slow) and Bear (Slow > Fast). Metrics are computed on completed regimes (historical segments that already ended).
N
Number of completed regimes measured. More samples generally means more stable estimates.
μ Δ% / Med Δ%
Average and median regime return from regime start to regime end. Median helps reduce the impact of outliers.
⏱ Bars
Average regime duration (in bars). Useful to calibrate realistic holding expectations for trending.
⬆ MFE% / ⬇ MAE%
• MFE (Maximum Favorable Excursion): max move in favor during the regime
• MAE (Maximum Adverse Excursion): max move against during the regime
These are context metrics for typical run-up and typical heat.
ER μ | Hit
Trend-quality proxy:
• ER μ: average Efficiency Ratio during regimes (0–1, higher = more directional / less noisy)
• Hit: % of regimes with ER above the historical threshold you set
Forward performance (+H μ|Hit)
For two user-defined horizons (e.g., +10 / +20 bars):
• μ: average forward return after the cross
• Hit: probability (%) that the forward return was positive
This is designed to provide probabilistic context, not certainty.
________________________________________
“Trending” decision filters (optional)
These filters apply to signals/alerts/markers, not to the raw regime statistics:
1. Slope filter (Slow MA):
Only allow Bull signals if the Slow MA slope is positive (and Bear signals if negative).
2. Market noise filter (ER realtime):
Only allow signals when current ER exceeds your chosen threshold (helps avoid choppy conditions).
________________________________________
Suggested usage (educational)
• Treat Bull/Bear as a regime label (state), not a prediction.
• Use Forward Hit% as an estimate of historical frequency, not a guarantee.
• If ER realtime is below threshold, consider it a noisier environment (higher whipsaw risk).
• Combine with your own risk rules and confirmation (structure, volatility, volume, HTF context, etc.).
________________________________________
Notes
• Results depend on symbol, timeframe, and loaded history.
• Statistics are historical summaries and can change as more data becomes available.
• This tool is intended for research and decision support, not as standalone trade advice.
________________________________________
Disclaimer
This script is for educational and informational purposes only and does not constitute financial, investment, or trading advice. Trading involves risk. You are responsible for your own decisions and risk management.
