Market Structure Trailing Stop [BigBeluga]The Market Structure Trailing Stop indicator is an advanced tool for identifying market structure shifts, liquidity sweeps, and potential trend reversals using comprehensive volume analysis. This indicator combines the analysis of market structure pivots (CHoCH - Change of Character) with a sophisticated volume-based trailing stop logic. By evaluating delta volume at key structural points, it allows traders to identify high-probability trend continuations or reversals and manage their trades more effectively.
🔵 KEY FEATURES
● Market Structure Analysis
Pivot-Based Market Structure : The indicator identifies high and lows using user-defined periods, allowing traders to spot key market structure shifts.
Change of Character (CHoCH) : The first significant break of a market structure is marked as a CHoCH, indicating a potential trend reversal.
Break of Structure (BoS) : The indicator highlights subsequent breaks of structure after CHoCH, providing traders with crucial insights into trend strength.
● Advanced Volume Analysis
Delta Volume Evaluation : The indicator calculates delta volume (difference between up and down volume) at each ChoCh or BoS market structure point to assess the strength of the move. Identify Delta Volume from break point back to Pivot
● Trailing Stop Logic
Volume-Validated Trailing Stop : The indicator automatically plots a trailing stop if the delta volume at the UP CHoCH is positive and above the defined threshold and vice versa for Down CHoCH , allowing traders to protect their profits while riding the trend.
Trend Weakness Detection : If a subsequent BoS occurs with negative delta volume or lower volume than the input threshold, the trailing stop disappears, indicating potential trend exhaustion or reversal.
Dynamic Stop Placement : The trailing stop is dynamically adjusted based on market structure and volume, providing traders with a more adaptive stop-loss strategy.
Up Trend Trailing Stop:
Down Trend Trailing Stop:
● Liquidity Sweep Detection
Liquidity Sweep (X) Labels : The indicator identifies liquidity sweeps—points where the price temporarily reverses to sweep liquidity above or below a key level—marked with an “X” label.
Potential Reversal Zones : These liquidity sweeps are potential reversal zones, especially when accompanied by significant delta volume changes, providing traders with early warnings of potential trend reversals.
🔵 HOW TO USE
● Identifying Market Structure Shifts
Change of Character (CHoCH) : When a CHoCH occurs, the indicator calculates the total volume from the high point to the break point. If the delta volume is positive and exceeds the input threshold, a trailing stop is plotted, signaling potential trend continuation.
Break of Structure (BoS) : If BoS is enabled, subsequent breaks of structure are highlighted. If these BoS points show weaker volume or negative delta volume, the trailing stop will disappear, indicating that the trend may be losing strength.
● Using the Trailing Stop Feature
Protecting Profits : Once a CHoCH occurs and the delta volume validates the trend, the trailing stop will be plotted below (or above) the price to protect profits while allowing the trend to run.
Trend Reversal Signals : If the trailing stop disappears due to weak volume at subsequent BoS points, it may signal that the trend is losing momentum, and traders may consider closing their positions or tightening their stops manually.
● Liquidity Sweep Interpretation
Spotting Reversal Zones : Liquidity sweeps, marked with an “X” label, indicate zones where the price has swept liquidity. These areas can serve as potential reversal zones, especially when significant delta volume is observed at these points.
Early Reversal Warnings : Traders can use these liquidity sweep labels as early warnings for potential trend reversals, particularly in conjunction with other technical analysis methods.
🔵 CUSTOMIZATION
Highs and Lows Calculation : Customize the number of bars to the left and right for identifying pivots and market structure shifts.
Volume Threshold : Define the volume threshold to filter out weaker moves and focus on significant market structure shifts.
BoS and Liquidity Sweep Labels : Toggle on or off the BoS and Liquidity Sweep labels to tailor the indicator to your trading style.
Trend Color : Enable or disable trend coloring for candles to visually highlight uptrends and downtrends on the chart.
🔵 CONCLUSION
The Market Structure Trailing Stop indicator combines advanced volume analysis with market structure detection to provide traders with a powerful tool for identifying and managing trends. By leveraging delta volume at key structure points, it helps traders validate trend strength and manage their positions with a dynamic trailing stop strategy. The addition of liquidity sweep detection further enhances its utility, offering early warnings of potential trend reversals. This indicator is ideal for traders who want to gain a deeper understanding of market structure while incorporating volume-based insights into their trading strategies.
Search in scripts for "BOS"

Smart Money Concepts [XoRonX]# Smart Money Concepts (SMC) - Advanced Trading Indicator
## 📊 Deskripsi
**Smart Money Concepts ** adalah indicator trading komprehensif yang menggabungkan konsep Smart Money Trading dengan berbagai alat teknikal analisis modern. Indicator ini dirancang untuk membantu trader mengidentifikasi pergerakan institusional (smart money), struktur pasar, zona supply/demand, dan berbagai sinyal trading penting.
Indicator ini mengintegrasikan multiple timeframe analysis, order blocks detection, fair value gaps, fibonacci retracement, volume profile, RSI multi-timeframe, dan moving averages dalam satu platform yang powerful dan mudah digunakan.
---
## 🎯 Fitur Utama
### 1. **Smart Money Structure**
- **Internal Structure** - Struktur pasar jangka pendek untuk entry presisi
- **Swing Structure** - Struktur pasar jangka panjang untuk trend analysis
- **BOS (Break of Structure)** - Konfirmasi kelanjutan trend
- **CHoCH (Change of Character)** - Deteksi potensi reversal
### 2. **Order Blocks**
- **Internal Order Blocks** - Zona demand/supply jangka pendek
- **Swing Order Blocks** - Zona demand/supply jangka panjang
- Filter otomatis berdasarkan volatilitas (ATR/Range)
- Mitigation tracking (High/Low atau Close)
- Customizable display (jumlah order blocks yang ditampilkan)
### 3. **Equal Highs & Equal Lows (EQH/EQL)**
- Deteksi otomatis equal highs/lows
- Indikasi liquidity zones
- Threshold adjustment untuk sensitivitas
- Visual lines dan labels
### 4. **Fair Value Gaps (FVG)**
- Multi-timeframe FVG detection
- Auto threshold filtering
- Bullish & Bearish FVG boxes
- Extension control
- Color customization
### 5. **Premium & Discount Zones**
- Premium Zone (75-100% dari range)
- Equilibrium Zone (47.5-52.5% dari range)
- Discount Zone (0-25% dari range)
- Auto-update berdasarkan swing high/low
### 6. **Fibonacci Retracement**
- **Equilibrium to Discount** - Fib dari EQ ke discount zone
- **Equilibrium to Premium** - Fib dari EQ ke premium zone
- **Discount to Premium** - Fib full range
- Reverse option
- Show/hide lines
- Custom colors
### 7. **Volume Profile (VRVP)**
- Visible Range Volume Profile
- Point of Control (POC)
- Value Area (70% volume)
- Auto-adjust rows
- Placement options (Left/Right)
- Width customization
### 8. **RSI Multi-Timeframe**
- Monitor 3 timeframes sekaligus
- Overbought/Oversold signals
- Visual table display
- Color-coded signals (Red OB, Green OS)
- Customizable position & size
### 9. **Moving Averages**
- 3 Moving Average lines
- Pilihan tipe: EMA, SMA, WMA
- Automatic/Manual period mode
- Individual color & width settings
- Cross alerts (MA vs MA, Price vs MA)
### 10. **Multi-Timeframe Levels**
- Support up to 5 different timeframes
- Previous high/low levels
- Custom line styles
- Color customization
### 11. **Candle Color**
- Color candles berdasarkan trend
- Bullish = Green, Bearish = Red
- Optional toggle
---
## 🛠️ Cara Penggunaan
### **A. Setup Awal**
1. **Tambahkan Indicator ke Chart**
- Buka TradingView
- Klik "Indicators" → "My Scripts" atau paste code
- Pilih "Smart Money Concepts "
2. **Pilih Mode Display**
- **Historical**: Tampilkan semua struktur (untuk backtesting)
- **Present**: Hanya tampilkan struktur terbaru (clean chart)
3. **Pilih Style**
- **Colored**: Warna berbeda untuk bullish/bearish
- **Monochrome**: Tema warna abu-abu
---
### **B. Penggunaan Fitur**
#### **1. Smart Money Structure**
**Internal Structure (Real-time):**
- ✅ Aktifkan "Show Internal Structure"
- Pilih tampilan: All, BOS only, atau CHoCH only
- Gunakan untuk entry timing presisi
- Filter confluence untuk mengurangi noise
**Swing Structure:**
- ✅ Aktifkan "Show Swing Structure"
- Pilih tampilan struktur bullish/bearish
- Adjust "Swings Length" (default: 50)
- Gunakan untuk konfirmasi trend utama
**Tips:**
- BOS = Konfirmasi trend continuation
- CHoCH = Warning untuk possible reversal
- Tunggu price retest ke order block setelah BOS
---
#### **2. Order Blocks**
**Setup:**
- ✅ Aktifkan Internal/Swing Order Blocks
- Set jumlah blocks yang ditampil (1-20)
- Pilih filter: ATR atau Cumulative Mean Range
- Pilih mitigation: Close atau High/Low
**Cara Trading:**
1. Tunggu BOS/CHoCH terbentuk
2. Identifikasi order block terdekat
3. Wait for price pullback ke order block
4. Entry saat price respek order block (rejection)
5. Stop loss di bawah/atas order block
6. Target: swing high/low berikutnya
**Color Code:**
- 🔵 Light Blue = Internal Bullish OB
- 🔴 Light Red = Internal Bearish OB
- 🔵 Dark Blue = Swing Bullish OB
- 🔴 Dark Red = Swing Bearish OB
---
#### **3. Equal Highs/Lows (EQH/EQL)**
**Setup:**
- ✅ Aktifkan "Equal High/Low"
- Set "Bars Confirmation" (default: 3)
- Adjust threshold (0-0.5, default: 0.1)
**Interpretasi:**
- EQH = Liquidity di atas, kemungkinan sweep lalu dump
- EQL = Liquidity di bawah, kemungkinan sweep lalu pump
- Biasanya smart money akan grab liquidity sebelum move besar
**Trading Strategy:**
- Wait for EQH/EQL formation
- Anticipate liquidity grab
- Entry setelah sweep dengan konfirmasi (order block, FVG, CHoCH)
---
#### **4. Fair Value Gaps (FVG)**
**Setup:**
- ✅ Aktifkan "Fair Value Gaps"
- Pilih timeframe (default: chart timeframe)
- Enable/disable auto threshold
- Set extension bars
**Cara Trading:**
1. Bullish FVG = Support zone untuk buy
2. Bearish FVG = Resistance zone untuk sell
3. Price tends to fill FVG (retest)
4. Entry saat price kembali ke FVG
5. Partial fill = valid, full fill = invalidated
**Tips:**
- FVG + Order Block = High probability setup
- Multi-timeframe FVG lebih kuat
- Unfilled FVG = strong momentum
---
#### **5. Premium & Discount Zones**
**Setup:**
- ✅ Aktifkan "Premium/Discount Zones"
- Zones akan auto-update berdasarkan swing high/low
**Interpretasi:**
- 🟢 **Discount Zone** = Area BUY (price murah)
- ⚪ **Equilibrium** = Neutral (50%)
- 🔴 **Premium Zone** = Area SELL (price mahal)
**Trading Strategy:**
- BUY dari discount zone
- SELL dari premium zone
- Avoid trading di equilibrium
- Combine dengan structure confirmation
---
#### **6. Fibonacci Retracement**
**Setup:**
- Pilih Fib yang ingin ditampilkan:
- Equilibrium to Discount
- Equilibrium to Premium
- Discount to Premium
- Toggle show lines
- Enable reverse jika perlu
- Custom colors
**Key Levels:**
- 0.236 = Shallow retracement
- 0.382 = Common retracement
- 0.5 = 50% golden level
- 0.618 = Golden ratio (penting!)
- 0.786 = Deep retracement
**Cara Pakai:**
- 0.618-0.786 = Ideal entry zone dalam trend
- Combine dengan order blocks
- Wait for confirmation candle
---
#### **7. Volume Profile (VRVP)**
**Setup:**
- ✅ Aktifkan "Show Volume Profile"
- Set jumlah rows (10-100)
- Adjust width (5-50%)
- Pilih placement (Left/Right)
- Enable POC dan Value Area
**Interpretasi:**
- **POC (Point of Control)** = Harga dengan volume tertinggi = magnet
- **Value Area** = 70% volume = fair price range
- **Low Volume Nodes** = Weak support/resistance
- **High Volume Nodes** = Strong support/resistance
**Trading:**
- POC acts as support/resistance
- Price tends to return to POC
- Breakout dari Value Area = momentum
---
#### **8. RSI Multi-Timeframe**
**Setup:**
- ✅ Aktifkan "Show RSI Table"
- Set 3 timeframes (default: chart, 5m, 15m)
- Set RSI period (default: 14)
- Set Overbought level (default: 70)
- Set Oversold level (default: 30)
- Pilih posisi & ukuran table
**Interpretasi:**
- 🟢 **OS (Oversold)** = RSI ≤ 30 = Kondisi jenuh jual
- 🔴 **OB (Overbought)** = RSI ≥ 70 = Kondisi jenuh beli
- **-** = Neutral zone
**Trading Strategy:**
1. Multi-timeframe alignment = strong signal
2. OS + Bullish structure = BUY signal
3. OB + Bearish structure = SELL signal
4. Divergence RSI vs Price = reversal warning
**Contoh:**
- TF1: OS, TF2: OS, TF3: OS + Price di discount zone = STRONG BUY
---
#### **9. Moving Averages**
**Setup:**
- Pilih MA Type: EMA, SMA, atau WMA (berlaku untuk ketiga MA)
- Pilih Period Mode: Automatic atau Manual
- Set period untuk MA 1, 2, 3 (default: 20, 50, 100)
- Custom color & width per MA
- ✅ Enable Cross Alerts
**Interpretasi:**
- **Golden Cross** = MA fast cross above MA slow = Bullish
- **Death Cross** = MA fast cross below MA slow = Bearish
- Price above all MAs = Strong uptrend
- Price below all MAs = Strong downtrend
**Trading Strategy:**
1. MA1 (20) = Short-term trend
2. MA2 (50) = Medium-term trend
3. MA3 (100) = Long-term trend
**Entry Signals:**
- Price bounce dari MA dalam trend = continuation
- MA cross dengan konfirmasi structure = entry
- Multiple MA confluence = strong support/resistance
**Alerts Available:**
- MA1 cross MA2/MA3
- MA2 cross MA3
- Price cross any MA
---
#### **10. Multi-Timeframe Levels**
**Setup:**
- Enable HTF Level 1-5
- Set timeframes (contoh: 5m, 1H, 4H, D, W)
- Pilih line style (solid/dashed/dotted)
- Custom colors
**Cara Pakai:**
- Previous high/low dari HTF = strong S/R
- Breakout HTF level = significant move
- Multiple HTF levels confluence = major zone
---
### **C. Trading Setup Combination**
#### **Setup 1: High Probability Buy (Bullish)**
1. ✅ Swing structure: Bullish BOS
2. ✅ Price di Discount Zone
3. ✅ Pullback ke Bullish Order Block
4. ✅ Bullish FVG di bawah
5. ✅ RSI Multi-TF: Oversold
6. ✅ Price bounce dari MA
7. ✅ POC/Value Area support
8. ✅ Fibonacci 0.618-0.786 retracement
**Entry:** Saat price reject dari order block dengan confirmation candle
**Stop Loss:** Below order block
**Target:** Swing high atau premium zone
---
#### **Setup 2: High Probability Sell (Bearish)**
1. ✅ Swing structure: Bearish BOS
2. ✅ Price di Premium Zone
3. ✅ Pullback ke Bearish Order Block
4. ✅ Bearish FVG di atas
5. ✅ RSI Multi-TF: Overbought
6. ✅ Price reject dari MA
7. ✅ POC/Value Area resistance
8. ✅ Fibonacci 0.618-0.786 retracement
**Entry:** Saat price reject dari order block dengan confirmation candle
**Stop Loss:** Above order block
**Target:** Swing low atau discount zone
---
#### **Setup 3: Liquidity Grab (EQH/EQL)**
1. ✅ Identifikasi EQH atau EQL
2. ✅ Wait for liquidity sweep
3. ✅ Konfirmasi dengan CHoCH
4. ✅ Order block terbentuk setelah sweep
5. ✅ Entry saat retest order block
---
### **D. Tips & Best Practices**
**Risk Management:**
- Selalu gunakan stop loss
- Risk 1-2% per trade
- Risk:Reward minimum 1:2
- Jangan over-leverage
**Confluence adalah Kunci:**
- Minimal 3-4 konfirmasi sebelum entry
- Lebih banyak konfirmasi = higher probability
- Quality over quantity
**Timeframe Analysis:**
- HTF (Higher Timeframe) = Trend direction
- LTF (Lower Timeframe) = Entry timing
- Align dengan HTF trend
**Backtesting:**
- Gunakan mode "Historical"
- Test strategy di berbagai market condition
- Record dan analyze hasil
**Market Condition:**
- Trending market = Follow BOS, use order blocks
- Ranging market = Use premium/discount zones, EQH/EQL
- High volatility = Wider stops, wait for clear structure
**Avoid:**
- Trading di equilibrium zone
- Entry tanpa konfirmasi
- Fighting the trend
- Overleveraging
- Emotional trading
---
## 📈 Recommended Settings
### **For Scalping (1m - 5m):**
- Internal Structure: ON
- Swing Structure: OFF
- Order Blocks: Internal only
- RSI Timeframes: 1m, 5m, 15m
- MA Periods: 9, 21, 50
### **For Day Trading (15m - 1H):**
- Internal Structure: ON
- Swing Structure: ON
- Order Blocks: Both
- RSI Timeframes: 15m, 1H, 4H
- MA Periods: 20, 50, 100
### **For Swing Trading (4H - D):**
- Internal Structure: OFF
- Swing Structure: ON
- Order Blocks: Swing only
- RSI Timeframes: 4H, D, W
- MA Periods: 20, 50, 200
---
## ⚠️ Disclaimer
Indicator ini adalah alat bantu analisis teknikal. Tidak ada indicator yang 100% akurat. Selalu:
- Lakukan analisa fundamental
- Gunakan proper risk management
- Praktik di demo account terlebih dahulu
- Trading memiliki resiko, trade at your own risk
---
## 📝 Version Info
**Version:** 5.0
**Platform:** TradingView Pine Script v5
**Author:** XoRonX
**Max Labels:** 500
**Max Lines:** 500
**Max Boxes:** 500
---
## 🔄 Updates & Support
Untuk update, bug reports, atau pertanyaan:
- Check documentation regularly
- Test new features in replay mode
- Backup your settings before updates
---
## 🎓 Learning Resources
**Recommended Study:**
1. Smart Money Concepts (SMC) basics
2. Order blocks theory
3. Liquidity concepts
4. ICT (Inner Circle Trader) concepts
5. Volume profile analysis
6. Multi-timeframe analysis
**Practice:**
- Start with higher timeframes
- Master one concept at a time
- Keep a trading journal
- Review your trades weekly
---
**Happy Trading! 🚀📊**
_Remember: The best indicator is your own analysis and discipline._

Liquidity & inducementsHi all!
This indicator will show liquidity and inducements.
I will continue to try to add different types of liquidity and inducements, at this moment it contains 6 kinds of liquidity/inducement, they are:
• Grabs
• Big grabs
• Sweeps
• Turtle soups
• Equal highs/lows (liquidity and inducement)
• BSL & SSL
And 1 type of inducement:
• Retracement
This description will contain indicator examples of each individual liquidity and inducement. They will all be with the default settings.
Settings
First you will find settings for the market structure (BOS/CHoCH/CHoCH+). Select left and right pivot lengths and if the pivots should have a label or not.
This is the base foundation of this indicator and is possible with my library 'PriceAction' ().
You will see solid lines for break of structures (BOS), change of characters (CHoCH) and change of character plus (CHoCH+).
The pivots found will be the core of this indicator and will show you when the closing price breaks it. When that happens a break of structure (BOS) or a change of character (CHoCH or CHoCH+) will be created. The latest 5 pivots found within the current trend will be kept to take action on.
A break of structure is removed if an earlier pivot within the same trend is broken and the pivot's high price for a bullish trend or low price for a bearish trend is more extreme than the BOS pivot's price.
You are able to show the pivots that are used. "HH" (higher high), "HL" (higher low), "LH" (lower high), "LL" (lower low) and "H"/"L" (for pivots (high/low) when the trend has changed) are the labels used.
In the next section ('Liquidity ($$$)') you can select which types of liquidity you want to see. Note that 'Equal highs/lows' can also show inducement (more on that later).
In the section afterwards ('Inducement (IDM)') you can select if you want retracement inducements to be visible or not. More information on what they are later on.
The section for each individual liquidity and/or inducement can first contain a line named 'Pivot', where you can set the pivot lengths (first left, then right). Then you can set the 'Lookback', which means that the 'Lookback' number of past pivots is to take action on. After that you set the 'Timeframe' for the pivots used. That means that all available liquidity/inducements will be from your desired timeframe. Lastly you set the color of the liquidity/inducement (either a single color or bullish followed by bearish colors).
Lastly in the settings you can select the font sizes for the market structure and liquidity/inducements and what style liquidity/inducements lines will have. The sizes defaults to 7 and has a dotted line look.
Grabs
Liquidity grabs and liquidity sweeps are very similar. It all depends on if the current bar closed above/below the liquidity pivot and on if its a continuation or reversal. In a liquidity grab the bar that's above or below the liquidity pivot was not closed above or below it. Like this:
Or
The visual feedback will be a dotted line between the liquidity pivot and liquidity grab bar and a linefill between the high of the liquidity grab bar and the liquidity pivot.
Indicator example:
Big grabs
This is another 'grabs' option. You can show an additional grab if you want to. I suggest having this grab from a higher timeframe or with larger pivot lengths than the other grab.
The default is with the chart timeframe and 10/10 as pivot lengths.
Indicator example:
Sweeps
A liquidity sweep is like a liquidity grab but with the difference that price closes above/below and has a continuation instead of a reversal. If the liquidity pivot was at the same bar as a BOS/CHoCH/CHoCH+ it will not be a liquidity grab but a structural break instead.
They can look like this:
Indicator example;
Turtle soups
If only one candle is beyond the pivot it could be a liquidity grab. It's a grab if price didn't close beyond the liquidity pivot, if so it's invaliditet. Turtle soups are basically false breakouts that takes liquidity (is a false breakout from a pivot with the lengths and timeframe from the settings).
The turtle soup can have a confirmation in the terms of a change of character (CHoCH). You can enable this in the settings section for 'Turtle soups' through the 'Confirmation' checkbox (enabled by default). The turtle soup strategy usually comes with some sort of confirmation, in this case a CHoCH, but it can also be a market structure shift (MSS) or a change in state of delivery (CISD).
The addition of turtle soups is possible through my script 'Turtle soup' ().
The drawing will be a dotted line between the liquidity pivot and the last bar of the false breakout and a box from the start of the false breakout to the end of it.
Indicator example:
Equal highs/lows
Equal highs/lows will always show liquidity, but might also show inducement. Inducement will be shown on equal lows if the trend is bullish and on equal highs if it's bearish, like this:
Or
Equal highs can only be created if the second pivot is lower than the first one. Equal lows can only be created if the second pivot is higher than the first one. If that is not the case it could be a liquidity grab.
When equal highs or equal lows are find that produces inducement (equal lows in a bullish trend and equal highs in a bearish trend), the indicator will first display inducement and will show liquidity once traders are induced to enter the security. Stop loss placement, for liquidity, is 0.1 * the average true range (ATR, of length 14). They will look like this:
Only inducement:
Inducement and liquidity:
Indicator example:
Equal highs/lows inducements can not be triggered after a BOS/CHoCH/CHoCH+. They are cleared upon a structural break.
BSL & SSL
Buyside liquidity (BSL) and sellside liquidity (SSL) will be shown. A pivot that's been mitigated (touched by price) can never be BSL or SSL. The BSL/SSL available will be dynamic while price moves (work in Replay and lower timeframes that moves fast) and pick the latest pivot/s (with left and right lengths from the 'Market structure' section). You can define how many BSL/SSL you want to see with a default value of 1, meaning only 1 BSL and 1 SSL can be shown. If there is no unmitigated high (BSL) or low (SSL), no BSL/SSL will be available to show. If there are BSL/SSL available they're very useful to use as targets for entering a trade.
The will look like this when available;
And without BSL available:
Or
And without SSL available:
Note that the examples without BSL/SSL available could have liquidity available from previous price legs.
This can be an example of a BSL/SSL sequence:
First both buyside and sellside liquidity is available:
Then a new low appears and new sellside liquidity is available:
Then buyside liquidity is mitigated, so only sellside liquidity is available:
A new high pivot appears and buyside liquidity is available again:
Lastly a bearish CHoCH happens and sellside liquidity is mitigated, only buyside liquidity is available:
Retracement
The first retracement after a BOS/CHoCH/CHoCH+ is considered an inducement with the mission to get traders into a trade prematurely to get stopped out. This level is shown and look like this:
Or
A retracement inducement is removed when a new BOS/CHoCH/CHoCH+ appears and it's not triggered.
---------------------------
As of now there aren't any alerts available. You cannot use the Pine Screener from Tradingview either to see new liquidity/inducement events. I have this planned for future updates though.
I hope that this long description makes sense, let me know otherwise! Also let me know if you experience any bugs or have a feature request or just want to share good settings to use.
Best of trading luck!

Dynamic Market Structure (MTF) - Dow TheoryDynamic Market Structure (MTF)
OVERVIEW
This advanced indicator provides a comprehensive and fully customizable solution for analyzing market structure based on classic Dow Theory principles. It automates the identification of key structural points, including Higher Highs (HH), Higher Lows (HL), Lower Lows (LL), and Lower Highs (LH).
Going beyond simple pivot detection, this tool visualizes the flow of the trend by plotting dynamic Breaks of Structure (BOS) and potential reversals with Changes of Character (CHoCH). It is designed to be a flexible and powerful tool for traders who use price action and trend analysis as a core part of their strategy.
CORE CONCEPTS
The indicator is built on the foundational principles of Dow Theory:
Uptrend: A series of Higher Highs and Higher Lows.
Downtrend: A series of Lower Lows and Lower Highs.
Break of Structure (BOS): Occurs when price action continues the current trend by creating a new HH in an uptrend or a new LL in a downtrend.
Change of Character (CHoCH): Occurs when the established trend sequence is broken, signaling a potential reversal. For example, when a Lower Low forms after a series of Higher Highs.
CALCULATION METHODOLOGY
This section explains the indicator's underlying logic:
Pivot Detection: The indicator's core logic is based on TradingView's built-in ta.pivothigh() and ta.pivotlow() functions. The sensitivity of this detection is fully controlled by the user via the Pivot Lookback Left and Pivot Lookback Right settings.
Structure Calculation (BOS/CHoCH): The script identifies market structure by analyzing the sequence of these confirmed pivots.
A bullish BOS is plotted when a new ta.pivothigh is confirmed at a price higher than the previous confirmed ta.pivothigh.
A bearish CHoCH is plotted when a new ta.pivotlow is confirmed at a price lower than the previous confirmed ta.pivotlow , breaking the established sequence of higher lows.
The logic is mirrored for bearish BOS and bullish CHoCH.
Invalidation Levels: This feature identifies the last confirmed pivot before a structure break (e.g., the last ta.pivotlow before a bullish BOS) and plots a dotted line from it to the breakout bar. This level is considered the structural invalidation point for that move.
MTF Confirmation: This unique feature provides confluence by analyzing a second, lower timeframe. When a pivot (e.g., a Higher Low) is confirmed on the main chart, the script requests pivot data from the user-selected lower timeframe. If a corresponding trend reversal is detected on that lower timeframe (e.g., a break of its own minor downtrend), the pivot is labeled "Firm" (FHL); otherwise, it is labeled "Soft" (SHL).
KEY FEATURES
This indicator is packed with advanced features designed to provide a deeper level of market insight:
Dynamic Structure Lines: BOS and CHoCH levels are plotted with clean, dashed lines that dynamically start at the old pivot and terminate precisely at the breakout bar, keeping the chart clean and precise.
Invalidation Levels: For every structure break, the indicator can plot a dotted "Invalidation" line (INV). This marks the critical support or resistance pivot that, if broken, would negate the previous move, providing a clear reference for risk management.
Multi-Timeframe (MTF) Confirmation: Add a layer of confluence to your analysis by confirming pivots on a lower timeframe. The indicator can label Higher Lows and Lower Highs as either "Firm" (FHL/FLH) if confirmed by a reversal on a lower timeframe, or "Soft" (SHL/SLH) if not.
Flexible Pivot Detection: Fully adjustable Pivot Lookback settings for the left and right sides allow you to tune the indicator's sensitivity to match any timeframe or trading style, from long-term investing to short-term scalping.
Full Customization: Take complete control of the indicator's appearance. A dedicated style menu allows you to customize the colors for all bullish, bearish, and reversal elements, including the transparency of the trend-based candle coloring.
HOW TO USE
Trend Identification: Use the sequence of HH/HL and LL/LH, along with the trend-colored candles, to quickly assess the current market direction on any timeframe.
Entry Signals: A confirmed BOS can signal a potential entry in the direction of the trend. A CHoCH can signal a potential reversal, offering an opportunity to enter a new trend early.
Risk Management: Use the automatically plotted "Invalidation" (INV) lines as a logical reference point for placing stop losses. A break of this level indicates that the structure you were trading has failed.
Confluence: Use the "Firm" pivot signals from the MTF analysis to identify high-probability swing points that are supported by price action on multiple timeframes.
SETTINGS BREAKDOWN
Pivot Lookback Left/Right: Controls the sensitivity of pivot detection. Higher numbers find more significant (but fewer) pivots.
MTF Confirmation: Enable/disable the "Firm" vs. "Soft" pivot analysis and select your preferred lower timeframe for confirmation.
Style Settings: Customize all colors and the transparency of the candle coloring to match your chart's theme.
Show Invalidation Levels: Toggle the visibility of the dotted invalidation lines.
This indicator is a powerful tool for visualizing and trading with the trend. Experiment with the settings to find a configuration that best fits your personal trading strategy.

Iani SMC Sniper XAU v2.2 (Long+Short + News Countdown, v6)Iani SMC Sniper v2.6 — Anytime • Auto Pip • FVG 50% • OB • News Panel
Smart-Money Concepts made simple for intraday XAU/USD (works on any symbol).
Finds BOS, 50% FVG “sniper” entries, optional Order Blocks, London H/L, news countdown, and a mini info panel.
What it does
BOS (Break of Structure): detects bullish/bearish BOS after London sweep logic.
FVG 50% entries: plots precise long/short entry dots at the midpoint of the gap.
Auto TP/SL: TP = RR × risk, SL below/above recent swing with a small buffer.
Order Blocks (optional): marks the last opposite candle after BOS and alerts on OB revisit.
London High/Low: tracks session range; session filter is optional.
News countdown: shows next event time and minutes left (user-selectable timezone).
Mini Panel: top-left table with Trend (last BOS), Next news, R:R, Pip size.
Inputs (key)
Auto pip size: uses syminfo.mintick. Manual override available.
Risk:Reward (RR): default 2.0.
Pivot length: swing sensitivity.
Sessions: enable if you want signals only 12:00–20:00 (symbol timezone). Off = anytime.
News timezone: pick your own (e.g., Europe/Brussels, America/New_York).
Absolute & daily times: add your events (strings like 2025-09-17 20:00 or 14:30,16:00…).
Show labels/levels/OBs: toggle on/off.
Alerts included
BOS Bullish / BOS Bearish
BUY Entry / SELL Entry (return to 50% FVG)
Bullish OB revisit / Bearish OB revisit
TP Long/Short reached, SL Long/Short hit
NEWS WARNING (warning window only; does not block signals)
To use: Add Alert → Condition: this indicator → choose any of the alertconditions.
Best use
Bias: H1 for structure.
Execution: M15 (standard) or M5 (aggressive).
Works great on XAUUSD, but is symbol-agnostic (auto pip adapts).
Notes
News times display in the timezone you pick in settings.
OBs are a simple implementation meant for quick visual guidance.
Labels: BUY/SELL near entries, TP/SL on set and when hit, BOS up/down.
Risk disclaimer
This tool is for education only. Not financial advice. Backtest and manage risk.

Market Structure Break Targets [UAlgo]The "Market Structure Break Targets " indicator is designed to identify and visualize key market structure points such as Market Structure Breaks (MSBs) and Break of Structures (BoS). These points are crucial for understanding market trends and potential reversal zones. By plotting these structures on the chart, traders can easily spot significant support and resistance levels, as well as potential entry and exit points.
This indicator uses a combination of swing highs and lows to determine market structures and calculates targets based on user-defined percentages or Average True Range (ATR) multipliers. It provides visual cues in the form of lines, labels, and boxes to help traders quickly interpret market conditions.
🔶 Key Features
Customizable Swing Length: Users can set the swing length to identify the pivot highs and lows, which are crucial for determining market structure.
Target Duration Bars: Defines the maximum duration (in bars) for which the targets will be considered valid.
Target Calculation Methods: The target levels are crucial for setting potential price objectives. The calculation can be based on a percentage move from the identified pivot or using the ATR to factor in market volatility. These targets help in setting realistic profit-taking levels or identifying stop-loss placements.
Bullish and Bearish Market Structure Break (MSB): Detects and highlights bullish and bearish market structure breaks with customizable colors and target percentages.
Bullish MSB
When the price closes above a significant pivot high, a bullish MSB is identified. The indicator will draw a line at this level and calculate a target based on the chosen method (percentage or ATR). The target is visualized with a dotted line, and a label "MSB" is displayed. Additionally, an order block is created at the level of the bullish MSB. This order block is highlighted with a semi-transparent box, representing a potential area where price might find support in the future.
Bearish MSB
Conversely, when the price closes below a significant pivot low, a bearish MSB is marked. Similar to bullish MSBs, targets are calculated and displayed on the chart. An order block is also generated at the level of the bearish MSB, visualized with a semi-transparent box. This box highlights a potential resistance area where price might face selling pressure.
Bullish and Bearish Break of Structure (BoS): Identifies break of structures for both bullish and bearish scenarios, providing additional target levels.
Bullish BoS
If the price continues to rise and breaks another significant level, a bullish BoS is detected. This break is also marked with lines and labels, providing additional target levels for traders. An order block is created at the BoS level, serving as a potential support zone.
Bearish BoS
If the price falls further after a bearish MSB, a bearish BoS is identified and visualized similarly. The indicator creates an order block at the BoS level, which acts as a potential resistance zone.
🔶 Disclaimer:
Use with Caution: This indicator is provided for educational and informational purposes only and should not be considered as financial advice. Users should exercise caution and perform their own analysis before making trading decisions based on the indicator's signals.
Not Financial Advice: The information provided by this indicator does not constitute financial advice, and the creator (UAlgo) shall not be held responsible for any trading losses incurred as a result of using this indicator.
Backtesting Recommended: Traders are encouraged to backtest the indicator thoroughly on historical data before using it in live trading to assess its performance and suitability for their trading strategies.
Risk Management: Trading involves inherent risks, and users should implement proper risk management strategies, including but not limited to stop-loss orders and position sizing, to mitigate potential losses.
No Guarantees: The accuracy and reliability of the indicator's signals cannot be guaranteed, as they are based on historical price data and past performance may not be indicative of future results.

Close-Only Market StructureDYOR NFA
Function of the Close-Only Market Structure Script
The script is a custom indicator designed to display the market's structural trend based only on closing prices, ignoring price wicks (highs and lows) to focus on conviction.
pivotLengthInt Input: This user setting controls the sensitivity of the structure detection. It determines how many bars to look left and right to define a swing point (e.g., a setting of 5 means a bar's close must be the highest/lowest of the 5 preceding and 5 succeeding bars).
Swing Point Identification (SH/SL): It uses the ta.pivothigh() and ta.pivotlow() functions on the close price series to define Swing Highs (SH) and Swing Lows (SL).
Structure Tracking (structureType): It compares the most recent confirmed SH and SL against the immediately preceding ones (prevSH and prevSL) to classify the trend as one of the following four states:
HH (Higher High, Higher Low): Strong Uptrend
LL (Lower High, Lower Low): Strong Downtrend
HL/LH: Complex structure, consolidation, or reversal zones.
Structure Lines: It plots two continuous stepped lines (lastSH and lastSL) that hold the price of the most recent confirmed swing points, visually defining the current structure boundaries.
BOS Detection (Break of Structure): It identifies and plots a marker (BOS) when the current bar's close definitively breaks (closes above) the lastSH or closes below the lastSL, signaling a continuation of the trend or a major structural change.
Visual Confirmation:
Plots small SH/SL labels at the confirmed swing points.
Plots small HH/HL/LH/LL labels at the swing points to show the confirmed structural state.
Applies a light background color (green for bullish/ranging-up, red for bearish/ranging-down) for an at-a-glance view of the bias.
Alerts: It provides conditions for setting up notifications when a Bullish BOS or Bearish BOS occurs.
🚀 How to Use the Script
Open TradingView: Go to the chart where you want to apply the indicator.
Open Pine Editor: Click the Pine Editor tab at the bottom of the screen.
Paste and Save:
Copy the final, corrected Pine Script code.
Delete any existing code in the editor and paste the new code.
Click the Save button (or name the script) and then click Add to Chart.
Adjust Settings:
On the chart, hover over the indicator name ("Close-MS v6") and click the Gear Icon (Settings).
Pivot Lookback (L&R): Change this value to adjust sensitivity:
Smaller number (e.g., 3): More swings detected, structure changes faster, more noise.
Larger number (e.g., 10): Fewer swings detected, structure is more significant, less noise (recommended for higher timeframes).
Interpret the Chart:
The Red Stepped Line shows your current resistance (SH).
The Green Stepped Line shows your current support (SL).
Green Background: General bullish bias (making Higher Highs/Lows).
Red Background: General bearish bias (making Lower Highs/Lows).
BOS Triangle: Signals that the price has closed and validated a break of the previous structural high or low.
Set Alerts (Optional):
Click the Alert button (bell icon) on the TradingView toolbar.
Set the Condition to the indicator ("Close-MS v6").
Select the specific Alert Condition you want to monitor (e.g., "Bullish BOS" or "Bearish BOS").

Smart Money Trades Pro [BOSWaves]Smart Money Trades Pro – Advanced Market Structure & Liquidity Visualizer
Overview
Smart Money Trades Pro is a comprehensive trading tool designed for traders seeking an in-depth understanding of market structure, liquidity dynamics, and institutional flow. The indicator systematically identifies key market turning points, including break of structure (BOS) and change of character (CHoCH) events, and overlays these with adaptive visualizations to highlight high-probability trade setups. By integrating ATR-based risk zones, progressive take-profit levels, and real-time trade analytics, Smart Money Trades Pro transforms complex price action into an interpretable framework suitable for multiple trading styles, including scalping, intraday, and swing trading.
Unlike traditional static indicators, Smart Money Trades Pro adapts continuously to market conditions. It evaluates swing highs and lows over a configurable lookback period, then determines structural breaks using customizable confirmation methods (candle body or wick). The resulting signals are augmented with dynamic entry, stop-loss, and target levels, allowing traders to analyze potential trade opportunities with both precision and context. The indicator’s design ensures that each visual element—trend-colored candles, signal markers, and risk/reward boxes—reflects real-time market conditions, offering an actionable interpretation of institutional activity.
How It Works
The indicator’s foundation is built upon market structure analysis. By calculating pivot highs and lows over a specified period, Smart Money Trades Pro identifies potential points of liquidity accumulation and exhaustion. When price breaks a pivot high or low, the indicator evaluates whether this constitutes a BOS or a CHoCH, signaling trend continuation or reversal. These events are marked on the chart with distinct visual cues, allowing traders to quickly discern shifts in market sentiment without manually analyzing historical price action.
Once a structural break is confirmed, the indicator automatically determines entry levels, stop-loss placements, and progressive take-profit zones (TP1, TP2, TP3). These calculations are based on ATR-derived volatility, ensuring that targets scale with current market conditions. Risk and reward zones are plotted as shaded boxes, providing a clear visual representation of potential profit relative to risk for each trade setup. This system allows traders to maintain discipline and consistency, with dynamic trade management baked directly into the visualization.
Trend direction is further reinforced by color-coded candles, which reflect the prevailing market bias. Bullish trends are represented by one color, bearish trends by another, and neutral conditions are displayed in muted tones. This continuous visual feedback simplifies the process of trend assessment and helps confirm the validity of trade setups alongside BOS and CHoCH markers.
Signals and Breakouts
Smart Money Trades Pro includes structured visual signals to indicate actionable price movements:
Bullish Break Signals – Triangular markers below the candle appear when a swing high is broken, suggesting potential long opportunities.
Bearish Break Signals – Triangular markers above the candle appear when a swing low is broken, indicating potential short setups.
Change of Character (CHoCH) – Special markers highlight trend reversals, showing where momentum shifts from bullish to bearish or vice versa.
These markers are strategically spaced to prevent overlap and remain clear during high-volatility periods. Traders can use them in combination with trend-colored candles, risk/reward zones, and ATR-based targets to assess the strength and reliability of each setup. The integrated table provides live trade information, including entry price, stop-loss level, take-profit levels, risk/reward ratio, and trade direction, ensuring that trade decisions are informed and data-driven.
Interpretation
Trend Analysis : The indicator’s trend coloring, combined with BOS and CHoCH detection, provides an immediate view of market direction. Rising structures indicate bullish momentum, while falling structures signal bearish momentum. CHoCH markers highlight potential trend reversals or significant liquidity sweeps.
Volatility and Risk Assessment : ATR-based calculations determine stop-loss distances and target levels, giving a quantitative measure of risk relative to market volatility. Wide ATR readings indicate periods of high price fluctuation, whereas narrow readings suggest consolidation and reduced risk exposure.
Market Structure Insights : By monitoring swing highs and lows alongside break confirmations, traders can identify where institutional players are likely active. Areas with multiple structural breaks or overlapping targets can indicate liquidity hotspots, potential reversal zones, or areas of market congestion.
Trade Management : The built-in trade zones allow traders to visualize entry, risk, and reward simultaneously. Progressive targets (TP1, TP2, TP3) reflect incremental profit-taking strategies, while dynamic stop-loss levels help preserve capital during adverse moves.
Strategy Integration
Smart Money Trades Pro supports a range of trading approaches:
Trend Following : Enter trades in the direction of confirmed BOS while using CHoCH markers and trend-colored candles to validate momentum.
Pullback Entries : Use failed breakout retests or minor reversals toward broken structure levels for lower-risk entries.
Mean Reversion : In consolidated zones with narrow ATR and repeated BOS/CHoCH activity, anticipate reversals or short-term corrective moves.
Multi-Timeframe Confirmation : Overlay signals on higher or lower timeframes to filter noise and improve trade accuracy.
Stop-loss levels should be placed just beyond the opposing structural point, while take-profit targets can be scaled using the ATR-based zones. Progressive targets allow for partial exits or scaling out of trades while maintaining exposure to larger moves.
Advanced Techniques
Traders seeking greater precision can combine Smart Money Trades Pro with volume, momentum, or volatility indicators to validate signals. Observing sequences of BOS and CHoCH markers across multiple timeframes provides insight into liquidity accumulation and depletion trends. Tracking the expansion or contraction of ATR-based zones helps anticipate shifts in volatility, enabling better timing for entries and exits.
Customizing the structure period and confirmation type allows the indicator to adapt to different asset classes and timeframes. Shorter periods increase sensitivity to smaller swings, while longer periods filter noise and emphasize higher-probability structural breaks. By integrating these features, the indicator offers a robust statistical framework for disciplined, data-driven trading decisions.
Inputs and Customization
Structure Detection Period : Defines the lookback window for pivot high and low calculation.
Break Confirmation : Choose whether to confirm breaks using candle body or wick.
Display CHoCH : Toggle visibility of change-of-character markers.
Color Trend Bars : Enable color-coding of candles based on market structure direction.
Show Info Table : Display trade dashboard showing entry, stop-loss, take-profits, risk/reward, and bias.
Table Position : Choose from top-left, top-right, bottom-left, or bottom-right placement.
Color Customization : Configure bullish, bearish, neutral, risk, reward, and text colors for enhanced visual clarity.
Why Use Smart Money Trades Pro
Smart Money Trades Pro transforms complex market behavior into an actionable visual framework. By combining market structure analysis, liquidity tracking, ATR-based risk/reward mapping, and a dynamic trade dashboard, it provides a multidimensional view of the market. Traders can focus on execution, interpret trends, and evaluate overextensions or reversals without relying on guesswork. The indicator is suitable for scalping, intraday, and swing strategies, offering a comprehensive system for understanding and trading alongside institutional participants.

XAUUSD Strength Dashboard with VolumeXAUUSD Strength Dashboard with Volume Analysis
📌 Description
This advanced Pine Script indicator provides a multi-timeframe dashboard for XAUUSD (Gold vs. USD), combining price action analysis with volume confirmation to generate high-probability trading signals. It detects:
✅ Break of Structure (BOS)
✅ Fair Value Gaps (FVG)
✅ Change of Character (CHOCH)
✅ Trendline Breaks (9/21 SMA Crossover)
✅ Volume Spikes (Confirmation of Strength)
The dashboard displays strength scores (0-100%) and action recommendations (Strong Buy/Buy/Neutral/Sell/Strong Sell) across multiple timeframes, helping traders identify confluences for better trade decisions.
🎯 How It Works
1. Multi-Timeframe Analysis
Fetches data from 1m, 5m, 15m, 30m, 1h, 4h, Daily, and Weekly timeframes.
Compares trend direction, BOS, FVG, CHOCH, and volume spikes across all timeframes.
2. Volume-Confirmed Strength Score
The Strength Score (0-100%) is calculated using:
Trend Direction (25 points) → 9 SMA vs. 21 SMA
Break of Structure (20 points) → New highs/lows with momentum
Fair Value Gaps (10 points) → Imbalance zones
Change of Character (10 points) → Shift in market structure
Trendline Break (20 points) → SMA crossover confirmation
Volume Spike (15 points) → High volume confirms moves
Score Interpretation:
≥75% → Strong Buy (High confidence bullish move)
60-74% → Buy (Bullish but weaker confirmation)
40-59% → Neutral (No strong bias)
25-39% → Sell (Bearish but weaker confirmation)
≤25% → Strong Sell (High confidence bearish move)
3. Dashboard & Chart Markers
Dashboard Table: Shows Trend, BOS, Volume, CHOCH, TL Break, Strength %, Key Level, and Action for each timeframe.
Chart Markers:
🟢 Green Triangles → Bullish BOS
🔴 Red Triangles → Bearish BOS
🟢 Green Circles → Bullish CHOCH
🔴 Red Circles → Bearish CHOCH
📈 Green Arrows → Bullish Trendline Break
📉 Red Arrows → Bearish Trendline Break
"Vol↑" (Lime) → Bullish Volume Spike
"Vol↓" (Maroon) → Bearish Volume Spike
🚀 How to Use
1. Dashboard Interpretation
Higher Timeframes (D/W) → Show the dominant trend.
Lower Timeframes (1m-4h) → Help with entry timing.
Strength Score ≥75% or ≤25% → Look for high-confidence trades.
Volume Spikes → Confirm breakouts/reversals.
2. Trading Strategy
📈 Long (Buy) Setup:
Higher TFs (D/W/4h) show bullish trend (↑).
Current TF has BOS & Volume Spike.
Strength Score ≥60%.
Key Level (Low) holds as support.
📉 Short (Sell) Setup:
Higher TFs (D/W/4h) show bearish trend (↓).
Current TF has BOS & Volume Spike.
Strength Score ≤40%.
Key Level (High) holds as resistance.
3. Customization
Adjust Volume Spike Multiplier (Default: 1.5x) → Controls sensitivity to volume spikes.
Toggle Timeframes → Enable/disable higher/lower timeframes.
🔑 Key Benefits
✔ Multi-Timeframe Confluence → Avoids false signals.
✔ Volume Confirmation → Filters low-quality breakouts.
✔ Clear Strength Scoring → Removes emotional bias.
✔ Visual Chart Markers → Easy to spot key signals.
This indicator is ideal for gold traders who follow institutional order flow, market structure, and volume analysis to improve their trading decisions.
🎯 Best Used With:
Support/Resistance Levels
Fibonacci Retracements
Price Action Confirmation
🚀 Happy Trading! 🚀

Order-Flow Market StructureOrder-Flow Market Structure by The_Forex_Steward
A precision tool for visualizing internal shifts, swing structure, BOS events, Fibonacci levels, and multi-timeframe alerts.
What It Does
The Order-Flow Market Structure indicator intelligently tracks and visualizes price structure using higher timeframe candles. It automatically detects:
• Internal bullish and bearish structure shifts
• Swing highs and lows (HH, HL, LH, LL)
• Break of Structure (BoS) confirmations
• Fibonacci retracement levels from recent swing moves
• Real-time alerts across LTF, MTF, and HTF modes
It’s a complete tool for traders who follow Smart Money Concepts, ICT, or institutional price action strategies.
How It Works
• You select a Higher Timeframe (HTF) to set the structural context
• Internal shifts are identified using HTF candle closes
• The indicator scans for swing highs/lows after each internal shift
• Breaks of previous swing points confirm BoS and plot horizontal lines
• Zigzag lines visually connect structural points (swings and BoS)
• Fibonacci levels are drawn between the latest swings
• Alerts can be configured for structure shifts, BoS events, and fib level breaks
How to Use It
Set your preferred HTF (e.g., 1H while trading on 5-minute)
Enable Fibonacci levels to visualize retracement zones
Watch for:
• Bullish internal shifts → HL to HH
• Bearish internal shifts → LH to LL
• BOS → Breakout confirmation
Enable alerts to catch structural events in real-time
Adjust the "Safe History Offset" if working with long lookbacks or volatile assets
Who It's For
• Traders using Smart Money, ICT, or market structure-based systems
• Scalpers, day traders, and swing traders
• Anyone needing precise structural insight across multiple timeframes
Features
• BoS detection with custom line styles and width
• HH, HL, LH, LL label plotting
• Optional Fibonacci retracement zones
• Custom alerts for swing shifts and fib level breaks
• LTF, MTF, and HTF alert modes
Stay aligned with structure, trade with precision, and get alerted to key shifts in real time.

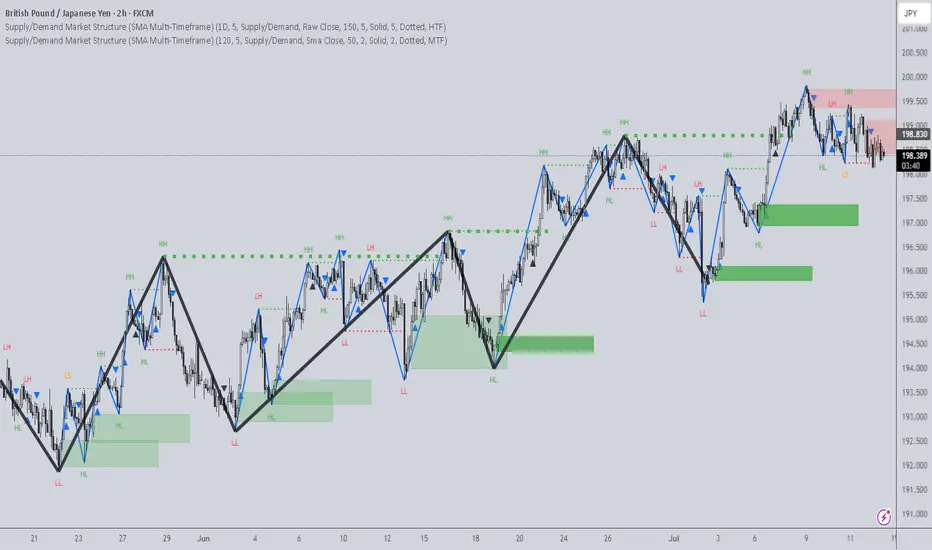
Supply/Demand Market Structure (SMA Multi-Timeframe)Supply/Demand Based Market Structure
Structure + Order Blocks from Synthetic SMA Candles
Overview:
The SMA Supply/Demand Market Structure indicator combines market structure analysis with supply/demand logic, powered by SMA-based synthetic candles . Instead of relying on raw candle data, this tool generates smoothed higher-timeframe candles using simple moving averages to identify more stable zones and cleaner structure shifts.
It detects bullish and bearish breaks of structure (BoS) , highlights swing points like HH, HL, LH, LL , and plots institutional-style supply and demand zones formed from aggressive rallies or drops. The result is a precise and noise-filtered view of market intent, perfect for trend-following or smart money strategies.
How It Works:
- Synthetic candles are created using SMA of OHLC values on your selected timeframe (HTF).
- A bullish break occurs when price closes above the high of the last bearish synthetic candle.
- A bearish break occurs when price closes below the low of the last bullish synthetic candle.
- Upon break confirmation:
- A demand zone is drawn using the last bearish candle.
- A supply zone is drawn using the last bullish candle.
- Each zone is extended forward for a user-defined number of bars and optionally deleted upon mitigation.
- Zigzag-based internal structure connects valid swing points and classifies them as HH, HL, LH, LL , including Liquidity Sweeps (LS) .
- BoS levels are highlighted with lines that automatically reset when new structure forms.
Key Features:
- Synthetic SMA Candles : Smooth and reliable structure from average-based HTF candles
- Break Modes : Choose between raw HTF closes or SMA closes for break logic
- Custom Timeframe Selection : Analyze structure across any HTF you choose
- Dynamic Supply/Demand Zones : Auto-plot boxes from valid rallies/drops
- Mitigation Detection : Optionally fade or delete zones when price trades through
- Zigzag Structure Mapping : Automatically connect structural highs/lows
- BoS Detection : Real-time breakout of swing points with visual confirmation
- Smart Labels : Marks HH, HL, LH, LL, and LS directly on the chart
- Multi-timeframe Alert System : Notify for all structural changes, BoS, and new zones
How to Use:
- Set your desired HTF and SMA Length for synthetic candle smoothing.
- Use SMA=1 for raw candles
- Select a Break Mode :
- Raw Close : Uses standard HTF close values
- SMA Close : Uses smoothed closes from SMA
- Watch for bullish or bearish breaks — zones are plotted when price confirms breakout structure.
- Use demand zones as long entry areas and supply zones as short setups on retests.
- Rely on internal shifts and zigzag swings to monitor structure continuity.
- Enable alerts for swing formations, BoS, and liquidity sweeps to trade hands-free.
Recommended Strategies:
- Smart Money & ICT Models : Use synthetic demand/supply + BoS for mitigation or continuation plays
- Swing Trading : Align with higher timeframe structure and use zones for entry triggers
- Trend Trading : Confirm structure alignment and wait for pullbacks into zones
- Reversal Entries : Trade structure breaks when zones fail and a BoS confirms the shift
Customization Options:
- Timeframe input for custom HTF control
- SMA Length to adjust candle smoothing
- Zone Style : Control zone color, transparency, and duration
- Structure Display : Toggle swing labels and zigzag visuals
- Alert Mode : Choose between LTF, MTF, or HTF alerts
Summary:
SMA Supply/Demand Market Structure provides a clean, flexible view of price structure and institutional intent by fusing market structure with SMA-based synthetic candles. It’s ideal for anyone seeking reduced noise, visually guided entries, and rule-based trading based on structural shifts and real-time demand/supply dynamics.
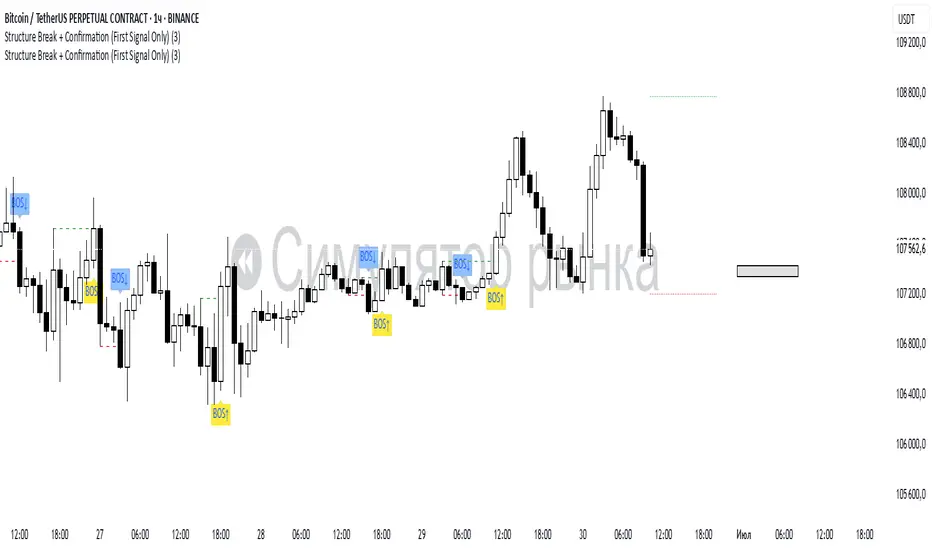
Structure Break + Confirmation (First Signal Only)Swing Detection:
A Swing High is detected when the high of the central candle (based on a lookback period) is greater than the highs of the candles before and after.
A Swing Low is detected when the low of the central candle is lower than the lows of the candles before and after.
Break of Structure (BOS):
A BOS Up is confirmed when a candle closes above the most recent swing high (with a body close).
A BOS Down is confirmed when a candle closes below the most recent swing low.
Confirmation (CONF):
A CONF Up is triggered when price makes a new high after a BOS Up.
A CONF Down is triggered when price makes a new low after a BOS Down.
Only the first confirmation after a BOS is plotted.
Visuals:
Cross marks (×) are plotted at swing points.
BOS signals are shown with green (up) and red (down) labels.
CONF signals are shown with lime (up) and orange (down) triangle markers.
Dotted lines are drawn at the levels of broken swing highs/lows.
Ultra Market StructureThe Ultra Market Structure indicator detects key market structure breaks, such as Break of Structure (BoS) and Change of Character (CHoCH), to help identify trend reversals. It plots lines and labels on the chart to visualize these breakpoints with alerts for important signals.
Introduction
This script is designed to help traders visualize important market structure events, such as trend breaks and reversals, using concepts like Break of Structure (BoS) and Change of Character (CHoCH). The indicator highlights internal and external price levels where the market shifts direction. It offers clear visual signals and alerts to keep traders informed of potential changes in the market trend.
Detailed Description
The indicator focuses on detecting "market structure breaks," which occur when the price moves past significant support or resistance levels, suggesting a potential reversal or continuation of the trend.
.........
Type of structure
Internal Structure: Focuses on smaller, shorter-term price levels within the current market trend.
External Structure: Focuses on larger, longer-term price levels that may indicate more significant shifts in the market.
.....
Key events
Break of Structure (BoS): A market structure break where the price surpasses a previous high (bullish BoS) or low (bearish BoS).
Change of Character (CHoCH): A shift in market behavior when the price fails to continue in the same direction, indicating a possible trend reversal.
Once a break or shift is detected, the script plots lines and labels on the chart to visually mark the breakpoints.
It also provides alerts when a BoS or CHoCH occurs, keeping traders informed in real-time.
The indicator can color the background and candles based on the market structure, making it easy to identify the current trend.
.....
Special feature
At news events or other momentum pushes most structure indicators will go into "sleep mode" because of too far away structure highs/lows. This indicator has a structure reset feature to solve this issue.
.........
Detects Break of Structure (BoS) and Change of Character (CHoCH) signals.
Marks internal and external support/resistance levels where market trends change.
Provides visual cues (lines, labels) and real-time alerts for structure breaks.
Offers background and candle color customization to highlight market direction.

Fair Value Gaps Setup 01 [TradingFinder] FVG Absorption + CHoCH🔵 Introduction
🟣 Market Structures
Market structures exhibit a fractal and nested nature, which leads us to classify them into internal (minor) and external (major) categories. Definitions of market structure vary, with different methodologies such as Smart Money and ICT offering distinct interpretations.
To identify market structure, the initial step involves examining key highs and lows. An uptrend is characterized by successive highs and lows that are higher than their predecessors. Conversely, a downtrend is marked by successive lows and highs that are lower than their previous counterparts.
🟣 Market Trends and Movements
Market trends consist of two primary types of movements :
Impulsive Movements : These movements align with the main trend and are characterized by high strength and momentum.
Corrective Movements : These movements counter the main trend and are marked by lower strength and momentum.
🟣 Break of Structure (BOS)
In a downtrend, a Break of Structure (BOS) occurs when the price falls below the previous low and establishes a new low (LL). In an uptrend, a BOS, also known as a Market Structure Break (MSB), happens when the price rises above the last high.
To confirm a trend, at least one BOS is necessary, which requires the price to close at least one candle beyond the previous high or low.
🟣 Change of Character (CHOCH)
Change of Character (CHOCH) is a crucial concept in market structure analysis, indicating a shift in trend. A trend concludes with a CHOCH, also referred to as a Market Structure Shift (MSS).
For example, in a downtrend, the price continues to drop with BOS, showcasing the trend's strength. However, when the price rises and exceeds the last high, a CHOCH occurs, signaling a potential transition from a downtrend to an uptrend.
It is essential to note that a CHOCH does not immediately indicate a buy trade. Instead, it is prudent to wait for a BOS in the upward direction to confirm the uptrend. Unlike BOS, a CHOCH confirmation does not require a candle to close; merely breaking the previous high or low with the candle's wick is sufficient.
🟣 Spike | Inefficiency | Imbalance
All these terms mean fast price movement in the shortest possible time.
🟣 Fair Value Gap (FVG)
To pinpoint the "Fair Value Gap" (FVG) on a chart, a detailed candle-by-candle analysis is necessary. This process involves focusing on candles with substantial bodies and evaluating them in relation to the candles immediately before and after them.
Here are the steps :
Identify the Central Candle : Look for a candle with a large body.
Examine Adjacent Candles : The candles before and after this central candle should have long shadows, and their bodies must not overlap with the body of the central candle.
Determine the FVG Range : The distance between the shadows of the first and third candles defines the FVG range.
This method helps in accurately identifying the Fair Value Gap, which is crucial for understanding market inefficiencies and potential price movements.
🟣 Setup
This setup is based on Market Structure and FVG. After a change of character and the formation of FVG in the last lag of the price movement, we are looking for trading positions in the price pullback.
Bullish Setup :
Bearish Setup :
🔵 How to Use
After forming the setup, you can enter the trade using a pending order or after receiving confirmation. To increase the probability of success, you can adjust the pivot period market structure settings or modify the market movement coefficient in the formation leg of the FVG.
Bullish Setup :
Bearish Setup :
🔵 Setting
Pivot Period of Market Structure Detector :
This parameter allows you to configure the zigzag period based on pivots. Adjusting this helps in accurately detecting order blocks.
Show major Bullish ChoCh Lines :
You can toggle the visibility of the Demand Main Zone and "ChoCh" Origin, and customize their color as needed.
Show major Bearish ChoCh Lines :
Similar to the Demand Main Zone, you can control the visibility and color of the Supply Main Zone and "ChoCh" Origin.
FVG Detector Multiplier Factor :
This feature lets you adjust the size of the moves forming the Fair Value Gaps (FVGs) using the Average True Range (ATR). The default value is 1, suitable for identifying most setups. Adjust this value based on the specific symbol and market for optimal results.
FVG Validity Period :
This parameter defines the validity period of an FVG in terms of the number of candles. By default, an FVG remains valid for up to 15 candles, but you can adjust this period as needed.
Mitigation Level FVG :
This setting establishes the basic level of an FVG. When the price reaches this level, the FVG is considered mitigated.
Level in Low-Risk Zone :
This feature aims to reduce risk by dividing the FVG into two equal areas: "Premium" (upper area) and "Discount" (lower area). For lower risk, ensure that "Demand FVG" is in the "Discount" area and "Supply FVG" in the "Premium" area. This feature is off by default.
Show or Hide :
Given the potential abundance of setups, displaying all on the chart can be overwhelming. By default, only the last setup is shown, but you can enable the option to view all setups.
Alert Settings :
On / Off : Toggle alerts on or off.
Message Frequency : Determine how often alerts are triggered.
Options include :
"All" (alerts every time the function is called)
"Once Per Bar" (alerts only on the first call within the bar)
"Once Per Bar Close" (alerts only at the last script execution of the real-time bar upon closing)
The default setting is "Once Per Bar".
Show Alert Time by Time Zone : Set the alert time based on your preferred time zone, such as "UTC-4" for New York time. The default is "UTC".
Display More Info : Optionally show additional details like the price range of the order blocks and the date, hour, and minute in the alert message. Set this to "Off" if you prefer not to receive this information.

FX OSINT - Institutional Midnight Intelligence For ForexFX OSINT — Institutional Midnight Intelligence For Forex
See Your FX Charts Like an Intelligence Briefing, Not a Guess
If you’ve ever stared at EURUSD or GBPJPY and thought:
Where is the real liquidity?
Is this move sponsored by smart money or just noise?
Am I buying into premium or discount?
…then FX OSINT is designed for you.
FX OSINT (Forex Open Source Intelligence) treats the FX market the way an analyst treats an investigation:
Collect open‑source signals from price, time, and volatility.
Map out liquidity, structure, and sessions in a repeatable way.
Present them in a clean, non‑cluttered dashboard so you can read context quickly.
No rainbow spaghetti. No 12 indicators stacked on top of each other. Just structured information, midnight visuals, and a clear read on what the market is doing right now.
Why FX OSINT Exists
Many FX traders run into the same problems:
Overloaded charts – multiple indicators fighting for space, none talking to each other.
Signals with no context – arrows that ignore structure, sessions, and liquidity.
Tools not tuned for FX – generic indicators that don’t care what pair you are on.
FX OSINT brings this together into one FX‑focused framework that:
Understands structure : BOS/CHOCH, swings, and trend across multiple timeframes.
Respects liquidity : sweeps, order blocks, and FVGs with controlled visibility.
Reads volatility & ADR : how far today’s range has developed.
Knows the clock : London, New York, and key killzones.
Scores confluence : a 0–100 engine that summarizes how much is lining up.
FX OSINT is built for traders who want structured, institutional‑style logic with a disciplined, midnight‑themed UI —not flashing buy/sell buttons.
1. Midnight Dashboard — Top‑Right Intelligence Panel
This panel acts as your compact “situation room”:
CONFLUENCE — 0–100 score blending trend alignment, volatility regime, sessions, liquidity events, order blocks, FVGs, and ADR context.
REGIME — Low / Building / Normal / Expansion / Extreme, driven by ATR relationships, so you know if you’re in chop, trend, or expansion.
HTF / MTF / LTF TREND — Higher‑, medium‑, and current‑timeframe bias in one place, so you see if you are trading with or against the larger flow.
ADR USED — How much of today’s typical range has already been consumed in percentage terms.
PIP VALUE — Approximate pip size per pair, including JPY‑style pairs.
Everything is bold, legible, and color‑coded, but the layout stays minimal so you can:
Look once → understand the context.
2. Structure, BOS, CHOCH — Smart‑Money‑Style Skeleton
FX OSINT tracks swing highs and lows, then shows how structure evolves:
Trend logic based on evolving swings, not just a moving average cross.
BOS (Break of Structure) when price expands in the direction of trend.
CHOCH (Change of Character) when behavior flips and the market structure changes.
Labels are selective, not spammy . You don’t get a tag on every minor wiggle—only when structure meaningfully shifts, so it’s easier to answer:
"Are we continuing the current leg, or did something actually change here?"
3. Liquidity Sweeps, Order Blocks & FVGs — The OSINT Layer
FX OSINT treats liquidity as a key information layer:
Liquidity sweeps — Detects when price spikes through recent highs/lows and then snaps back, flagging potential stop runs.
Order blocks — The last opposite candle before a displacement move, drawn as controlled boxes with limited lifespan to avoid clutter.
Fair Value Gaps (FVGs) — Three‑candle imbalances rendered as precise zones with a cap on how many can exist at once.
Under the hood, boxes are managed so your chart does not become a wall of old zones:
// Draw Order Blocks with overlap prevention
if isBullishOB and showOrderBlocks
if array.size(obBoxes) >= maxBoxes
oldBox = array.shift(obBoxes)
box.delete(oldBox)
newBox = box.new(bar_index , low , bar_index + obvLength, high ,
border_color = bullColor, bgcolor = bullColorTransp,
border_width = 2, extend = extend.none)
array.push(obBoxes, newBox)
Box limits keep the number of zones under control.
Borders and transparency are tuned so you still see price clearly.
You end up with a curated liquidity map , rather than a chart buried under every level price has ever touched.
4. Volatility, ADR & Sessions — Time and Range Intelligence
FX OSINT runs a Volatility Regime Analyzer and an ADR engine in the background:
Volatility regime — Five states (Low → Extreme) derived from fast vs. slow ATR.
ADR bands — Daily high/mid/low projected from the current daily open.
ADR used % — How far today’s move has traveled relative to its typical range.
On the time side:
Asia, London, New York sessions are softly highlighted with a single active background to avoid overlapping colors.
Killzones (e.g., London and New York opens) can be emphasized when you want to focus on where significant moves often begin.
Together, this helps you answer:
"What time is it in the trading day?"
"How stretched are we?"
"Is expansion just starting, or are we late to the move?"
5. ICT‑Style Add‑Ons — BOS/CHOCH, Premium/Discount, and Confluence
For modern FX / ICT‑inspired workflows, FX OSINT includes:
BOS / CHOCH labels — Clear structural shifts based on swings.
Premium / Discount zones — 25%, 50%, 75% levels of the daily range, so you know if you are buying discount in an uptrend or selling premium in a downtrend.
Confluence score — A single number summarizing how many conditions line up in the current context.
Instead of replacing your plan, FX OSINT compresses your checklist into the chart:
Structure
Liquidity
Session / Time
Volatility / ADR
Higher‑timeframe alignment
When these agree, the dashboard reflects it. When they don’t, it stays neutral and lets you see the conflict.
How To Use FX OSINT
FX OSINT is not a signal bot. It is an information engine that organizes context so you can apply your own plan.
A typical workflow might look like:
Start on higher timeframes (e.g., H4/D1) to form directional bias from structure, volatility regime, and ADR context.
Move to intraday timeframes (e.g., M15/H1) around your chosen sessions (London and/or New York).
Look for confluence :
HTF / MTF / LTF trends aligned.
Price in discount for longs or premium for shorts.
Recent liquidity sweep into a meaningful OB or FVG.
Confluence score at or above a level you consider significant.
Then refine entries using BOS/CHOCH on lower timeframes according to your own risk and execution rules.
FX OSINT aims to make sure you do not enter a trade without seeing:
Where you are in the day (ADR and sessions).
Where you are in the volatility cycle (regime).
Who currently appears in control (structure and trend).
Which liquidity was just targeted (sweeps and zones).
Design Choices and Scope
FX OSINT was designed around a few clear constraints:
FX‑focused — Logic and filters tuned for FX majors, minors, exotics, and metals. It is intended for FX markets, not for every possible asset class.
Open‑source — The full Pine Script code is available so you can read it, learn from it, and adapt it to your own workflow if needed.
Clear themes — Two main visual styles (e.g., dark institutional “midnight” and a lighter accent variant) with a focus on readability, not visual noise.
Chart‑friendly — Panels use fixed areas, session highlights avoid overlapping, and boxes are capped/pruned so the chart remains usable.
FX OSINT is for only Forex pairs, not anything else!
Hope you enjoyed and remember your Open Source Intelligence Matters 😉!
-officialjackofalltrades

Smart Structure Pro - Market Structure & Smart Money Concepts═══════════════════════════════════════════════════════════════════════════════
SMART STRUCTURE PRO
═══════════════════════════════════════════════════════════════════════════════
A comprehensive market structure analysis tool that identifies institutional trading
patterns and smart money concepts for improved trade timing and decision-making.
═══════════════════════════════════════════════════════════════════════════════
📊 WHAT IT DOES
═══════════════════════════════════════════════════════════════════════════════
This indicator automatically detects and visualizes key market structure elements:
🔹 BOS (Break of Structure)
- Identifies trend continuation patterns
- Marks when price breaks above previous highs (bullish) or below previous lows (bearish)
- Confirms trend strength and momentum
🔹 CHoCH (Change of Character)
- Detects potential trend reversals
- Alerts when market structure shifts from bullish to bearish or vice versa
- Helps identify early reversal opportunities
🔹 Order Blocks
- Highlights institutional entry zones
- Identifies the last opposite candle before a structure break
- Shows areas where smart money likely entered positions
🔹 Fair Value Gaps (FVG)
- Detects price imbalances and inefficiencies
- Shows areas where price moved rapidly leaving gaps
- Often act as support/resistance when retested
🔹 Liquidity Zones
- Marks swing high and low levels
- Identifies areas where stop losses likely cluster
- Shows potential stop hunt and liquidity grab zones
═══════════════════════════════════════════════════════════════════════════════
🎯 HOW TO USE
═══════════════════════════════════════════════════════════════════════════════
BULLISH SETUP:
1. Wait for Bullish CHoCH (trend reversal signal) or BOS ↑ (continuation)
2. Look for price to pull back into an Order Block or Fair Value Gap
3. Enter long when price bounces from these zones
4. Place stop loss below the Order Block
5. Target the next liquidity zone or resistance level
BEARISH SETUP:
1. Wait for Bearish CHoCH (trend reversal signal) or BOS ↓ (continuation)
2. Look for price to retrace into an Order Block or Fair Value Gap
3. Enter short when price rejects from these zones
4. Place stop loss above the Order Block
5. Target the next liquidity zone or support level
DASHBOARD INTERPRETATION:
• Trend: Current market direction (Bullish/Bearish)
• Volume: Confirmation strength (High volume = stronger signals)
• Signal: Latest structure break detected
• Key High/Low: Critical levels for the current trend
• Position: Price location (Premium = expensive, Discount = cheap)
═══════════════════════════════════════════════════════════════════════════════
⚙️ SETTINGS GUIDE
═══════════════════════════════════════════════════════════════════════════════
STRUCTURE DETECTION:
• Pivot Length (Default: 10)
- Lower values = More signals but potentially weaker
- Higher values = Fewer signals but stronger/more reliable
- Recommended: 8-12 for intraday, 10-15 for higher timeframes
• Structure Line Extension
- Visual preference for how far lines extend
- Does not affect signal detection
SMART MONEY CONCEPTS:
• Order Block Extension: How long OB boxes remain visible
• FVG Extension: How long gap boxes remain visible
• Min FVG Size: Filter out small gaps (0 = show all)
- Set to 10-20% to reduce noise
- Set to 0 to see all gaps
VOLUME FILTER:
• Volume Confirmation (Recommended: ON)
- Filters weak signals without volume support
- Reduces false breakouts
• Volume Multiplier (Default: 1.5)
- Higher = Stricter filtering (fewer but stronger signals)
- Lower = More signals (but may include weak ones)
DISPLAY:
• Dashboard: Toggle information panel
• Trend Background: Subtle color tint showing current trend
• Dashboard Position: Choose corner placement
═══════════════════════════════════════════════════════════════════════════════
🔔 ALERTS
═══════════════════════════════════════════════════════════════════════════════
Available alert conditions:
✓ Bullish BOS - Uptrend continuation confirmed
✓ Bearish BOS - Downtrend continuation confirmed
✓ Bullish CHoCH - Reversal to uptrend detected
✓ Bearish CHoCH - Reversal to downtrend detected
✓ Structure Break - Any significant market structure change
To set up alerts:
1. Click the "⏰" alert icon
2. Select "Smart Structure Pro"
3. Choose your desired condition
4. Configure notification method
5. Click "Create"
═══════════════════════════════════════════════════════════════════════════════
⚠️ IMPORTANT DISCLOSURES
═══════════════════════════════════════════════════════════════════════════════
REPAINTING BEHAVIOR:
• Pivot points WILL repaint until confirmed (this is by design and unavoidable)
• Structure breaks (BOS/CHoCH) use CLOSED candles and do NOT repaint after confirmation
• Order Blocks and FVGs are drawn on confirmed signals and do NOT repaint
• All signals wait for candle close before triggering
BEST PRACTICES:
• Use on higher timeframes (15min+) for more reliable signals
• Combine with other analysis (support/resistance, volume profile, etc.)
• Wait for candle close confirmation before acting on signals
• Use proper risk management - this is not a standalone trading system
• Backtest on your preferred instrument and timeframe
PERFORMANCE:
• Limited to 100 boxes, 100 lines, 100 labels for optimal performance
• Older objects automatically removed as new ones appear
• Works on all markets (Forex, Crypto, Stocks, Indices, Commodities)
═══════════════════════════════════════════════════════════════════════════════
📚 CONCEPTS EXPLAINED
═══════════════════════════════════════════════════════════════════════════════
MARKET STRUCTURE:
Market structure refers to the pattern of price movements creating swing highs
and lows. Understanding structure helps identify trend direction and potential
reversal points.
SMART MONEY CONCEPTS:
These are trading techniques based on tracking institutional order flow and
understanding where large players (banks, funds, institutions) enter and exit
positions.
ORDER BLOCKS:
The last opposing candle before a strong directional move. Institutions often
leave unfilled orders in these zones, which can act as support/resistance when
price returns.
FAIR VALUE GAPS:
Areas where price moved so quickly that it left an imbalance. These gaps often
get "filled" as price returns to find equilibrium, creating trading opportunities.
═══════════════════════════════════════════════════════════════════════════════
🎓 EDUCATIONAL VALUE
═══════════════════════════════════════════════════════════════════════════════
This indicator helps traders:
✓ Understand market structure mechanics
✓ Identify institutional trading patterns
✓ Improve trade timing and entry precision
✓ Recognize trend continuation vs reversal
✓ Learn smart money concepts through visualization
═══════════════════════════════════════════════════════════════════════════════
📋 TECHNICAL DETAILS
═══════════════════════════════════════════════════════════════════════════════
• Version: 1.0.0
• Pine Script Version: 5
• Indicator Type: Overlay
• No Repainting: Structure breaks use confirmed candles
• Performance Optimized: Limited drawing objects
• Works On: All markets and timeframes
• Alerts: Yes, fully customizable
═══════════════════════════════════════════════════════════════════════════════
👤 AUTHOR
═══════════════════════════════════════════════════════════════════════════════
Created by: Zakaria Safri
Original Work: All code and concepts are original implementations
Based On: ICT (Inner Circle Trader) educational concepts
License: © 2024 Zakaria Safri - Personal Use Only
═══════════════════════════════════════════════════════════════════════════════
⚖️ DISCLAIMER
═══════════════════════════════════════════════════════════════════════════════
This indicator is for educational and informational purposes only. It does not
constitute financial advice. Trading involves substantial risk of loss. Past
performance does not guarantee future results. Always conduct your own research
and consult with a licensed financial advisor before making trading decisions.
The author is not responsible for any losses incurred from using this indicator.
═══════════════════════════════════════════════════════════════════════════════
If you find this indicator helpful, please:
👍 Like and favorite
⭐ Leave a review
📢 Share with other traders
💬 Comment with feedback or suggestions
Happy Trading! 📈

SMC Structures and Multi-Timeframe FVG PYSMC Structures and Multi-Timeframe FVG Indicator
Tip: For optimal performance, adjust the number of FVGs displayed per timeframe in the settings. On high-performance devices, up to 8 FVGs per timeframe can be used without issues. If you experience slowdowns, reduce to 3 or 4 FVGs per timeframe. If the chart flashes, disable indicators one by one to identify conflicts, or try using the TradingView Mobile or Windows App for a smoother experience.
Overview
This Pine Script indicator enhances market analysis by integrating Smart Money Concepts (SMC) with Fair Value Gaps (FVG) across multiple timeframes. It identifies trend continuations (Break of Structure, BOS) and trend reversals (Change of Character, CHoCH) while highlighting liquidity zones through FVG detection. The indicator includes eight customizable Moving Average (MA) curve templates, disabled by default, to complement SMC and FVG analysis. Its originality lies in combining multi-timeframe FVG detection with SMC structure analysis, providing traders with a cohesive tool to visualize price action patterns and liquidity zones efficiently.
Features and Functionality
1. Fair Value Gaps (FVG)
The indicator detects and displays bullish, bearish, and mitigated FVGs, representing liquidity zones where price inefficiencies occur. These gaps are dynamically updated based on price action:
Bullish FVG: Displayed in green when unmitigated, indicating potential upward liquidity zones.
Bearish FVG: Displayed in red when unmitigated, signaling potential downward liquidity zones.
Mitigated FVG: Shown in gray once the gap is partially filled by price action.
Fully Mitigated FVG: Automatically removed from the chart when the gap is fully filled, reducing visual clutter.
Users can customize the number of historical FVGs displayed via the settings, allowing focus on recent liquidity zones for targeted analysis.
2. SMC Structures
The indicator identifies key SMC price action patterns:
Break of Structure (BOS): Marked with gray lines, indicating trend continuation when price breaks a significant high or low.
Change of Character (CHoCH): Highlighted with yellow lines, signaling potential trend reversals when price fails to maintain the current structure.
High/Low Values: Blue lines denote the highest high and lowest low of the current structure, providing reference points for market context.
3. Multi-Timeframe FVG Analysis
A standout feature is the ability to analyze FVGs across multiple timeframes simultaneously. This allows traders to align higher-timeframe liquidity zones with lower-timeframe entries, improving trade precision. The indicator fetches FVG data from user-selected timeframes, displaying them cohesively on the chart.
4. Moving Average (MA) Templates
The indicator includes eight customizable MA curve templates in the Settings > Template section, disabled by default. These templates allow users to overlay MAs (e.g., SMA, EMA, WMA) to complement SMC and FVG analysis. Each template is pre-configured with different periods and types, enabling quick adaptation to various trading strategies, such as trend confirmation or dynamic support/resistance.
How It Works
The script processes price action to detect FVGs by analyzing three-candle patterns where a gap forms between the high/low of the first and third candles. Multi-timeframe data is retrieved using Pine Script’s request.security() function, ensuring accurate FVG plotting across user-defined timeframes. BOS and CHoCH are identified by tracking swing highs and lows, with logic to differentiate trend continuation from reversals. The MA templates are computed using standard Pine Script TA functions, with user inputs controlling visibility and parameters.
How to Use
Add to Chart: Apply the indicator to any TradingView chart.
Configure Settings:
FVG Settings: Adjust the number of historical FVGs to display (default: 10). Enable/disable specific FVG types (bullish, bearish, mitigated).
Timeframe Selection: Choose up to three timeframes for FVG analysis (e.g., 1H, 4H, 1D) to align with your trading strategy.
Structure Settings: Toggle BOS (gray lines) and CHoCH (yellow lines) visibility. Adjust sensitivity for structure detection if needed.
MA Templates: Enable MA curves via the Template section. Select from eight pre-configured MA types and periods to suit your analysis.
Interpret Signals:
Use green/red FVGs for potential entry points targeting liquidity zones.
Monitor gray lines (BOS) for trend continuation and yellow lines (CHoCH) for reversal signals.
Align multi-timeframe FVGs with BOS/CHoCH for high-probability setups.
Optionally, use MA curves for trend confirmation or dynamic levels.
Clean Chart Usage: The indicator is designed to work standalone. Ensure no conflicting scripts are applied unless explicitly needed for your strategy.
Why This Indicator Is Unique
Unlike standalone FVG or SMC indicators, this script combines both concepts with multi-timeframe analysis, offering a comprehensive view of market structure and liquidity. The addition of customizable MA templates enhances flexibility, while the dynamic removal of mitigated FVGs keeps the chart clean. This mashup is purposeful, as it integrates complementary tools to streamline decision-making for traders using SMC strategies.
Credits
This indicator builds on foundational SMC and FVG concepts from the TradingView community. Some open-source code was reused, and do performance enhancement as you guys can read the code. This type of indicators has inspiration was drawn from public domain SMC methodologies. All code is partly original with manual work on performance optimization in Pine Script.
Notes
Ensure your chart is clean (no unnecessary drawings or indicators) to maximize clarity.
The indicator is open-source, and traders are encouraged to review the code for deeper understanding.
For optimal use, test the indicator on a demo account to familiarize yourself with its signals.

Iani SMC Sniper XAU v2.2 (Long+Short + News Countdown, v6)Iani SMC Sniper XAU (v2.2) — smart-money logic for XAUUSD.
This indicator hunts “sniper entries” using a simple SMC sequence:
Sweep → BOS → 50% FVG entry
• After London session builds its range, we wait for a liquidity sweep (price dips below London Low for longs / wicks above London High for shorts).
• A BOS confirms direction (close breaks the last swing).
• First FVG that prints after BOS gives the entry at 50% (mid-gap).
• SL anchored to the protective swing (with a small safety buffer). TP is plotted using your Risk:Reward.
News countdown (non-blocking):
The script does not auto-fetch news; you set daily times (e.g., 14:30, 16:00) and/or specific dates (“YYYY-MM-DD HH:MM”). A countdown label shows “NEWS in Xm”. Signals are not blocked—this is just a safety heads-up for prop-firm rules.
Inputs: pivot length, RR, pip size (XAU default 0.10), session filter (after London), news times (recurring & absolute), show/hide levels & labels.
Plots & labels: London High/Low (daily), Entry/SL/TP lines, BOS/Sweep/BUY/SELL markers, news badge.
Alerts: BOS Bull/Bear, BUY/SELL Entry touch, TP/SL hit, NEWS WARNING.
Notes:
• Designed for XAUUSD intraday; works on other symbols if you adjust pip size.
• Uses symbol timezone; adjust your news times for DST if needed.
• Indicator only—no orders, no backtest. Manage risk and execution in MT5/your platform.
Changelog (v2.2): Pine v6, robust time parsing, one-line logical expressions (fixed EOL errors), mirrored short logic, cleaner London H/L reset, countdown label.
Disclaimer: Educational tool, not financial advice. Past performance ≠ future results.
Tags: SMC, ICT, XAUUSD, Gold, Liquidity Sweep, BOS, FVG, London Session, News, Intraday, Scalping, DayTrading.

Advanced ICT Theory - A-ICT📊 Advanced ICT Theory (A-ICT): The Institutional Manipulation Detector
Are you tired of being the liquidity? Stop chasing shadows and start tracking the architects of price movement.
This is not another lagging indicator. This is a complete framework for viewing the market through the lens of institutional traders. Advanced ICT Theory (A-ICT) is an all-in-one, military-grade analysis engine designed to decode the complex language of "Smart Money." It automates the core tenets of Inner Circle Trader (ICT) methodology, moving beyond simple patterns to build a dynamic, real-time narrative of market manipulation, liquidity engineering, and institutional order flow.
AIT provides a living blueprint of the market, identifying high-probability zones, tracking structural shifts, and scoring the quality of setups with a sophisticated, multi-factor algorithm. This is your X-ray into the market's true intentions.
🔬 THE CORE ENGINE: DECODING THE THEORY & FORMULAS
A-ICT is built upon a sophisticated, multi-layered logic system that interprets price action as a story of cause and effect. It does not guess; it confirms. Here is the foundational theory that drives the engine:
1. Market Structure: The Blueprint of Trend
The script first establishes a deep understanding of the market's skeleton through multi-level pivot analysis. It uses ta.pivothigh and ta.pivotlow to identify significant swing points.
Internal Structure (iBOS): Minor swings that show the short-term order flow. A break of internal structure is the first whisper of a potential shift.
External Structure (eBOS): Major swing points that define the primary trend. A confirmed break of external structure is a powerful statement of trend continuation. AIT validates this with optional Volume Confirmation (volume > volumeSMA * 1.2) and Candle Confirmation to ensure the break is driven by institutional force, not just a random spike.
Change of Character (CHoCH): This is the earthquake. A CHoCH occurs when a confirmed eBOS happens against the prevailing trend (e.g., a bearish eBOS in a clear uptrend). A-ICT flags this immediately, as it is the strongest signal that the primary trend is under threat of reversal.
2. Liquidity Engineering: The Fuel of the Market
Institutions don't buy into strength; they buy into weakness. They need liquidity. A-ICT maps these liquidity pools with forensic precision:
Buyside & Sellside Liquidity (BSL/SSL): Using ta.highest and ta.lowest, AIT identifies recent highs and lows where clusters of stop-loss orders (liquidity) are resting. These are institutional targets.
Liquidity Sweeps: This is the "manipulation" part of the detector. AIT has a specific formula to detect a sweep: high > bsl and close < bsl . This signifies that institutions pushed price just high enough to trigger buy-stops before aggressively selling—a classic "stop hunt." This event dramatically increases the quality score of subsequent patterns.
3. The Element Lifecycle: From Potential to Power
This is the revolutionary heart of A-ICT. Zones are not static; they have a lifecycle. AIT tracks this with its dynamic classification engine.
Phase 1: PENDING (Yellow): The script identifies a potential zone of interest based on a specific candle formation (a "displacement"). It is marked as "Pending" because its true nature is unknown. It is a question.
Phase 2: CLASSIFICATION: After the zone is created, AIT watches what happens next. The zone's identity is defined by its actions:
ORDER BLOCK (Blue): The highest-grade element. A zone is classified as an Order Block if it directly causes a Break of Structure (BOS) . This is the footprint of institutions entering the market with enough force to validate the new trend direction.
TRAP ZONE (Orange): A zone is classified as a Trap Zone if it is directly involved in a Liquidity Sweep . This indicates the zone was used to engineer liquidity, setting a "trap" for retail traders before a reversal.
REVERSAL / S&R ZONE (Green): If a zone is not powerful enough to cause a BOS or a major sweep, but still serves as a pivot point, it's classified as a general support/resistance or reversal zone.
4. Market Inefficiencies: Gaps in the Matrix
Fair Value Gaps (FVG): AIT detects FVGs—a 3-bar pattern indicating an imbalance—with a strict formula: low > high (for a bullish FVG) and gapSize > atr14 * 0.5. This ensures only significant, volatile gaps are shown. An FVG co-located with an Order Block is a high-confluence setup.
5. Premium & Discount: The Law of Value
Institutions buy at wholesale (Discount) and sell at retail (Premium). AIT uses a pdLookback to define the current dealing range and divides it into three zones: Premium (sell zone), Discount (buy zone), and Equilibrium. An element's quality score is massively boosted if it aligns with this principle (e.g., a bullish Order Block in a Discount zone).
⚙️ THE CONTROL PANEL: A COMPLETE GUIDE TO THE INPUTS MENU
Every setting is a lever, allowing you to tune the AIT engine to your exact specifications. Master these to unlock the script's full potential.
🎯 A-ICT Detection Engine
Min Displacement Candles: Controls the sensitivity of element detection. How it works: It defines the number of subsequent candles that must be "inside" a large parent candle. Best practice: Use 2-3 for a balanced view on most timeframes. A higher number (4-5) will find only major, more significant zones, ideal for swing trading. A lower number (1) is highly sensitive, suitable for scalping.
Mitigation Method: Defines when a zone is considered "used up" or mitigated. How it works: Cross triggers as soon as price touches the zone's boundary. Close requires a candle to fully close beyond it. Best practice: Cross is more responsive for fast-moving markets. Close is more conservative and helps filter out fake-outs caused by wicks, making it safer for confirmations.
Min Element Size (ATR): A crucial noise filter. How it works: It requires a detected zone to be at least this multiple of the Average True Range (ATR). Best practice: Keep this around 0.5. If you see too many tiny, irrelevant zones, increase this value to 0.8 or 1.0. If you feel the script is missing smaller but valid zones, decrease it to 0.3.
Age Threshold & Pending Timeout: These manage visual clutter. How they work: Age Threshold removes old, mitigated elements after a set number of bars. Pending Timeout removes a "Pending" element if it isn't classified within a certain window. Best practice: The default settings are optimized. If your chart feels cluttered, reduce the Age Threshold. If pending zones disappear too quickly, increase the Pending Timeout.
Min Quality Threshold: Your primary visual filter. How it works: It hides all elements (boxes, lines, labels) that do not meet this minimum quality score (0-100). Best practice: Start with the default 30. To see only A- or B-grade setups, increase this to 60 or 70 for an exceptionally clean, high-probability view.
🏗️ Market Structure
Lookbacks (Internal, External, Major): These define the sensitivity of the trend analysis. How they work: They set the number of bars to the left and right for pivot detection. Best practice: Use smaller values for Internal (e.g., 3) to see minor structure and larger values for External (e.g., 10-15) to map the main trend. For a macro, long-term view, increase the Major Swing Lookback.
Require Volume/Candle Confirmation: Toggles for quality control on BOS/CHoCH signals. Best practice: It is highly recommended to keep these enabled. Disabling them will result in more structure signals, but many will be false alarms. They are your filter against market noise.
... (Continue this detailed breakdown for every single input group: Display Configuration, Zones Style, Levels Appearance, Colors, Dashboards, MTF, Liquidity, Premium/Discount, Sessions, and IPDA).
📊 THE INTELLIGENCE DASHBOARDS: YOUR COMMAND CENTER
The dashboards synthesize all the complex analysis into a simple, actionable intelligence briefing.
Main Dashboard (Bottom Right)
ICT Metrics & Breakdown: This is your statistical overview. Total Elements shows how much structure the script is tracking. High Quality instantly tells you if there are any A/B grade setups nearby. Unmitigated vs. Mitigated shows the balance of fresh opportunities versus resolved price action. The breakdown by Order Blocks, Trap Zones, etc., gives you a quick read on the market's recent character.
Structure & Market Context: This is your core bias. Order Flow tells you the current script-determined trend. Last BOS shows you the most recent structural event. CHoCH Active is a critical warning. HTF Bias shows if you are aligned with the higher timeframe—the checkmark (✓) for alignment is one of the most important confluence factors.
Smart Money Flow: A volume-based sentiment gauge. Net Flow shows the raw buying vs. selling pressure, while the Bias provides an interpretation (e.g., "STRONG BULLISH FLOW").
Key Guide (Large Dashboard only): A built-in legend so you never have to guess. It defines every pattern, structure type, and special level visually.
📖 Narrative Dashboard (Bottom Left)
This is the "story" of the market, updated in real-time. It's designed to build your trading thesis.
Recent Elements Table: A live list of the most recent, high-quality setups. It displays the Type , its Narrative Role (e.g., "Bullish OB caused BOS"), its raw Quality percentage, and its final Trade Score grade. This is your at-a-glance opportunity scanner.
Market Narrative Section: This is the soul of A-ICT. It combines all data points into a human-readable story:
📍 Current Phase: Tells you if you are in a high-volatility Killzone or a consolidation phase like the Asian Range.
🎯 Bias & Alignment: Your primary direction, with a clear indicator of HTF alignment or conflict.
🔗 Events: A causal sequence of recent events, like "💧 Sell-side liquidity swept →
📊 Bullish BOS → 🎯 Active Order Block".
🎯 Next Expectation: The script's logical conclusion. It provides a specific, forward-looking hypothesis, such as "📉 Pullback expected to bullish OB at 1.2345 before continuation up."
🎨 READING THE BATTLEFIELD: A VISUAL INTERPRETATION GUIDE
Every color and line is a piece of information. Learn to read them together to see the full picture.
The Core Zones (Boxes):
Blue Box (Order Block): Highest probability zone for trend continuation. Look for entries here.
Orange Box (Trap Zone): A manipulation footprint. Expect a potential reversal after price interacts with this zone.
Green Box (Reversal/S&R): A standard pivot area. A good reference point but requires more confluence.
Purple Box (FVG): A market imbalance. Acts as a magnet for price. An FVG inside an Order Block is an A+ confluence.
The Structural Lines:
Green/Red Line (eBOS): Confirms the trend direction. A break above the green line is bullish; a break below the red line is bearish.
Thick Orange Line (CHoCH): WARNING. The previous trend is now in question. The market character has changed.
Blue/Red Lines (BSL/SSL): Liquidity targets. Expect price to gravitate towards these lines. A dotted line with a checkmark (✓) means the liquidity has been "swept" or "purged."
How to Synthesize: The magic is in the confluence. A perfect setup might look like this: Price sweeps below a red SSL line , enters a green Discount Zone during the NY Killzone , and forms a blue Order Block which then causes a green eBOS . This sequence, visible at a glance, is the story of a high-probability long setup.
🔧 THE ARCHITECT'S VISION: THE DEVELOPMENT JOURNEY
A-ICT was forged from the frustration of using lagging indicators in a market that is forward-looking. Traditional tools are reactive; they tell you what happened. The vision for A-ICT was to create a proactive engine that could anticipate institutional behavior by understanding their objectives: liquidity and efficiency. The development process was centered on creating a "lifecycle" for price patterns—the idea that a zone's true meaning is only revealed by its consequence. This led to the post-breakout classification system and the narrative-building engine. It's designed not just to show you patterns, but to tell you their story.
⚠️ RISK DISCLAIMER & BEST PRACTICES
Advanced ICT Theory (A-ICT) is a professional-grade analytical tool and does not provide financial advice or direct buy/sell signals. Its analysis is based on historical price action and probabilities. All forms of trading involve substantial risk. Past performance is not indicative of future results. Always use this tool as part of a comprehensive trading plan that includes your own analysis and a robust risk management strategy. Do not trade based on this indicator alone.
観の目つよく、見の目よわく
"Kan no me tsuyoku, ken no me yowaku"
— Miyamoto Musashi, The Book of Five Rings
English: "Perceive that which cannot be seen with the eye."
— Dskyz, Trade with insight. Trade with anticipation.

SMA Smooth Market Structure (Multi-Timeframe)SMA Market Structure (Multi-Timeframe) is a powerful tool for tracking structural price action, using simple moving averages across any higher timeframe (HTF). It blends Smart Money Concepts with clean swing logic to reveal trend shifts, breaks of structure, and supply/demand zones.
This indicator highlights key structure features:
• Break of Structure (BOS) – Automatic detection of bullish or bearish swing breaks
• Internal Shifts – Early clues that the market is building toward a reversal
• Liquidity Sweeps (LS) – Detects swing failures that may trap traders
• Zigzag Swing Lines – Cleanly connects swing highs and lows
• Dynamic Zones – Demand (green) and supply (red) blocks drawn from engulfing breakouts
How to Use:
• Set your preferred HTF (e.g. 1H on a 15m chart) to view structure in proper context and
adjust SMA to smooth out market structure for directional consistency
• Watch BOS lines and swing labels like HH, HL, LH, LL for directional clarity
• Use the MS (Market Shift) label to identify full reversals after internal shifts + BOS
• Demand/Supply zones mark areas of previous strength and will update or mitigate automatically
• Alerts notify you of every BOS, MS, HH, LL, and LS event — no need to monitor manually
Customization Features:
• Toggle visibility of market shift markers, internal shifts, and zones
• Choose how internal shifts are calculated (High/Low or Open)
• Customize line style, width, and colors for BOS and zigzag lines
• Control zone duration and how mitigated zones behave (fade or delete)
• Built-in safety for Pine Script’s history limits using smart offset caps
Best Use Tips:
• Combine with price action patterns or volume for confirmation
• MS + BOS + zone tap often marks a high-probability reversal setup
• Use it to align lower timeframe entries with higher timeframe structure
For traders who want structure clarity without clutter, this tool is built to keep your chart actionable and adaptive.
ICT Swiftedge# ICT SwiftEdge: Advanced Market Structure Trading System
**Overview**
ICT SwiftEdge is a powerful trading system built upon the foundation of ICTProTools' ICT Breakers, licensed under the Mozilla Public License 2.0 (mozilla.org). This script has been significantly enhanced by to combine market structure analysis with modern technical indicators and a sleek, AI-inspired statistics dashboard. The goal is to provide traders with a comprehensive tool for identifying high-probability trade setups, managing exits, and tracking performance in a visually intuitive way.
**Credits**
This script is a derivative work based on the original "ICT Breakers" by ICTProTools, used with permission under the Mozilla Public License 2.0. Significant enhancements, including RSI-MA signals, trend filtering, dynamic timeframe adjustments, dual exit strategies, and an AI-style statistics dashboard, were developed by . We express our gratitude to ICTProTools for their foundational work in market structure analysis.
**What It Does**
ICT SwiftEdge integrates multiple trading concepts to help traders identify and manage trades based on market structure and momentum:
- **Market Structure Analysis**: Identifies Break of Structure (BOS) and Market Structure Shift (MSS) patterns, which signal potential trend continuations or reversals. BOS indicates a continuation of the current trend, while MSS highlights a shift in market direction, providing key entry points.
- **RSI-MA Signals**: Generates "BUY" and "SELL" signals when BOS or MSS patterns align with the Relative Strength Index (RSI) smoothed by a Moving Average (RSI-MA). Signals are filtered to occur only when RSI-MA is above 50 (for buys) or below 50 (for sells), ensuring momentum supports the trade direction.
- **Trend Filtering**: Prevents multiple signals in the same trend, ensuring only one buy or sell signal per trend direction, reducing noise and improving trade clarity.
- **Dynamic Timeframe Adjustment**: Automatically adjusts pivot points, RSI, and MA parameters based on the selected chart timeframe (1M to 1D), optimizing performance across different market conditions.
- **Flexible Exit Strategies**: Offers two user-selectable exit methods:
- **Trailing Stop-Loss (TSL)**: Exits trades when price moves against the position by a user-defined distance (in points), locking in profits or limiting losses.
- **RSI-MA Exit**: Exits trades when RSI-MA crosses the 50 level, signaling a potential loss of momentum.
- Users can enable either or both strategies, providing flexibility to adapt to different trading styles.
- **AI-Style Statistics Dashboard**: Displays real-time trade performance metrics in a futuristic, neon-colored interface, including total trades, wins, losses, win/loss ratio, and win percentage. This helps traders evaluate the system's effectiveness without external tools.
**Why This Combination?**
The integration of these components creates a synergistic trading system:
- **BOS/MSS and RSI-MA**: Combining market structure breaks with RSI-MA ensures entries are based on both price action (structure) and momentum (RSI-MA), increasing the likelihood of high-probability trades.
- **Trend Filtering**: By limiting signals to one per trend, the system avoids overtrading and focuses on significant market moves.
- **Dynamic Adjustments**: Timeframe-specific parameters make the system versatile, suitable for scalping (1M, 5M) or swing trading (4H, 1D).
- **Dual Exit Strategies**: TSL protects profits during trending markets, while RSI-MA exits are ideal for range-bound or reversing markets, catering to diverse market conditions.
- **Statistics Dashboard**: Provides immediate feedback on trade performance, enabling data-driven decision-making without manual tracking.
This combination balances technical precision with user-friendly visuals, making it accessible to both novice and experienced traders.
**How to Use**
1. **Add to Chart**: Apply the script to any TradingView chart.
2. **Configure Settings**:
- **Chart Timeframe**: Select your chart's timeframe (1M to 1D) to optimize parameters.
- **Structure Timeframe**: Choose a timeframe for market structure analysis (leave blank for chart timeframe).
- **Exit Strategy**: Enable Trailing Stop-Loss (`useTslExit`), RSI-MA Exit (`useRsiMaExit`), or both. Adjust `tslPoints` for TSL distance.
- **Show Signals/Labels**: Toggle `showSignals` and `showExit` to display "BUY", "SELL", and "EXIT" labels.
- **Dashboard**: Enable `showDashboard` to view trade statistics. Customize colors with `dashboardBgColor` and `dashboardTextColor`.
3. **Trading**:
- Look for "BUY" or "SELL" labels to enter trades when BOS/MSS aligns with RSI-MA.
- Exit trades at "EXIT" labels based on your chosen strategy.
- Monitor the statistics dashboard to track performance (total trades, win/loss ratio, win percentage).
4. **Alerts**: Set up alerts for BOS, MSS, buy, sell, or exit signals using the provided alert conditions.
**License**
This script is licensed under the Mozilla Public License 2.0 (mozilla.org). The source code is available for review and modification under the terms of this license.
**Compliance with TradingView House Rules**
This publication adheres to TradingView's House Rules and Scripts Publication Rules. It provides a clear, self-contained description of the script's functionality, credits the original author (ICTProTools), and explains the rationale for combining indicators. The script contains no promotional content, offensive language, or proprietary restrictions beyond MPL 2.0.
**Note**
Trading involves risk, and past performance is not indicative of future results. Always backtest and validate the system on your preferred markets and timeframes before live trading.
Enjoy trading with ICT SwiftEdge, and let data-driven insights guide your decisions!

Prime Multi-Ticker Screener: Real-Time Market StructurePrime Multi-Ticker Screener: Real-Time Market Structure and Trend Detection Tool
Prime Multi-Ticker Screener is designed to track multiple tickers simultaneously, providing real-time insights into market trends and structure changes such as CHoCH (Change of Character) and BOS (Break of Structure). This tool is perfect for traders looking to monitor multiple assets across different timeframes while receiving clear signals that highlight critical market shifts. The indicator delivers instant visual feedback with color-coded backgrounds to make interpreting signals easy and efficient.
Core Features of Prime Multi-Ticker Screener
Multi-Ticker Monitoring: Track up to 5 tickers across multiple timeframes in a single dashboard. This makes it easy to watch several assets at once without cluttering your chart.
CHoCH and BOS Detection: The screener automatically detects and highlights significant market structure shifts. CHoCH signals are shown when a trend reverses or consolidates, while BOS signals indicate a break in previous highs or lows, helping traders catch potential trend reversals early.
Color-Coded Visuals: The background of each signal cell dynamically changes color to represent bullish or bearish signals. Green indicates bullish activity, while red highlights bearish market shifts, making it easy for traders to identify key movements at a glance.
Close Price and ATR Data: For each ticker, the screener displays both the current close price and the 14-period Average True Range (ATR), providing important volatility information to support decision-making.
Detailed Explanation of How Prime Multi-Ticker Screener Works
Prime Multi-Ticker Screener combines trend detection with real-time market structure analysis to deliver comprehensive market insights. It analyzes the following components:
CHoCH Detection: Change of Character occurs when the market switches from trending to ranging or vice versa. This indicator catches these moments by identifying when prices cross pivot levels, providing traders with a valuable signal of potential market phase changes.
BOS Detection: The Break of Structure function highlights moments when the price breaks a significant high or low, often indicating the start of a new trend or the continuation of an existing one.
Close Price & ATR Monitoring: Alongside market structure signals, the screener provides real-time data on the close price and the Average True Range (ATR), ensuring traders have a complete picture of the price and volatility landscape for each asset they are tracking.
Why It's Useful for Traders
Prime Multi-Ticker Screener is a versatile tool that offers substantial benefits to traders who want to stay informed about multiple assets and trends simultaneously:
Comprehensive Monitoring: Track multiple assets in real time, all from a single indicator. Whether you trade crypto, forex, or stocks, this tool helps you stay on top of market movements across different assets and timeframes.
Market Structure Analysis: The automatic detection of CHoCH and BOS signals gives traders an edge by identifying potential reversals and trend continuations as they happen, allowing for more timely and informed trading decisions.
Efficient and Intuitive Design: The screener is designed with simplicity in mind. The color-coded backgrounds quickly alert traders to market structure shifts without overwhelming them with data, making it ideal for those who need to act fast.
How It Works: Practical Usage
Prime Multi-Ticker Screener is ideal for:
Day traders: The real-time tracking of multiple assets allows day traders to quickly spot trading opportunities across different markets.
Swing traders: CHoCH and BOS detection help swing traders catch key market structure shifts, helping them align trades with emerging trends.
Trend followers: The screener provides instant feedback on when a trend is continuing or breaking, helping trend-following traders maintain their positions or exit early when needed.
By combining multiple key metrics—price, volatility, and market structure—Prime Multi-Ticker Screener ensures traders are well-equipped to manage their positions across a variety of assets.
Risk Disclaimer
While Prime Multi-Ticker Screener provides valuable market insights, it's important to remember:
Past performance is not indicative of future results: This screener provides analysis based on historical data, and no indicator can predict future market movements with certainty.
Market Conditions: The effectiveness of Prime Multi-Ticker Screener may vary in different market conditions, so traders should always use proper risk management when trading.
Trading Risks: Like any trading tool, Prime Multi-Ticker Screener should be used as part of a comprehensive trading strategy, including risk management techniques such as stop-loss orders and position sizing.
Mxwll Price Action Suite [Mxwll]Introducing the Mxwll Price Action Suite!
The Mxwll Price Action Suite is an all-in-one analysis indicator incorporating elements of SMC and also ideas extending beyond the trading methodology!
Features
Internal structures
External structures
Customizable Sensitivities
BoS/CHoCH
Order Blocks
HH/LH/LL/LH Areas
Rolling TF highs/lows
Rolling Volume Comparisons
Auto Fibs
And more!
The image above shows the indicator's market structure identification capabilities. Internal BoS and CHoCH structures in addition to overarching market structures are available with customizable sensitivities.
The image above shows the indicator identifying order blocks! Additionally, HH/LH/LL/LH areas are also identified.
The image above shows a rolling area of interest. These areas can be compared to supply/demand zones, where traders might consider a bargain long/short/sell area.
The indicator displays a rolling 4hr high/low and 1D high/low, alongside auto fibonacci levels with a customizable sensitivity.
Finally, the Mxwll Price Action Suite shows relevant session information.
Table information
Current Session
Countdown to session close
Next Session
Countdown to next session open
Rolling 4-Hr volume intensity
Rolling 24-Hr volume intensity
Introducing the Mxwll SMC Suite!
The Mxwll SMC Suite is an all-in-one analysis indicator incorporating elements of SMC and also ideas extending beyond the trading methodology!
Features
Internal structures
External structures
Customizable Sensitivities
BoS/CHoCH
Order Blocks
HH/LH/LL/LH Areas
Rolling TF highs/lows
Rolling Volume Comparisons
Auto Fibs
And more!
The image above shows the indicator's market structure identification capabilities. Internal BoS and CHoCH structures in addition to overarching market structures are available with customizable sensitivities.
The image above shows the indicator identifying order blocks! Additionally, HH/LH/LL/LH areas are also identified.
The image above shows a rolling area of interest. These areas can be compared to supply/demand zones, where traders might consider a bargain long/short/sell area.
The indicator displays a rolling 4hr high/low and 1D high/low, alongside auto fibonacci levels with a customizable sensitivity.
Finally, the Mxwll Price Action Suite shows relevant session information.
Table information
Current Session
Countdown to session close
Next Session
Countdown to next session open
Rolling 4-Hr volume intensity
Rolling 24-Hr volume intensity
Expanded Features of Mxwll Price Action Suite
Internal and External Structures
Internal Structures: These elements refer to the price formations and patterns that occur within a smaller scope or a specific trading session. The suite can detect intricate details like minor support/resistance levels or short-term trend reversals.
External Structures: These involve larger, more significant market patterns and trends spanning multiple sessions or time frames. This capability helps traders understand overarching market directions.
Customizable Sensitivities
Adjusting sensitivity settings allows users to tailor the indicator's responsiveness to market changes. Higher sensitivity can catch smaller fluctuations, while lower sensitivity might focus on more significant, reliable market moves.
Break of Structure (BoS) and Change of Character (CHoCH)
BoS: This feature identifies points where the price breaks a significant structure, potentially indicating a new trend or a trend reversal.
CHoCH: Detects subtle shifts in the market's behavior, which could suggest the early stages of a trend change before they become apparent to the broader market.
Order Blocks and Market Phases
Order Blocks: These are essentially price levels or zones where significant trading activities previously occurred, likely pointing to the positions of smart money.
HH/LH/LL/LH Areas: Identifying Higher Highs (HH), Lower Highs (LH), Lower Lows (LL), and Lower Highs (LH) helps in understanding the trend and market structure, aiding in predictive analysis.
Rolling Timeframe Highs/Lows and Volume Comparisons
Tracks highs and lows over specified rolling periods, providing dynamic support and resistance levels.
Compares volume data across different timeframes to assess the strength or weakness of the current price movements.
Auto Fibonacci Levels
Automatically calculates and plots Fibonacci retracement levels, a popular tool among traders to identify potential reversal points based on past movements.
Session Data and Volume Intensity
Session Information: Displays current and upcoming trading sessions along with countdown timers, which is crucial for day traders and those trading on session overlaps.
Volume Intensity: Measures and compares the volume within the last 4 hours and 24 hours to gauge market activity and potential breakout/breakdown movements.
Visualizations and Practical Use
Dynamic Visuals: The suite provides dynamic visual aids, such as real-time updating of high/low markers and Fibonacci levels, which adjust as new data comes in. This feature is critical in fast-paced markets.
Strategic Entry/Exit Points: By identifying order blocks and using Fibonacci levels, traders can pinpoint strategic entry and exit points, maximizing potential returns.
Risk Management: Enhanced features like session countdowns and volume intensity help in better risk management by providing traders with more data on market sentiment and potential volatility.
