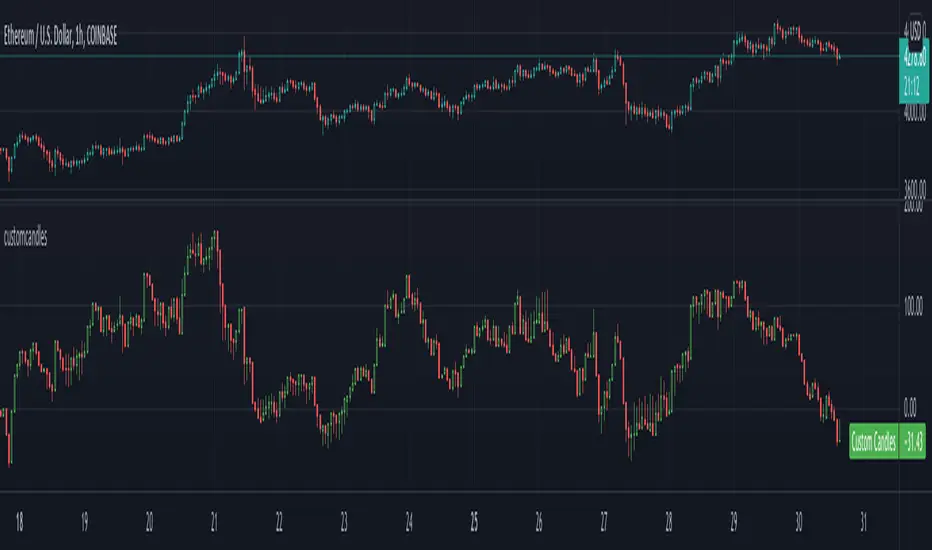
customcandlesLibrary "customcandles"
customcandles: Contains methods which can send custom candlesticks based on the input
macandles(maType, length, o, h, l, c) macandles: Provides OHLC of moving average candles
Parameters:
maType : - Moving average Type. Can be sma, ema, hma, rma, wma, vwma, swma, linreg, median
length : - Defaulted to 20. Can chose custom length
o : - Optional different open source. By default is set to open
h : - Optional different high source. By default is set to high
l : - Optional different low source. By default is set to low
c : - Optional different close source. By default is set to close
Returns: : Custom Moving Average based OHLC values
hacandles() hacandles: Provides Heikin Ashi OHLC values
Returns: : Custom Heikin Ashi OHLC values
ocandles(type, length, shortLength, longLength, method, highlowLength, sticky, percentCandles) macandles: Provides OHLC of moving average candles
Parameters:
type : - Oscillator Type. Can be cci, cmo, cog, mfi, roc, rsi, tsi, mfi
length : - Defaulted to 14. Can chose custom length
shortLength : - Used only for TSI. Default is 13
longLength : - Used only for TSI. Default is 25
method : - Valid values for method are : sma, ema, hma, rma, wma, vwma, swma, highlow, linreg, median
highlowLength : - length on which highlow of the oscillator is calculated
sticky : - overbought, oversold levels won't change unless crossed
percentCandles : - candles are generated based on percent with respect to high/low instead of actual oscillator values
Returns: : Custom Moving Average based OHLC values
Search in scripts for "CCI"
lib_Indicators_DTLibrary "lib_Indicators_DT"
This library functions returns some Moving averages and indicators.
Created it to feed my indicator/strategy "INDICATOR & CONDITIONS COMBINATOR FRAMEWORK v1 " which I will publish it as soon as possible.
Credits: Library includes some public indicators, snippets from tradingview & @03.freeman's ("All MAs displayed") scripts.
(I hope, I dont break Tradingview's House Rules on Script Publishing)
f_plotPrep(src_, src_, src_, src_) Prepare Indicator Plot Type
Parameters:
src_ : Source
src_ : plotingType_ "Original, Stochastic, Percent"
src_ : stochlen_ Stochasting plottingtype length
src_ : plotSWMA_ Use SWMA for the output
Returns: Return the prepared indicator
f_funcPlot(string, float, simple, string, simple, bool) f_funcPlot(string f, float src_, simple int length_, string plotingType_ = "Original", simple int stochlen_=50, bool plotSWMA=false) Return selected indicator value with different parameters
Parameters:
string : f indicator-> options=
float : src_ close,open.....
simple : int length_ indicator length
string : plotingType return param-> options= ['Original', 'Stochastic', 'PercentRank')
simple : int stochlen_ length for return Param
bool : plotSWMA Use SWMA on Plot
Returns: float

Indicators OverlayHello All,
This script shows the indicators in separate windows on the main chart. Included indicators are RSI, CCI, OBV, Stochastic, Money Flow Index, Average True Range and Chande Momentum Oscillator. indicator windows are located at the top or bottom of the chart according to last moves of the Closing price. Different colors are used for each indicator. Horizontal levels are shown as dashed line and label as well.
Using the options;
You can enable/disable the indicators you want to see or not
You can change source and length for each indicator
You can set window length. using this length indicator windows are located on the chart
After you added this indicator to your chart I recommend: right click on any of the indicator windows => "Visual Order" => "Bring to front" as seen screenshot below:
in this example only 3 indicators enabled and period is set as 80:
indicator windows moves to the top or bottom of the chart according to the close price:
P.S. if you want to see any other indicator in the options then leave a comment under the indicator ;)
Enjoy!

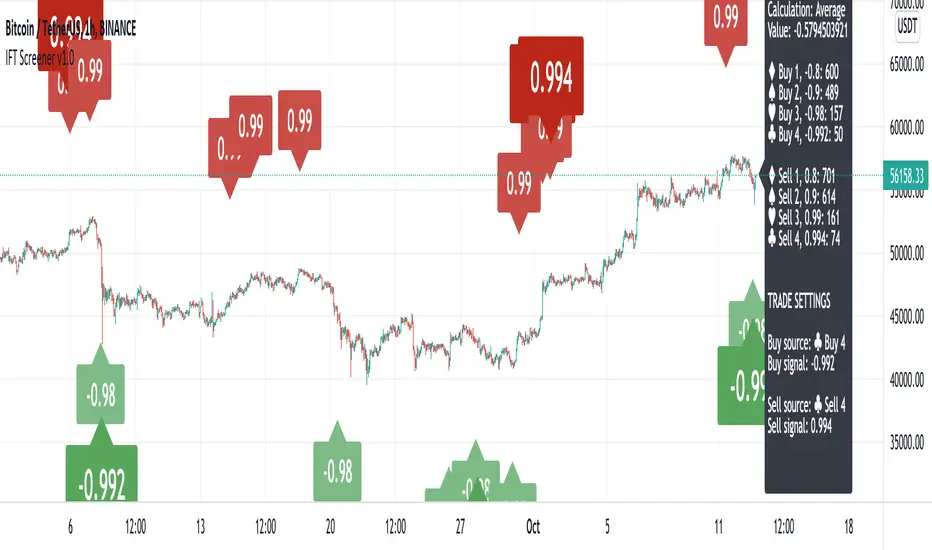
Inverse Fisher Transform ScreenerThis is a Screener for Inverse Fisher Transform on multiple oscillators
This tool is intended to aid you to visually analyse reasonable buy and sell IFT-signal thresholds across multiple tokens and different sources. It will help you speed up the tedious and manual work of trying out different IFT-settings when you're able to review the chart visually to find which values are present the most often and the location of that signal on the chart.
What does it bring to the table, why is it useful?
- Invese Fisher Transform on multiple oscillators such as RSI, MFI, CCI, Stochastic
- Combine multiple sources into one signal, select how it's calculated
- Visually review the chart for good IFT-settings
- 4 dynamic buy labels with different thresholds
- 4 dynamic sell labels with different thresholds
- Buy and sell on signal reversal
- Create your own trade alerts for automation
- Backtester compatible (plots 1 and 2 for buy and sell signals)
- A dynamic table counting amount of signals for each setting
- The labels are automatically updated when you change the values in the settings
How to use?
1. Change signal source and method
2. Change buy and sell thresholds
3. Show/hide additional labels
4. Review chart
5. Change trade settings
6. Backtest
7. Create alerts
Description
With this indicator you're able to visually review the signal strength of one or multiple oscillators processed with Inverse Fisher Transform ( IFT ), combine them and choose the method of calculation when they are combined. This produces a signal which strongly fluctuates between -1 and +1 instead of the more common 0-100 most oscillators uses. The intention is to make the decision making clearer and easier when you decide when to enter or exit a trade. This aims to help you remove the feelings from your trading.
Inverse Fisher Transform was first presented by John Ehlers in Stocks & Commodities V. 22:5 where he proposes to process RSI with the formula for hyperbolic tangent, tanh (x). This transforms the oscillator into a smoother and more compressed version with quicker oscillations.
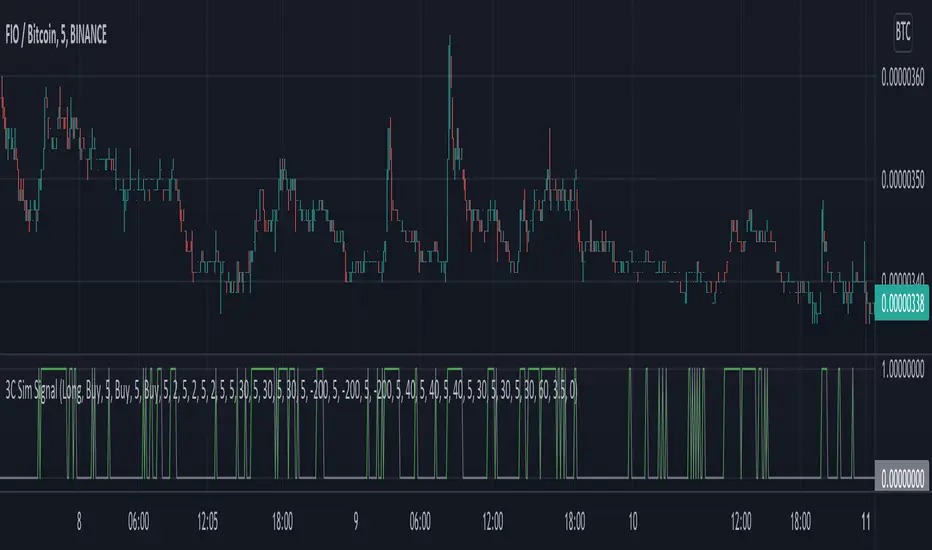
3C Sim SignalThis indicator offers the same deal start conditions available on Backtest script but now as an external signal so you can not only backtest but also set up alerts.
You can use the backtest script to backtest this indicator as an external signal and then once happy with the backtest results send directly tradingview alerts to your own bots on any exchange.
It supports most of the deal start conditions currently available for DCA bots on binance.com for example:
- TV technical ratings: buy, sell, strong buy, strong sell.
- RSI
- MFI
- CCI
- Ultimate Oscilator
- QFL
- min volume filter
Once added to the chart it will plot one when the deal start condition is true and zero when is not.
The conditions can be used in long or short strategy mode.
The biggest advantage compared to using it separately from the DSC already available in the backtest script is that because this is a separated study it will perform faster than the backtest and it resolves repainting issues. This two aspects make these indicator better suited for real time trading while still being able to connect to the backtest as an external indicator therefore still backtestable.
Now you can backtest symbols on any exchange and once your strategy is ready you then can send alerts directly to your bots.
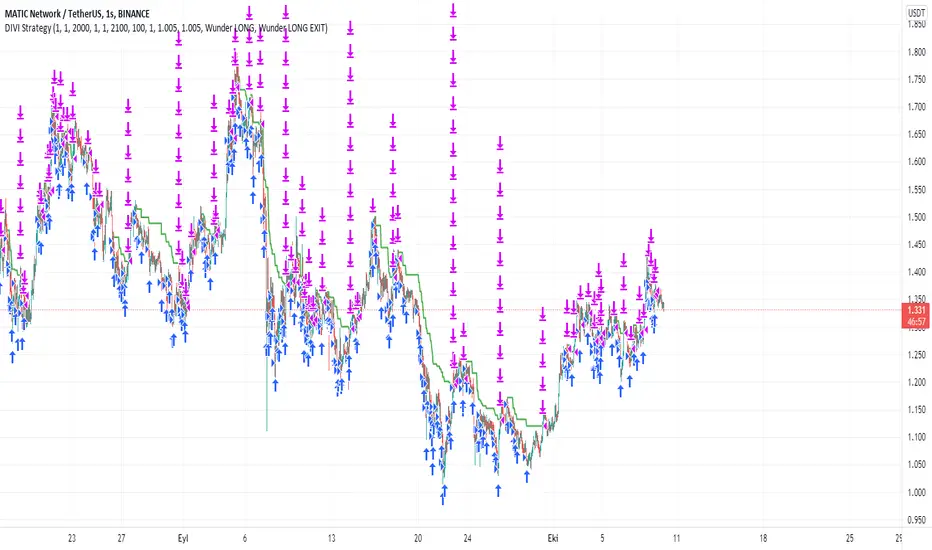
DIVI Wunder StrategyAs it is known, divergence is a situation we encounter very often on graphs. Various divergencies may occur according to many indicators. MACD divergence, RSI divergence... In the strategy I use only positive divergence. What is positive divergence I will explain on MACD positive divergence A MACD positive divergence is a situation in which the MACD does not reach a new low, despite the fact that the price of the stock reached a new low. This is seen as a bullish trading signal—hence, the term “positive divergence.” So I thought of these divergencies and came up with a new strategy. Combining the divergencies with the VOLPIN strategy I wrote earlier, a great strategy has emerged. When the divergence signals are came from MACD,RSI,CCI,OBV,Chaikin Money Flow, VWmacd and Money Flow Index all these indicators I sent a buy signal until the 40 times completed. ThenI sent to sell signal when the price come to take profit level. In this strategy, you divide your principal into as many parts as you want. For example, let's say that you have 1000 dollars of money and you make purchases by dividing this money into 40 equal parts in the default settings of the indicator. $25 per purchase. After each purchase is made as 25 dollars, you can adjust your profit rate from the profit taking settings. When you look at the results of the strategy, your profit rate will be very high. I usually use this strategy in one hour periods. Of course you change it whatever you want. Also change all settings from panel to get more profit. Have fun :)
ORB with Shorty Targets
The ORBS indicator study utilizes the theory of an Opening Range Breakout occurring on a security. The indicator uses data collected from the first thirty minute session of the trading day to create fibonacci retracements at specific positions. The 'session' high and low are derived from the first thirty minutes and used as a basis to plot these values. Fibonacci retracement lines are plotted at key positions above and below the high/low values pulled during the opening 'session'. These fibonacci retracement lines are plotted at: 0 (ORB high); 1.272; 1.618; 2.00; 2.175; 2.618; and 3.236. Levels in-between these values are known as 'ranges'. Upper lines are shown green in color and indicate key levels at which the price may react within the market. No guarantees are given nor implied - ORBs is simply a tool to help plot out key fibonacci levels at specific levels accurately and completely.
This will only work on 3min or 5mins and it is intended for intraday trading only.
ORH - opening range high
ORL - opening range low
OR50% - mid between ORH and ORL aka 50% fib
The way i use ORBS:
1. ORH break - i go long on 3min or 5 min close above ORH. I use heiken-ashi candles.
2. ORL breal - i will short on 3min or 5 min close below ORL
3. Double bottoms on reclaims of ORL - i will go long with SL being the ORL
4. Double tops on ORH considering market is weak i will short with SL being the ORH
Trendbar:
Trendbar use combo of CCI and ATR to help figure out the trend the stock is in. Stock moving below the trendbar indicates it is loosing the trend dependent on what time-frame you are using it.
Pivots:
Shorty Pivots are a collection of daily/weekly/ monthly pivots indicator that allows for plotting a daily, weekly, and monthly line on a chart. The values are pulled from the three separate resolutions (daily, weekly, and monthly), and shown on the chart each day. Calculations pulled from each respective high/low/close (divided by 3.0) for the session values.
Settings:
Show Daily/Weekly/Monthly Pivot - Shows/Hides each respective pivot .
Pivot Colors - Change the color of each pivot .
Pivot Width - Line width of the plotted pivot .
Line Style - Choose Solid, Dashed, or Dotted to view different styled lines.
Label Text Color - Choose the label text color if it clashes with your chosen line color(s).
Extend Pivot Lines to Right Offset: This allws you to extend each pivot line to the right by an offset of X bars.
Day Session Timeframe - Ignore this setting.
Pivot Adjustment Timeframe - Ignore this setting.

WMA Combo Crossover V2Before I begin I want to mention:
1. This is an upgrade of my indicator WMA Combo Crossover. (Link: www.tradingview.com)
2. The upgrade was inspired from the CCI and Bollinger Bands indicator by matsu_bitmex. (Link: www.tradingview.com)
3. I have combined the indictor with Bollinger Bands , coloring those sections as yellow, to increase winning trades as well as avoid losing trades by spotting potential reversals with the aid of news avoidance
4. This indicator is designed primarily for NNFX (No Nonsense Forex) though it can be used for any type of trading style
5. Also, I want to thank kurtisbu for helping me out. Thank you!
The indicator:
1. When WMA 25 is blue and is going upwards, it means there is an uptrend
2. When WMA 25 is red and is going down, it means there is a downtrend
3. During a trend, the color may switch to red and blue occasionally. When the color switches back to the direction of the trend, it can be used for re-entries
4. All trades based on the yellow color MUST be during a trend
5. When the color changes to yellow that means price is very volatile and only on the 1st candle is it advisable to enter a trade. (I have not backtested entering on the 2nd candle of a yellow color change)
6. During a trend, when the color changes to yellow and there is an incoming news event, then the chances of a reversal increase and I recommended avoid entering

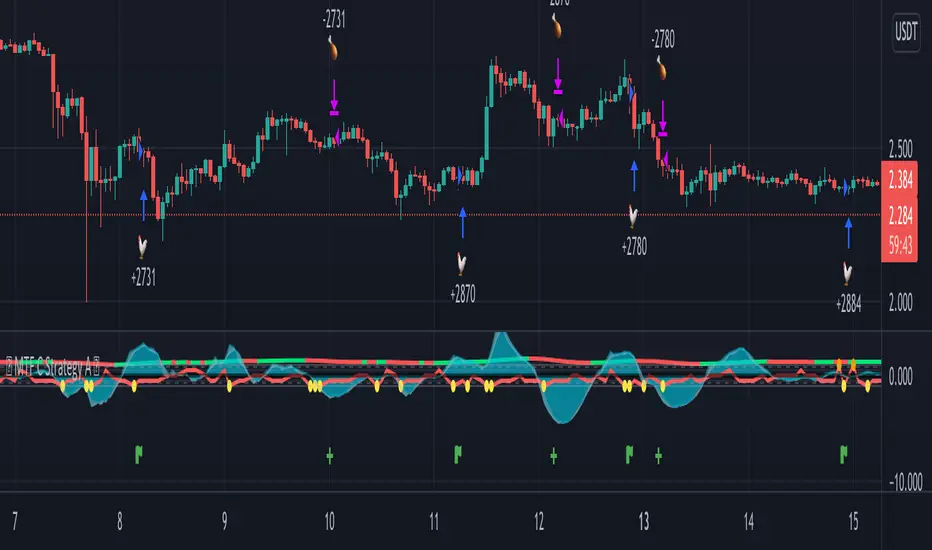
MTF C Strategy A
The Pearson coefficient is a type of correlation coefficient that represents the relationship between two variables that are measured on the same interval or ratio scale. It's a measure of the strength of the association between two continuous variables.
This script allows you to choose one or more sources as a curve, if several sources are chosen, their average is taken into account in an EMA or SMA of your choice. It is possible to have the average of all the curves and to add one or more other curves for an influence on the calculated average.
Then, on the basis of this curve a correlation is calculated from 8 time ranges which give 4 curves, it is on this basis that the conditions of entries in the trade and / or exits are based with the possibility of adding an RSI condition.
For some entries, it is possible to try the symmetrically opposite condition, ie the one that is used in shorts.
To make entry short work, you must activate an exit short option.
However, exit conditions are more flexible than entry conditions because they allow the inverse entry condition used and / or to use statistical indices such as CCI / RSI / ROC / BB as exit condition independently or combined way.
It should be noted that if a condition among those chosen is executed substantially first, it will predominate over the others (same for long / short entries).
In addition, it is possible to choose a stop loss as an exit condition, however, it is not possible to combine the other exit conditions with the stoploss at the same time. Credits to adolgov for the base of the stoploss script part.
You can combine several curves, just as it is possible to combine several types of trade entries / exits.
The strategy uses 100% of equity, it has not been configured in such a way that there is an order pyramid and the closings are done on a total equity basis.
You can configure a daily session interval, a limit of the number of daily trades, a limit of drawdown.
You can add comments for each execution of an opening / closing order respectively to the direction (long or short).
Each step of the configuration has a tip, a button that must be hovered over in order to have the information relating to the configuration.
Multi-ZigZag Multi-Oscillator Trend DetectorThis table is intended to give you snapshot of how price and oscillators are moving along with zigzag pivots.
This is done in the same lines of Zigzag-Trend-Divergence-Detector
But, here are the differences
Table shows multiple oscillator movements at a same time instead of one selected oscillator
Divergence is not calculated and also supertrend based trend. Trend can be calculated based on zigzag movements. However, lets keep this for future enhancements.
This system also uses multiple zigzags instead of just one.
⬜ Process
▶ Derive multiple zigzags - Code is taken from Multi-ZigZag
▶ Along with zigzags - also calculate different oscillators and attach it to zigzag pivot.
▶ Calculate directions of zigzag pivots and corresponding oscillators.
▶ Plot everything in the table on last bar.
⬜ Table components
Table contains following data:
Directional legends are:
⇈ - Higher High (Green)
⇊ - Lower Low (Red)
⭡- Lower High (Orange)
⭣ - Higher Low (Lime)
⬜ Input Parameters
▶ Source : Default is close. If Unchecked - uses high/low data for calculating pivots. Can also use external input such as OBV
▶ Stats : Gives option to select the depth of output (History) and also lets you chose text size and table position.
▶ Oscillators : Oscillator length is derived by multiplying multiplier to zigzag length. For example, for zigzag 5, with 4 as multiplier, all oscillators are calculated with length 20. But, same for zigzag 8 will be 32 and so on.
▶ Available oscillators :
CCI - Commodity Channel Index
CMO - Chande Momentum Oscillator
COG - Center Of Gravity
MFI - Money Flow Index (Shows only if volume is present)
MOM - Momentum oscillator
ROC - Rate Of Change
RSI - Relative Strength Index
TSI - Total Strength Index
WPR - William Percent R
BB - Bollinger Percent B
KC - Keltner Channel Percent K
DC - Donchian Channel Percent D
ADC - Adoptive Donchian Channel Percent D ( Adoptive-Donchian-Channel )
⬜ Challenges
There are 12 oscillators and each zigzag has different length. Which means, there are 48 combinations of the ocillators.
First challenge was generating these values without creating lots of static initialization. Also, note, if the functions are not called on each bar, then they will not yield correct result. This is achieved through initializer function which runs on every bar and stores the oscillator values in an array which emulates multi dimensional array oscillator X zigzag length.
Next challenge was getting these values within function when we need it. While doing so I realized that values stored in array also have historical series and calling array.get will actully get you the entire series and not just the value. This is an important takeaway for me and this can be used for further complex implementations.
Thanks to @LonesomeTheBlue and @LucF for some timely suggestions and interesting technical discussions :)

Trend System Oscillator Averages RatingThis is a trend system made with multiple oscillator averages designed especially for trending markets such as stocks or crypto.
It can be used with any timeframe.
Its made of multiple moving oscillators such as
RSI
Stochastic
ADX
CCI
AO
MACD
MOM
STOCH RSI
WPR
BP
UO
Avg of all oscillators
It has also a rating, making an avg from all of the oscillators , going from -100 (all ma's are telling to go short ) to 100 ( all ma are telling to go long).
If you have any questions let me know !

Zigzag Trend/Divergence DetectorPullbacks are always hardest part of the trade and when it happen, we struggle to make decision on whether to continue the trade and wait for recovery or cut losses. Similarly, when an instrument is trending well, it is often difficult decision to make if we want to take some profit off the table. This indicator is aimed to make these decisions easier by providing a combined opinion of sentiment based on trend and possible divergence.
⬜ Process
▶ Use any indicator to find trend bias. Here we are using simple supertrend
▶ Use any oscillator. I have added few inbuilt oscillators as option. Default used is RSI.
▶ Find divergence by using zigzag to detect pivot high/low of price and observing indicator movement difference between subsequent pivots in the same direction.
▶ Combine divregence type, divergence bias and trend bias to derive overall sentiment.
Complete details of all the possible combinations are present here along with table legend
⬜Chart Legend
C - Continuation
D - Divergence
H - Hidden Divergence
I - Indeterminate
⬜ Settings
▶ Zigzag parameters : These let you chose zigzag properties. If you check "Use confirmed pivots", then unconfirmed pivot will be ignored in the table and in the chart
▶ Oscillator parameters : Lets you select different oscillators and settings. Available oscillators involve
CCI - Commodity Channel Index
CMO - Chande Momentum Oscillator
COG - Center Of Gravity
DMI - Directional Movement Index (Only ADX is used here)
MACD - Moving average convergence divergence (Can chose either histogram or MACD line)
MFI - Money Flow Index
MOM - Momentum oscillator
ROC - Rate Of Change
RSI - Relative Strength Index
TSI - Total Strength Index
WPR - William Percent R
BB - Bollinger Percent B
KC - Keltner Channel Percent K
DC - Donchian Channel Percent D
ADC - Adoptive Donchian Channel Percent D ( Adoptive-Donchian-Channel )
▶ Trend bias : Supertrend is used for trend bias. Coloring option color candles in the direction of supertrend. More option for trend bias can be added in future.
▶ Stats : Enables you to display history in tabular format.
Overview of settings present here:
⬜ Notes
Trend detection is done only with respect to previous pivot in the same direction. Hence, if chart has too many zigzags in short period, try increasing the zigzag length or chart timeframe. Similarly, if there is a steep trend, use lower timeframe charts to dig further.
Oscillators does not always make pivots at same bar as price. Due to this some the divergence calculation may not be correct. Hence visual inspection is always recommended.
⬜ Possible future enhancements
More options for trend bias
Enhance divergence calculation. Possible options include using oscillator based zigzag as primary or using close prices based zigzag instead of high/low.
Multi level zigzag option - Can be messy to include more than one zigzag. Option can be added to chose either Level1 or Level2 zigzags.
Alerts - Alerts can only be added for confirmed pivots - otherwise it will generate too many unwanted alerts. Will think about it :)
If I get time, I will try to make a video.

Angels Calls 2.0- By ClovesPersonal new version!
Don't forget to set the in Right Scale.
The Script is now public, it's on my profile, and in search.
The best buy and sell signals are those of the RSI thanks!
The Script with Buy and Sell Calls is on my profile or in search and just bookmark and use.
In the search just type Angells Calls and bookmark and use.
To use we filter the signals in longer graph times, and look for the best buy and sell entries in shorter graph times.
To use the Script you must also study graphic patterns so as not to get lost in any early signal.
Script uses Emas20/ 40 and Ema200 Crossover Strategy for uptrend and downtrend
and also the Rsi and CCI strategy for the best entries and exits in trades.
Holders, the ideal for hold is to use the script in larger graphic times like 2h, 4h, 1d.
Hope this helps.
Hugs. Good Earnings!
_________________________________
Versão nova pessoal !
Não se esqueça de fixar na Escala a Direita.
O Script agora é publico, tem no meu perfil,
e nas pesquisas.
ps. os melhores sinais de compra e venda são os do RSI
valeu !
Abs.


3CCI & 3RSI for botsThis script is for trading grid bots. Only CCI and RSI are used, but there are three different timeframes available for each. When using it, you must select a chart with a period equal to or less than the minimum in the indicator settings. For example, the following periods are selected in the settings: 1 hour, 15 minutes, 5 minutes, so we use a 5-minute chart. A buy or sell signal will be received if the settings of all 6 indicators match. The default settings do not carry any information, use your own. The code is quite simple and may be of interest to a beginner like me.

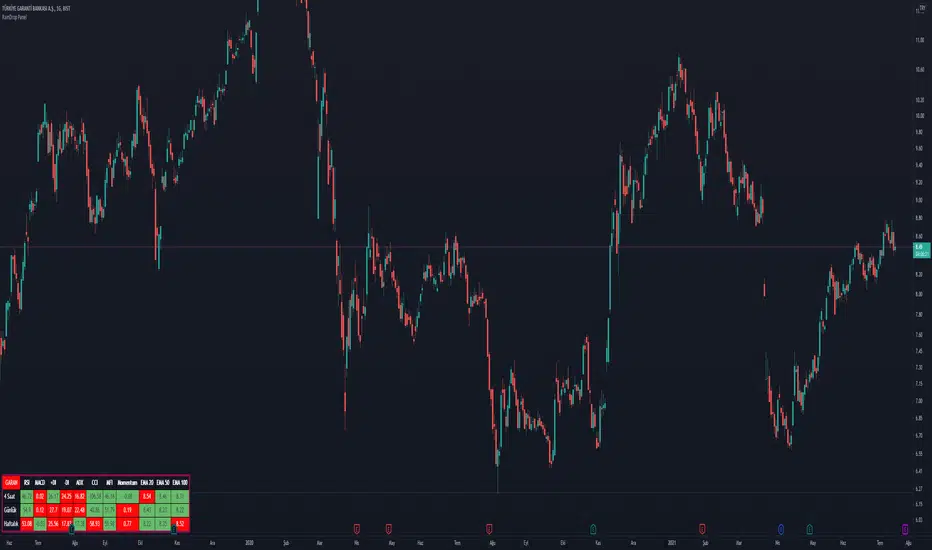
RainDrop PanelHi everyone,
This script shows the Dashboard in a Table. Table.new() is a new feature and released today! Big thanks to Pine Team for adding this great new feature!
This new feature changes the rules of the game! The script shows 3 different time period indicator values for the icon and changes the background color of each cell using the current and last values of the indicators for the icon. The background color is green if the current value is greater than the last value, red if it is less than the last value, and gray if it is equal. You can select the time periods and Indicators to be displayed. You can also change the position, font sizes, title and text colors of the relevant panel on the graphic. The number of columns in the table is dynamic and changes according to the number of indicators. You can choose 1 Symbol, 3 different timeframes, 6 Indicators and 4 Simple or Exponential Moving Averages, specify the type and length of moving averages. You can also set the lengths for each Indicator. Indicators: - RSI – MACD - DMI (+DI and -DI + and ADX) - CCI - MFI - Push - EMA Length 20 (length adjustable) - EMA Length 50 (length adjustable) EMA Length 100 (length adjustable) - EMA Length 200 (length adjustable)
MTF Technical Ratings [Anan]█ OVERVIEW
This indicator is a modified version of "Technical Ratings" v5.0 available in the public library to provide a quick overview of Technical Ratings in 6 optional timeframes.
█ FEATURES
- Multi-timeframe Table.
- Display Technical Ratings for "MAs" with a percentage.
- Display Technical Ratings for "Oscillators" with a percentage.
- Display Technical Ratings for "All" with a percentage.
- Full control of displaying any row(MAs / Oscillators / All) or any column(Multi-timeframe)
- Full control of Table position and size.
- Full control of displaying any row or column.
ORIGINAL DESCRIPTION ABOUT TECHNICAL RATING v1.0
█ OVERVIEW
This indicator calculates TradingView's well-known "Strong Buy", "Buy", "Neutral", "Sell" or "Strong Sell" states using the aggregate biases of 26 different technical indicators.
█ CALCULATIONS
The indicator calculates the aggregate value of two groups of indicators: moving averages and oscillators.
The "MAs" group is comprised of 15 different components:
• Six Simple Moving Averages of periods 10, 20, 30, 50, 100 and 200
• Six Exponential Moving Averages of the same periods
• A Hull Moving Average of period 9
• A Volume-weighed Moving Average of period 20
• Ichimoku
The "Oscillators" group includes 11 components:
• RSI
• Stochastic
• CCI
• ADX
• Awesome Oscillator
• Momentum
• MACD
• Stochastic RSI
• Wiliams %R
• Bull Bear Power
• Ultimate Oscillator
The state of each group's components is evaluated to a +1/0/-1 value corresponding to its bull/neutral/bear bias. The resulting value for each of the two groups are then averaged to produce the overall value for the indicator, which oscillates between +1 and -1. The complete conditions used in the calculations are documented in the Help Center.

Technical Analysis Consulting Table (TACT)Inspired by Tradingview's own "Technical Analysis Summary", I present to you a table with analogous logic.
You can track any ticker you want, no matter your chart. You can even have multiple tables to track multiple tickers. By default it tracks the Total Crypto Cap.
You can change the resolution you want to track. By default it is the same as the chart.
You can position the table to whichever corner of the chart you want. By default it draws in the bottom right corner.
Background colors and text size can be adjusted.
Indicators Used:
Oscillators
RSI(14)
STOCH(14, 3, 3)
CCI(20)
ADX(14)
AO
Momentum(10)
MACD(12, 26)
STOCH RSI(3, 3, 14, 14)
%R(14)
Bull Bear Power
UO(7,14,28)
Moving Averages
EMA(5)
SMA(5)
EMA(10)
SMA(10)
EMA(20)
SMA(20)
EMA(30)
SMA(30)
EMA(50)
SMA(50)
EMA(100)
SMA(100)
EMA(200)
SMA(200)
Ichimoku Cloud(9, 26, 52, 26)
VMWA(20)
HMA(9)
Pivots
Traditional
Fibonacci
Camarilla
Woodie
WARNING: I have observed up to a couple of seconds of signal jitter/delay, so use it with caution in very small resolutions (1s to 1m).
I hope you enjoy this and good luck with your trading. Suggestions and feedback are most welcome.

Technical Ratings on Multi-frames / Assets█ OVERVIEW
This indicator is a modified version of TECHNICAL RATING v1.0 available in the public library to provide a quick overview of consolidated technical ratings performed on 12 assets in 3 timeframes.The purpose of the indicator is to provide a quick overview of the current status of the custom 12 (24) assets and to help focus on the appropriate asset.
█ MODIFICATIONS
- Markers, visualizations and alerts have been deleted
- Due to the limitation on maximum number of security (40), the results of 12 assets evaluated in 3 different time frames can be shown at the same time.
- An additional 12 assets can be configured in the settings so that you do not have to choose each ticker one by one to facilitate a quick change, but can switch between the 12 -12 assets with a single click on "Second sets?".
- The position, colors and parameters of the table can be widely customized in the settings.
- The 12 assets can be arranged in rows 3, 4, 6 and 12 with Table Rows options, which can also be used to create a simple mobile view.
- The default gradient color setting has been changed to red/yellow/green traffic lights
ORIGINAL DESCRIPTION ABOUT TECHNICAL RATING v1.0
█ OVERVIEW
This indicator calculates TradingView's well-known "Strong Buy", "Buy", "Neutral", "Sell" or "Strong Sell" states using the aggregate biases of 26 different technical indicators.
█ WARNING
This version is similar, but not identical, to our recently published "Technical Ratings" built-in, which reproduces our "Technicals" ratings displayed as a gauge in the right panel of charts, or in the "Rating" indicator available in the TradingView Screener. This is a fork and refactoring of the code base used in the "Technical Ratings" built-in. Its calculations will not always match those of the built-in, but it provides options not available in the built-in. Up to you to decide which one you prefer to use.
█ FEATURES
Differences with the built-in version
• The built-in version produces values matching the states displayed in the "Technicals" ratings gauge; this one does not always.
• A strategy version is also available as a built-in; this script is an indicator—not a strategy.
• This indicator will show a slightly different vertical scale, as it does not use a fixed scale like the built-in.
• This version allows control over repainting of the signal when you do not use a higher timeframe. Higher timeframe (HTF) information from this version does not repaint.
• You can adjust the weight of the Oscillators and MAs components of the rating here.
• You can configure markers on signal breaches of configurable levels, or on advances declines of the signal.
The indicator's settings allow you to:
• Choose the timeframe you want calculations to be made on.
• When not using a HTF, you can select a repainting or non-repainting signal.
• When using both MAs and Oscillators groups to calculate the rating, you can vary the weight of each group in the calculation. The default is 50/50.
Because the MAs group uses longer periods for some of its components, its value is not as jumpy as the Oscillators value.
Increasing the weight of the MAs group will thus have a calming effect on the signal.
• Alerts can be created on the indicator using the conditions configured to control the display of markers.
Display
The calculated rating is displayed as columns, but you can change the style in the inputs. The color of the signal can be one of three colors: bull, bear, or neutral. You can choose from a few presets, or check one and edit its color. The color is determined from the rating's value. Between 0.1 and -0.1 it is in the neutral color. Above/below 0.1/-0.1 it will appear in the bull/bear color. The intensity of the bull/bear color is determined by cumulative advances/declines in the rating. It is capped to 5, so there are five intensities for each of the bull/bear colors.
The "Strong Buy", "Buy", "Neutral", "Sell" or "Strong Sell" state of the last calculated value is displayed to the right of the last bar for each of the three groups: All, MAs and Oscillators. The first value always reflects your selection in the "Rating uses" field and is the one used to display the signal. A "Strong Buy" or "Strong Sell" state appears when the signal is above/below the 0.5/-0.5 level. A "Buy" or "Sell" state appears when the signal is above/below the 0.1/-0.1 level. The "Neutral" state appears when the signal is between 0.1 and -0.1 inclusively.
Five levels are always displayed: 0.5 and 0.1 in the bull color, zero in the neutral color, and -0.1 and - 0.5 in the bull color.
█ CALCULATIONS
The indicator calculates the aggregate value of two groups of indicators: moving averages and oscillators.
The "MAs" group is comprised of 15 different components:
• Six Simple Moving Averages of periods 10, 20, 30, 50, 100 and 200
• Six Exponential Moving Averages of the same periods
• A Hull Moving Average of period 9
• A Volume-weighed Moving Average of period 20
• Ichimoku
The "Oscillators" group includes 11 components:
• RSI
• Stochastic
• CCI
• ADX
• Awesome Oscillator
• Momentum
• MACD
• Stochastic RSI
• Wiliams %R
• Bull Bear Power
• Ultimate Oscillator

[jav] HeikinAshized OscillatorsThis script allows to HeikinAshize different commonly used centered oscillators.
It plots them like Heikin Ashi candles. In this way, we can eliminate some of the noise and uncertainty that is inherent to applying only one calculation period to the oscillators.
Applying Heikin Ashi to an oscillator might be advantageous compared to applying it directly to the chart, because you are not altering price readings. The obvious advantage is the clear visualization of the trend directions without noise.
INPUTS
The oscillators included are:
Relative Strength Index (RSI)
Stochastic
Stochastic RSI
Fisher transform
Inverse Fisher Transform of RSI (IFTRSI)
Commodity Channel Index (CCI)
Money Flow Index (MFI)
Chande Momentum Oscillator (CMO)
Momentum (MOM)
True Strength Index (TSI)
Williams' Percent Range (WPR).
Apart from the choice of one of these indicators, only two more inputs are required:
the main (median) period and
the % of variability of this period.
RESULTS
The script calculates 4 evenly spaced periods from that data (period and variability), e.g. for a period of 50 and a variability of 30%, the script calculates oscillator values for 4 different periods evenly spaced around 50, (35, 45, 55, 65) and uses these 4 values to draw the Heikin Ashi candle.
The script also plots the usual upper/lower (overbought/oversold) values, as well as the central line.
CREDITS
The interesting concept of applying Heikin Ashi to an oscillator was recently introduced in Tradingview by @JayRogers . Many thanks for the idea.
For Heikin Ashi calculations, the useful script by @allanster was taken as a reference.
Any improvements, modifications or suggestions are welcome.

Technicals Rating Strategy v420Ichimoku, HMA, RSI, Stoch, CCI, MACD, Technicals Rating Strategy is a trading Bot that looks at these chosen indicators and assigns a value to each, then calculates the result of adding each indicators result value to a overall rating, which is then compared to a user set level. Here seen on Bitcoin, it has the broker fee included in the testing result. If you choose to use it on Forex etc, perhaps remove the broker fee which is unrealistic for FX trading.
It has a Win/Loss ratio of only 40% wins, but it catches the big moves and thats the main thing, so if ELON MUSK had of used this strategy instead of BUY and HOLD, he could of made 700% instead of 7% (as is, may, 2021)
Mainly intended for use as Automated TRADE BOT.
(imagine if Elon Musk did use this bot with his 1.3 billion $ worth of BTC, the drawdown would be like, half a billion or something haha (p.s.- use smaller lotsize % to get smaller drawdown, but then smaller profit....) )
For use with any pair and timeframe. In fact there is a timeframe setting to set the strategy to look at alternative timeframe from chart, but as default will just be set to charts timeframe.

Indicator PanelHello All,
This script shows Indicator panel in a Table. Table.new() is a new feature and released today! Thanks a lot to Pine Team to add this new great feature! This new feature is a game changer!
The script shows indicator values for each symbol and changes background color of each cell by using current and last values of the indicators for each symbol. if current value is greater than last value then backgroung color is green, if lower than last value then red, if they are equals then gray.
You can choose the indicators to display. Number of columns in the table is dynamic and is changed by number of the indicators.
You can choose 5 different Symbols, 6 Indicators and 2 Simple or Exponential Moving averages, you can set type of moving averages and the lengths. You can also set the lengths for each Indicators.
Indicators:
- RSI
- MACD ( MACD and Signal and Histogram )
- DMI ( +DI and -DI + and ADX )
- CCI
- MFI
- Momentum
- MA with Length 50 (length can be set)
- MA with Length 200 (length can be set)
In this example RSI, MACD and MA 200 were chosen, you can see how table size changes dynamically:
Enjoy!

SignalCAVE Strategy BuilderYou can create strategies without writing single line of Pine Script code!
Do backtesting, set alerts and explore algorithmic trading with using SignalCAVE Strategy Builder on TradingView.
SignalCAVE Strategy Builder for TradingView
SignalCAVE is a tool that help you to create strategies in TradingView. SignalCAVE offers flexible strategy builder panel enabling users to backtest and set alerts with custom conditions (selected indicators and parameters).
CAPABILITIES
You can define rules and conditions for “Long” and “Short” signals.
“Stop Loss” or “Take Profit” functions can be activated with providing percentage values.
“Only Long”, “Only Short” or both “Long and Short” signals can be used at the same time.
Available Indicators
EMA, SMA, WMA, HMA, RSI, MACD, Stochastic, Bollinger Bands, SuperTrend, Parabolic SAR, DMI, ATR, CCI, CMF, ROC, Ichimoku, OHLC Prices
How to Set Strategy Rules?
On SignalCAVE strategy settings screen, there are four types of input groups. You can populate these input boxes based on your strategy.
A: First indicator’s parameter and index value selection area
First Input: First indicator selection.
Second Input: First indicator’s parameter selection. If you want to use default parameters, select “Default Parameters”. If you want to use custom parameters, select “Custom Parameters”. If your selection was custom, then you need to fill “P:A” input boxes to assign your custom parameter.
Third Input: First indicator’s index selection. Default parameter is “0”, If you want to get previous value of indicator/price, you can type positive numbers.
?: Condition and Interval selection area.
You can select “Upper (>), Lower (<), Upper or Equal (>=), Lower or Equal (<=), CrossOver (⬆), CrossUnder (⬇)” conditions and time frame interval for calculation both first (A:) and second (B:) indicator.
B: Second indicator’s parameter and index value selection area
First Input: Second indicator selection.
Second Input: Second indicator’s parameter selection. You may use either default parameters, or custom parameters. If your selection was custom, then you need to fill “P:B” input boxes to assign your custom parameter.
Third Input: Second indicator’s index selection. Default parameter is “0”, If you want to get previous values of indicator/price, you can type positive numbers.
P:A First indicator’s custom parameter settings. If selected indicator has less then four parameters, you can fill unnecessary fields with “0” value.
P:B Second indicator’s custom parameter settings. If selected indicator has less then four parameters, you can fill unnecessary fields with “0” value.
DASHBOARD
After you build the strategy with SignalCAVE, you can see rules and conditions on dashboard with chart view screen.
Hint: By adding multiple times of SignalCAVE strategy on your chart screen, you can build more then one strategy.
STRATEGY TESTER / BACKTEST RESULTS
You can see strategy backtest results from “Strategy Tester” panel.
By changing parameters or strategy rules (strategy optimization), you may get better results. These results does not guarantee a success for future trades.
ALERT SETTINGS
If you want to get notify about your strategy outputs (Long Entry, Long Exit, Short Entry, Short Exit, Stop, Take Profit) you can set an “Alert”.
You can click “Alert” button to create a new alert. Make sure on “Conditions” selection must be “SignalCAVE” strategy.
Paste to “Message” field exactly the text below.
{{strategy.order.alert_message}}
Hint: By setting a single alarm, you can get notifications for all outputs.
Do your alerts modifies when you change the strategy conditions or parameters?
While the strategy got updated, its alerts still use the strategy’s state from the time when we made the alert (TradingView Wiki, 2018b).
This has the advantage that, once we made a script alert, we can change the script’s input options, change chart settings, or remove the script from to the chart. All of that won’t affect our existing alert. That gives a lot of flexibility to keep interacting with the chart and script.
But there’s also a disadvantage: if we do want our script’s alerts to change, we first need to remove the existing alerts. Then we have to create and configure new alerts based on the indicator’s updated code or settings.
