G-BOT ENGULFING CANDLE - FIXED SL & TP // Description:
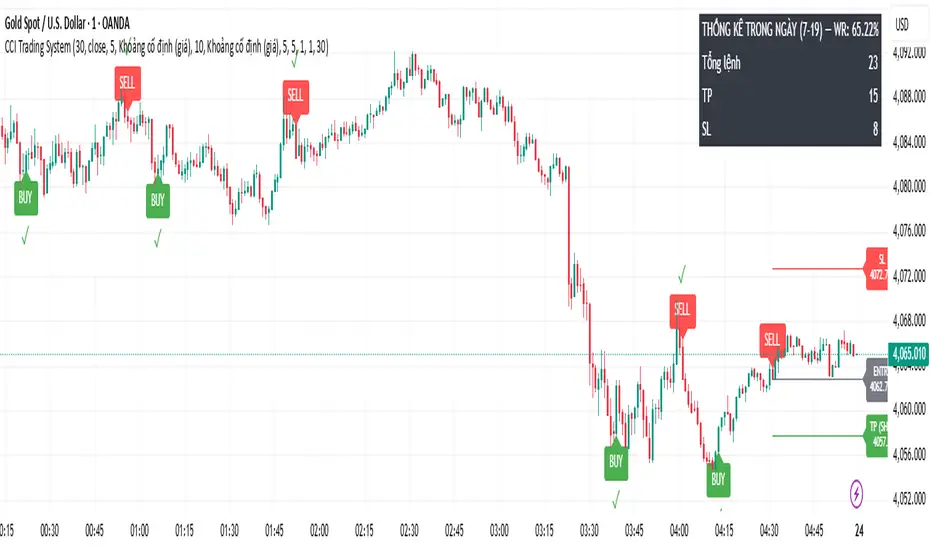
This Pine Script strategy identifies bullish and bearish engulfing candle patterns over a defined lookback period and places trades based
on recent market highs and lows. It calculates stop loss and take profit levels using the Average True Range (ATR) multiplied by a user-defined factor, with the ability to adjust the risk-to-reward ratio for each trade.
Pine Script® strategy