HAZ_10FSuper Trends Bot 10Frams .
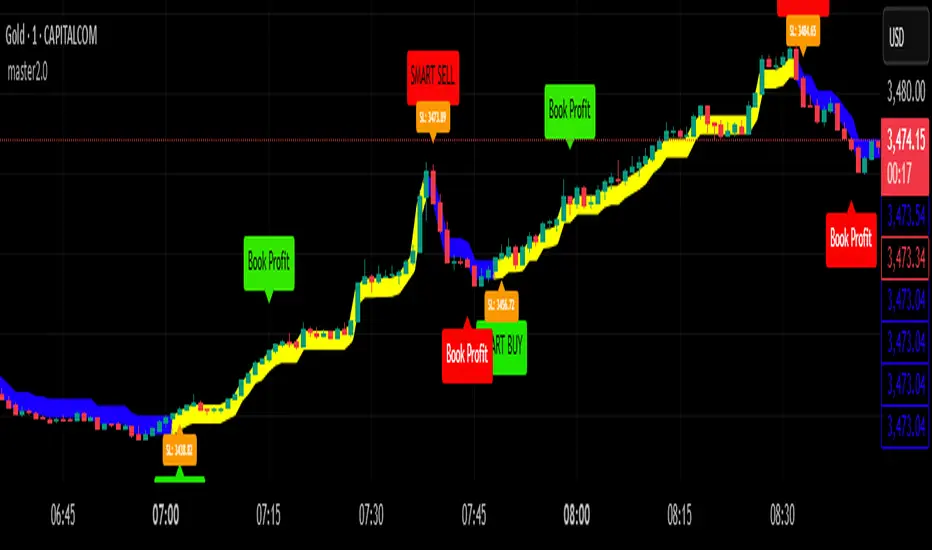
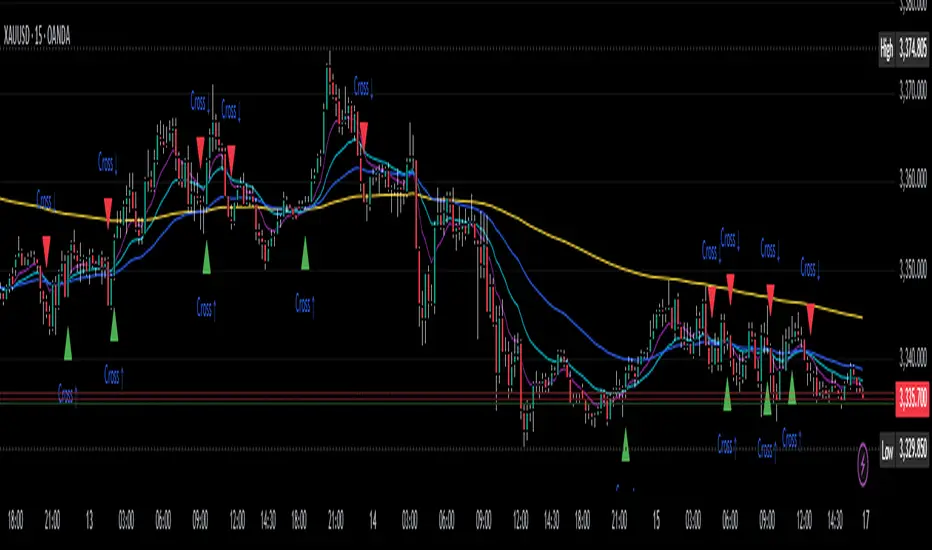
A custom indicator that displays enhanced candles with a dynamic signal line and ATR-based alerts.
It highlights market direction using color-coded bars and provides clear buy/sell signals for entries and exits.
Designed for traders who want quick signals and smoother price action with reduced market noise.
Pine Script® indicator