Mavilim Multiple Trend By BDweekly mavilim line,daily mavilim line and more,within your current chart. and shows multiple mavilim trend. if u need something like this
Search in scripts for "trend"

Multiple Trend Indicatorweekly 21wma,daily 21wma and more,within your current chart. and shows multiple trend. if u need something like this

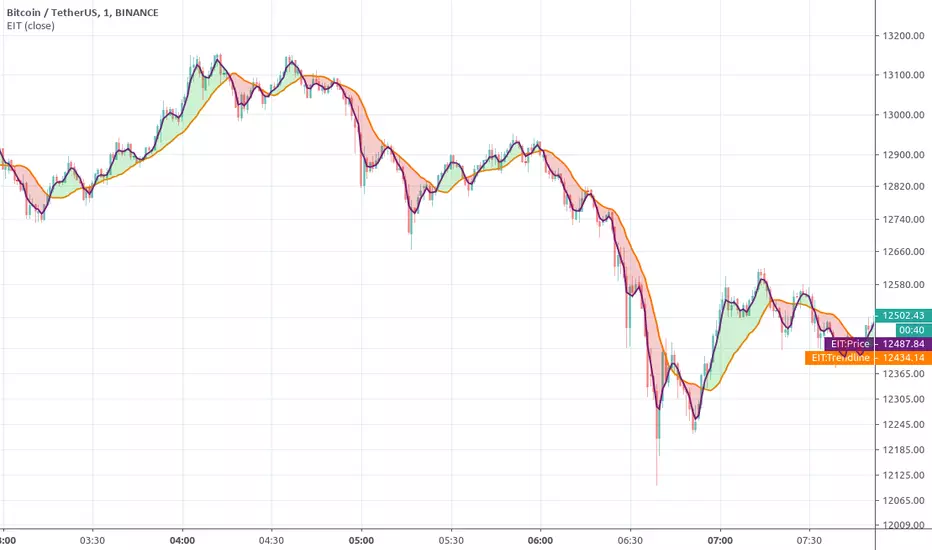
Ehlers Instantaneous TrendlineEhlers Instantaneous Trendline script.
This indicator was described by John F. Ehlers in his book "Rocket Science for Traders" (2001, Chapter 10: The Instantaneous Trendline).
[ALERTS]Super-Trend & SL/TP V3This simple script analyzes the trend in real time...
Alerts, SL, TP, bla, bla, bla...

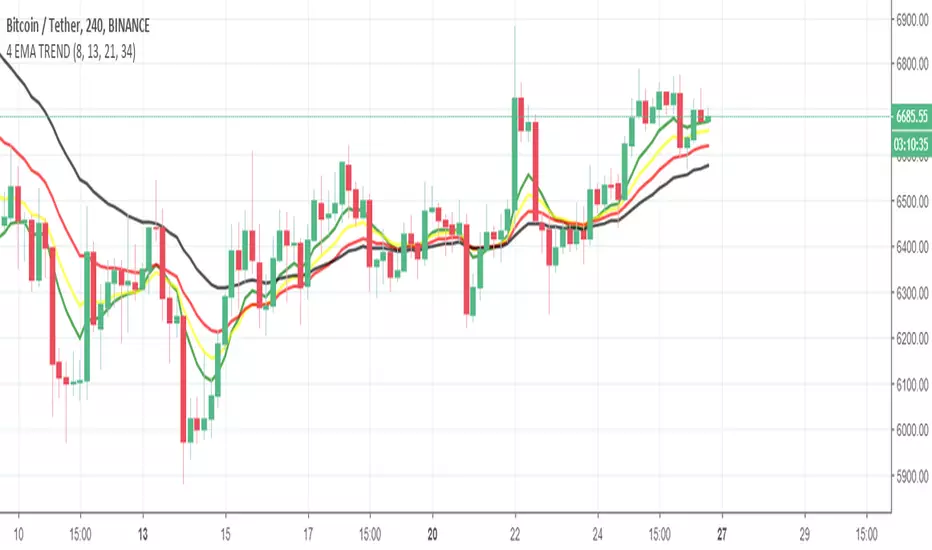
4 EMA TREND INDICATORİf GREEN > YELLOW > RED > BLACK
UPWARD TREND
If BLACK > RED > YELLOW > GREEN
DOWNWARD TREND
In upward trend , if green(fastest ema) crossunder YELLOW or RED or both of them , you can close the position . Dont wait the Downward Trend.
Lengths of EMAs are based on Fibonacci numbers ( 8,13,21,34) , if you want, you can change it based on your strategy.
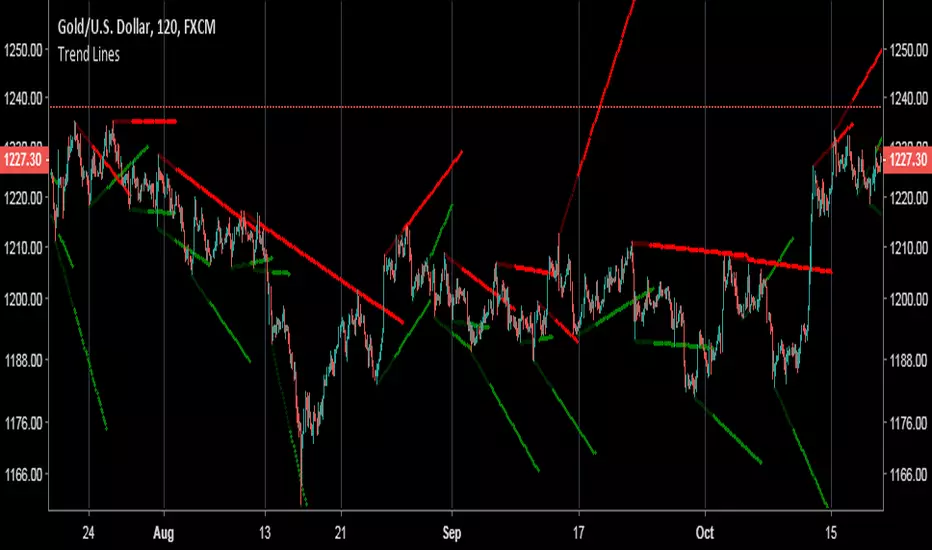
Free Trend Lines Tool/IndicatorI don't trade much with trend lines, but I was bored so made this hopefully someone will make use of it or program a strategy with it or something like that. It finds the highs and lows, works out the distance in time and price, then uses that to calculate the angle of the trend which can be used to pain the trend line. If you have any questions on how to implement it into a strategy feel free to ask. It is written in quite a messy wayt so sorry about that.
120/60 Trend ModelCombination of 120 & 60 EMAs used to determine entries as well as the over all trend.
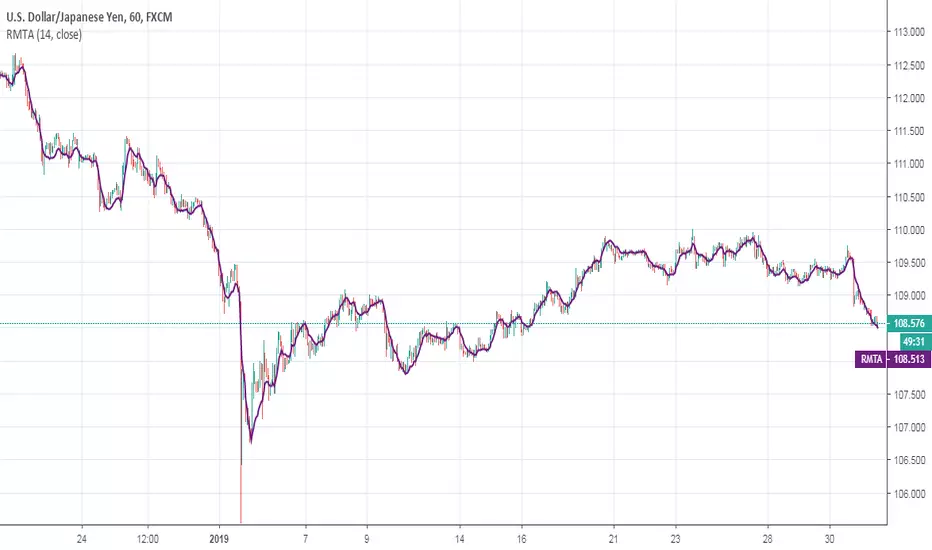
Recursive Moving Trend AverageRecursive Moving Trend Average indicator script.
This indicator was originally developed by Dennis Meyers (Stocks & Commodities V.16:12, The Yen, Recursed).

Ichimoku Cloud (Log-Space) - perfect trend areaLog space ichimoku cloud which display perfect bearish trend and perfect bullish trend.
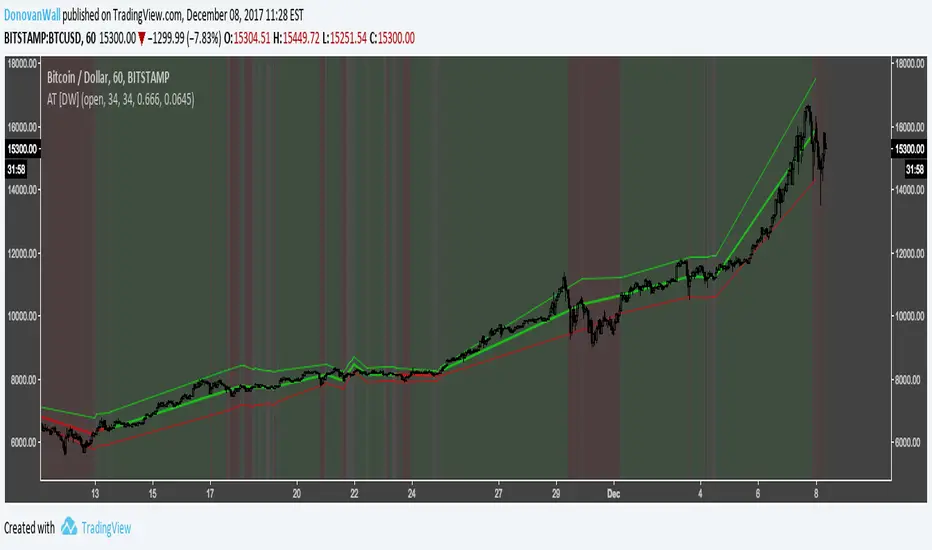
Angular Trend [DW]This is an experimental study designed to outline the trend of a security based on the average angular change of price.
New lines are drawn whenever the source's angle of change is equal to zero.
Trend Strength IndicatorThis indicator uses Heiken Ashi candle data to plot trend strength signals to your chart.
Bright Green: Heiken Ashi candle data is still putting in higher lows and higher highs, and the price closed above the previous low.
Dark Green: Heiken Ashi candle closed green, but had a lower low or lower high (trend weakening).
Bright Red: Heiken Ashi candle data is still putting in lower lows and lower highs, and the price closed below the previous high.
Dark Red: Heiken Ashi candle closed red, but had a higher low or higher high (trend weakening).
Optional: I included a setting for allowing high RSI values to overrule Heiken Ashi values (disabled by default).
This kind of indicator is best used for managing open positions rather than entering trades. It works on all timeframes and instruments.
Feel free to contact me if you have any questions :)
Regards,
- Matt
PS. Here's a snapshot of it against a Heiken Ashi chart for reference:
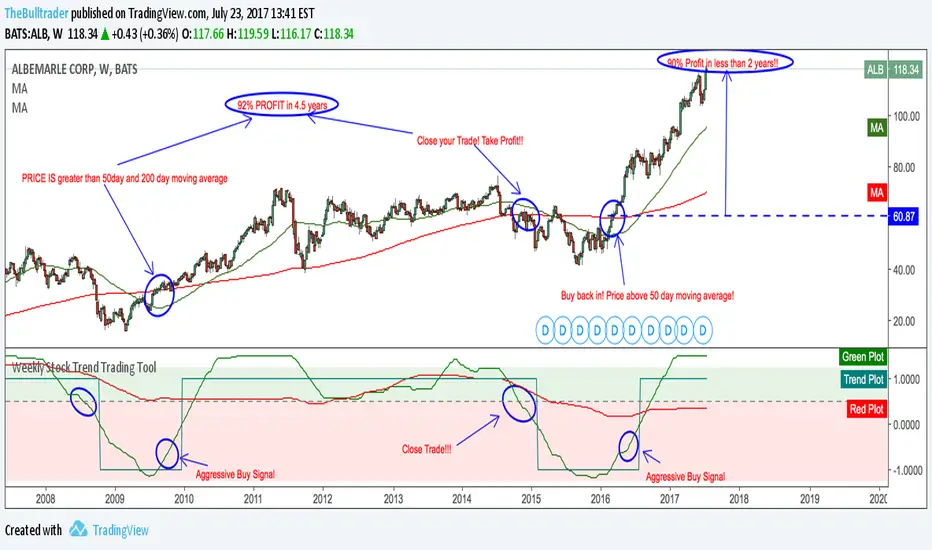
Weekly Stock Trend Trading Tool// Created by TheBullTrader, 2017.
// Hi everyone, welcome to my Weekly Trend Trading Tool with the 50 day and 200 day moving averages
// This indicator scores each stock/ index individually and scores them on a simple scale -1.5 to +1.5
// This indicator has 2 zones: green zone = bullish, and red zone = bearish
// There are 3 plots: green = 50 day sma, red = 200 day sma, and trend signal= teal
// Buying Signal is when the green plot crosses teal plot or AGGRESSIVE Buy = green plot beginning to curve up from bearish zone.
// Sell Signal is when the green plot enters the RED ZONE
// By using this indicator as described, it will help you pick stock bottoms and COULD GET YOU OUT OF A STOCK CRASH!
// Recommendations is to scan this indicator against the top 100 US stocks with a long stock history greater than 10 years.
// I usually find 5-10 really good deals every few months. Slow and Easy way to build wealth. **Thanks for reading**
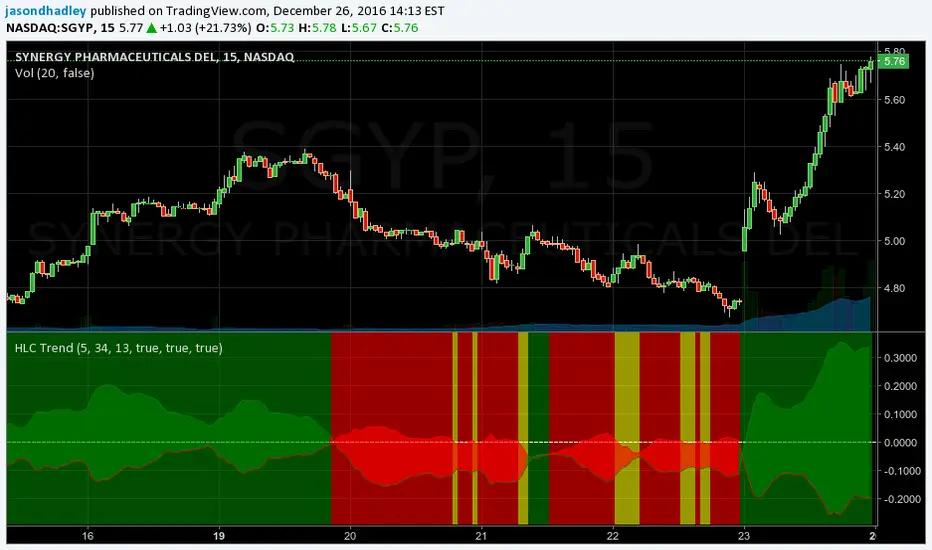
HLC Trend IdentifierIdentifies trends based on a comparison of a High, Low, and Close moving average.
Optionable: By default the Moving Average type is set to EMA but is switchable to a SMA instead.
Optionable: By default it shows cloud coloring of Green or Red based on crossover points.
Optionable: By default it colors the indicator background:
- Green = uptrend
- Red = downtrend
- Yellow = neutral
Romi Trend and Momentum Oscillator
Great oscillator which determines trend and momentum. So accurate it could be used as a stand alone indicator.

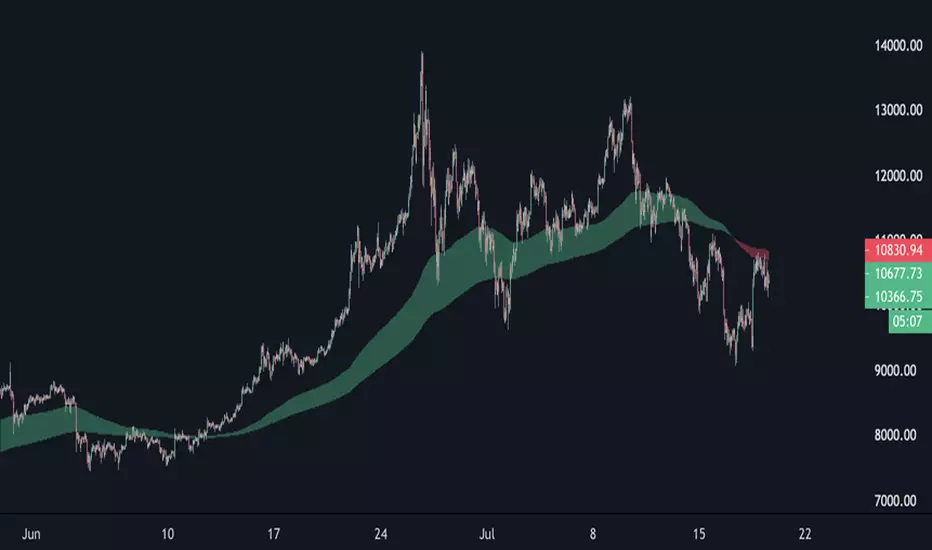
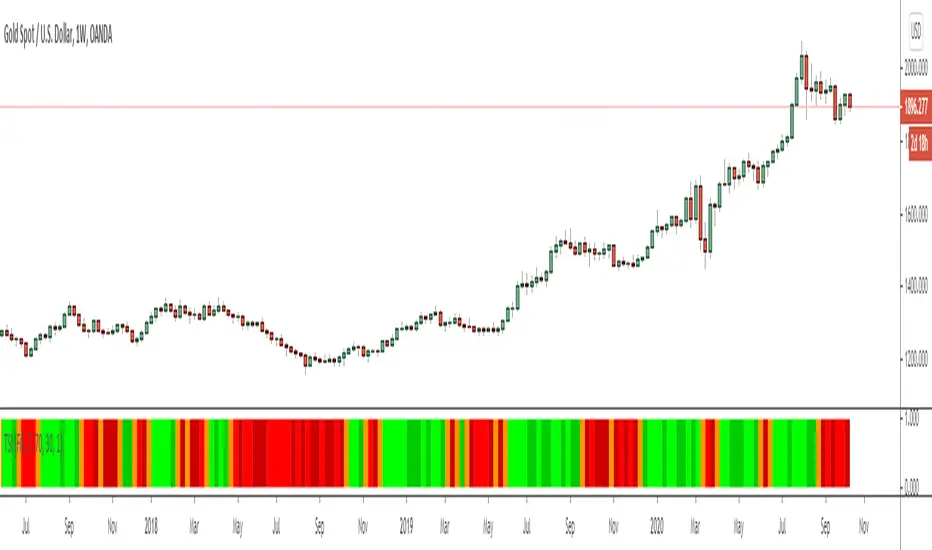
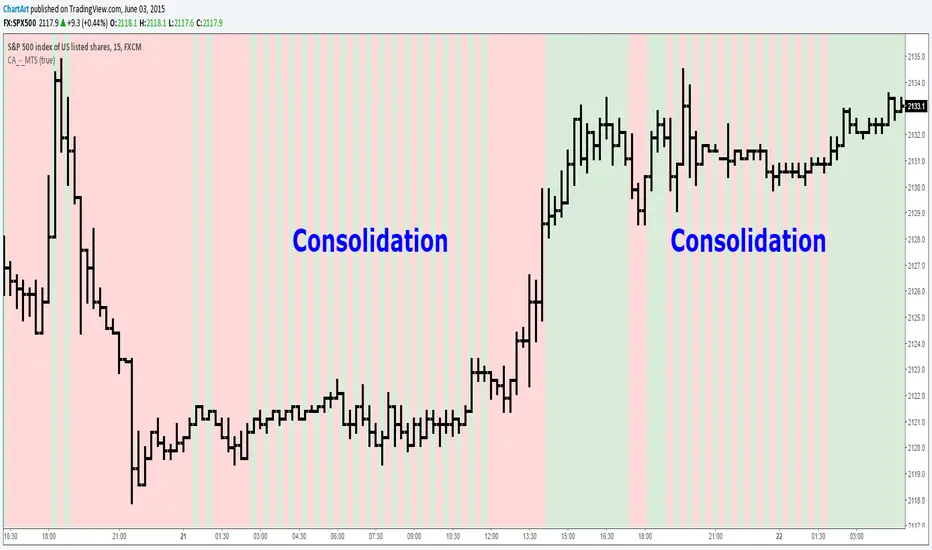
Market Trend Strength (MTS) (by ChartArt)See the current trend strength of the market. An additional filter makes trend consolidation areas visible. The color changes there each bar back and forth between green and red.
This area was interesting. Would have been a better example:
If the filter is deactivated the indicator shows the last measured price trend (green for up and down for red).
Trend Trader Strategy This is plots the indicator developed by Andrew Abraham
in the Trading the Trend article of TASC September 1998

Historical Range (Using eStrategy library)⬜ The script is intended to cover few things.
▶ Strategy testing framework based on eStrategy library
▶ Using historicalrange of values for identifying better entry and exits.
This is also built on top of the Systematic Investment Plan script published here
⬜ Strategy testing framework
Strategy testing framework is different from tradingview default strategy testing from few ways to suit the needs of systematic investments.
▶ Supports recurring investment on top of initial investment to emulate adding further funds to the investment bucket on regular basis.
▶ Better calculation of drawdowns based on daily equity rather than drawdown calculated only on close of trade.
▶ Provides better control over how much strategy can reduce and reload
Having said that, this framework is not intended as replacement for tradingview strategy framework. It is not as comprehensive as tradingview strategy framework. But, created to address few specific styles of strategy.
▶ No detailed trade stats on individual trades. But, this can be implemented in future versions
▶ At present only facilitates long positions.
▶ UI features such as plotting trades on chart are not available.
▶ Does not take into consideration of slippage and brokerage - this is not an issue because the framework is not meant for short term trades. It is only made for daily timeframes.
▶ No pyramiding or leverage possible.
And many more...
Framework can be used for similar strategies based on market timing with few small changes.
⬜ Historical Range Strategy
Concept here is, instead of taking indicators such as oscillators as is, use historical percentile to derive better oversold and overbought conditions. Strategy provides different options to base historical range. This can either be based on
▶ Band percent
▶ Oscillator
Different choices of bands and oscillators are also available to chose. However, have not done extensive testing on all the combinations.
⬜ Settings
▶ Initial and recurring investment settings (As confirm inputs)
▶ Buy and hold and strategy specific settings to be used for stat calculation
▶ Band and oscillator parameters
These are straightforward parameters which is used for defining the base of either bands or oscillators.
▶ Percentile moving average parameter
Percentile MA is used with Percentile to find entry and exit signals based on crossover and crossunder.
Feedbacks and suggestions welcome.

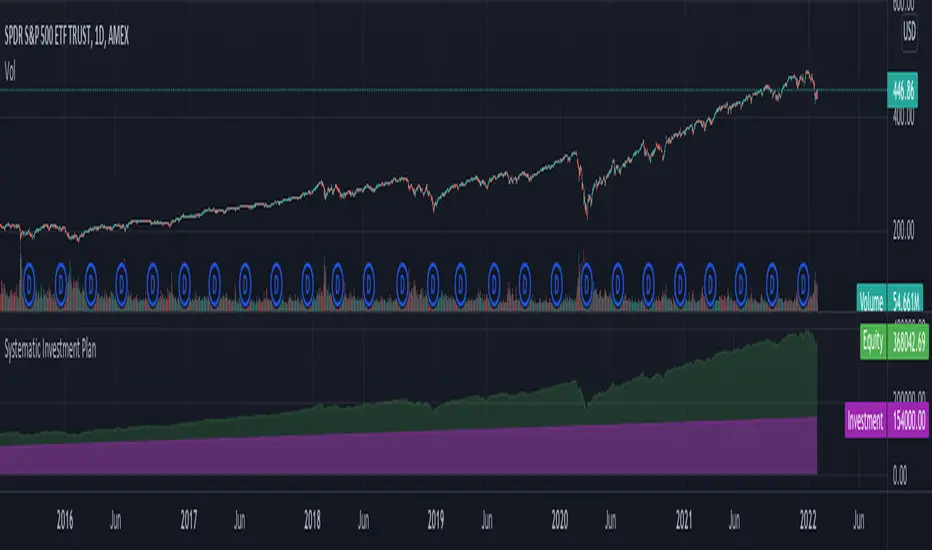
Systematic Investment PlanTradingview default strategy tester has few limitations. To name some:
Tradingview default strategy tester does not have option for periodic investment.
Does not allow reduce and refill kind of operations.
Comparison to buy and hold equity does not take into consideration on number of days invested
Hence, I created this as base for my further experiments with respect to strategies involving market timing.
Settings are quite simple and self explanatory.
X-Mas TreeLet's play a game!! Find your Christmas Tree and post it in the comments.
How to use the script?
Open any instrument which best describes the Christmas Tree (Preferably on hourly timeframe).
Apply X-Mas Tree script on the chart.
Enjoy the snowfall, changes in lightings and other animations. Animations only happen if the instrument is in trading session. So, stocks and indexes do not work on weekends and holidays. Use crypto as they are traded 24X7.
Unfortunately cannot post moving charts. But, snapshot of chart will do :)
Well, Please don't ask these questions for this script (Also thanks to @Bjorgum for contributing to this section) 😃
Can you please add alerts?
Does it repaint?
Can we use this for crypto/stock/forex bla bla?
Can you convert this to strategy?
How can I access this indicator?
Can you please give access or how much does it cost?
Can you make it available for MTF?
Indicator is broken. Getting so and so error message etc.
Wish you all MERRY X-MAS and HAPPY NEW YEAR!!

Run TimerThis is a simple utility which counts the number of bars and time elapsed after starting the script. This can be used in time or bars based conditions to modify script behavior.
This particular script does the following:
Starts timer when script is added to chart
Timer is green when starting and continues to be in green if the right Auth key is used in input (Which is hardcoded as 1234 here)
If right auth key is not provided in the input, timer background turns red after trial bars.
Script can be modified to use elapsed time instead.
Thanks to @Bjorgum on assisting on few calculations :)

Percentile - Price vs FundamentalsThis is done in the same lines of below scripts
Drawdown-Price-vs-Fundamentals
Drawdown-Range
Instead of using drawdown, here we are only plotting percentile of drawdown. Also added few more fundamental stats to the indicator. Also using part of the code from Random-Color-Generator/ to automatically generate colors. This in turn uses code from @RicardoSantos for convering color based on HSL to RGB
This is how the study can be used:
Study plots percentile of price and each of the listed fundamentals based on history. History can be chose All time or particular window. If any fundamental or price is near 100 - which means it is nearer to its peak. And if something is near its bottom, it is nearer to its 0th percentile.
Price of the stock is considered undervalued based on historical levels when it is below most of the fundamentals. Price is considered overvalued based on historical levels when it is above all the fundamentals. Please note, being undervalued does not guarantee immediate mean reversion. Stocks can stay undervalued for prolonged time and can go further down. Similarly overvalued stock can stay overvalued for prolonged time before correcting itself or justifying the position. Hence, further discretion needs to be used while using this study.
Few examples:
AMZN seems to be trading in range and so are the fundamentals:
MSFT at peak along with half of the fundamentals. But, debt levels are going up along with margins reducing.
LPX is trading at 15% discount whereas most of the fundamentals are at the peak.
FLGT price seems to have gone down further whereas fundamentals look pretty healthy.
