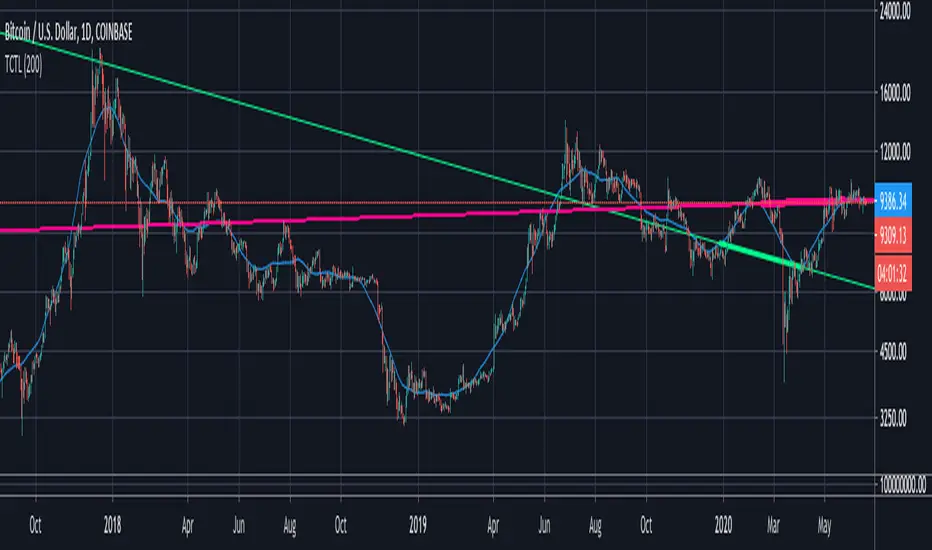
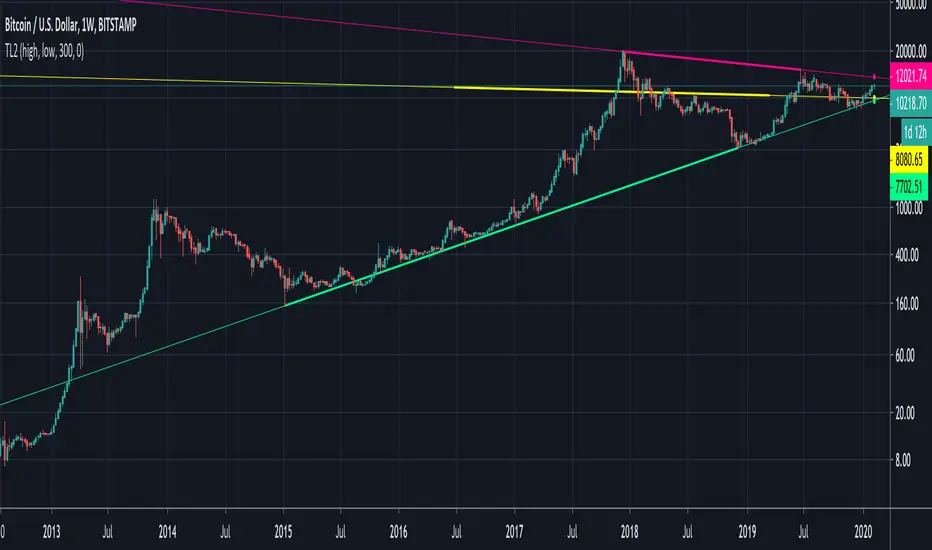
Trend Lines, Supports and Resistances█ OVERVIEW
This is a simple script that draws trend lines, supports and resistances based on the highs and lows of pivots and is developed solely for practice purposes while learning the Pine Script language.
█ FEATURES:
Ability to change pivot length and mark pivots on chart.
Ability to change amount of pivot points that used to generate trend lines or support and resistances.
Ability to set exception for last "n" bars for breaks.
Ability to set exception up to "n" times for breaks.
Ability to see broken trend lines as ghosts.
Ability to set alarms for breaks.
Ability to change colors and line widths.
And many more...
█ DISCLAIMER:
Trading is risky and most of the day traders lose money eventually. This indicator is only for educational purposes and should not be construed as financial advice. Past performances does not guarantee future results.
Search in scripts for "trend"

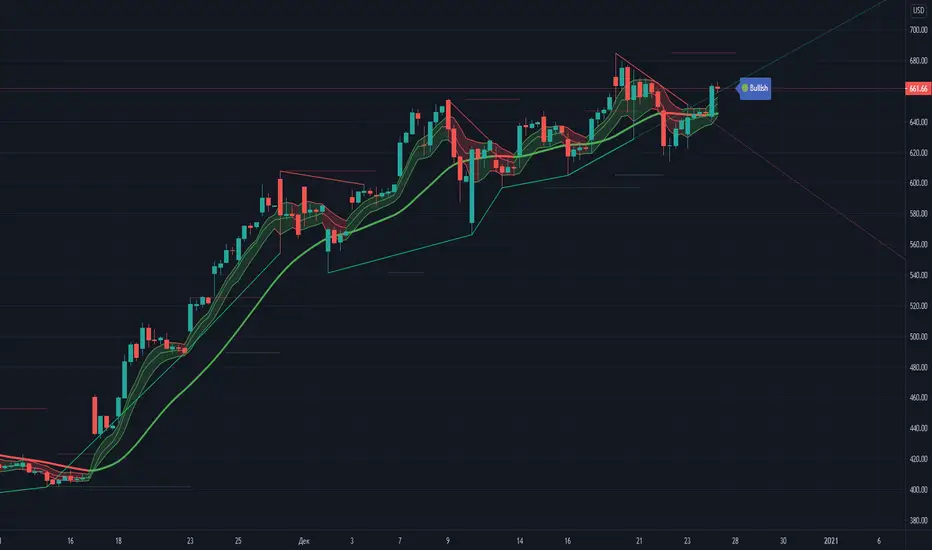
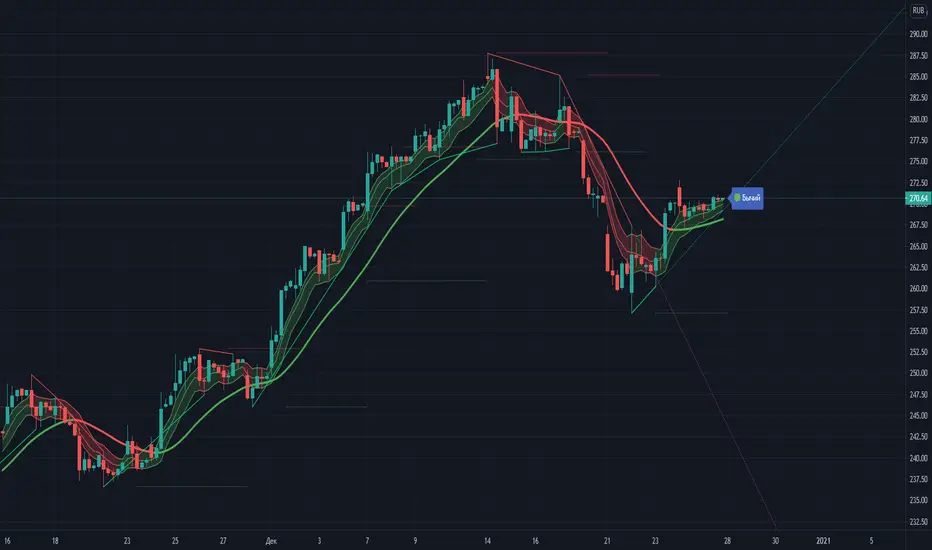
Trend IdentifierTrend Identifier for 1D BTC.USD
It smoothens a closely following moving average into a polynomial like plot.
And assumes 4 stage cycles based on the first and second derivatives.
Green: Bull / Exponential Rise
Yellow: Distribution
Red: Bear / Exponential Drop
Blue: Accumulation
Red --> Blue --> Green: indicates the start of a bull market
Green --> Yellow --> Red: indicates the start of a bear market
Green --> Yellow: Start of a distribution phase, take profits
Red --> Blue: Start of a accumulation phase, DCA

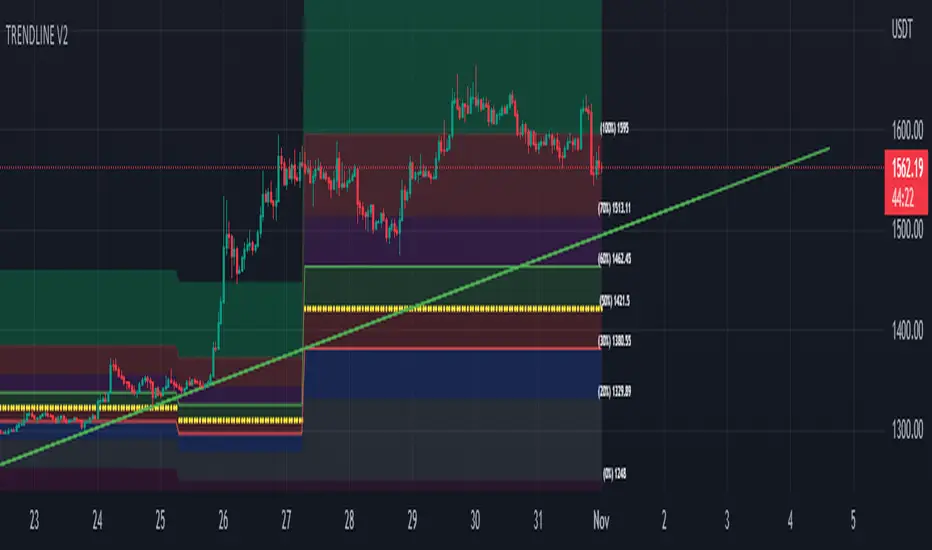
TRENDLINE V1Hello all ...
this is the source trendline of the three pivots
with adjustable resolution and length
function to find a breakout or breakdown
Trend Day IndentificationVolatility is cyclical, after a large move up or down the market typically "ranges" during the next session. Directional order flow that enters the market during this subsequent session tends not to persist, this non-persistency of transactions leads to a non-trend day which is when I trade intraday reversionary strategies.
This script finds trend days in BTC with the purpose of:
1) counting trend day frequency
2) predicting range contraction for the next 1-2 days so I can run intraday reversion strategies
Trend down is defined as daily bar opening within X% of high and closing within X% of low
Trend up is defined as daily bar opening within X% of low and closing within X% of high
default parameters are:
1) open range extreme = 15% (open is within 15% of high or low)
2) close range extreme = 15% (close is within 15% of high or low)
There is also an atr filter that checks that the trend day has a larger range than the previous 4 bars this is to make sure we find true range expansion vs recent ranges.
Notes:
If a trend day occurs after a prolonged sideways contraction it can signal a breakout - this is less common but is an exception to the rule. These types of occurrences can lead to the persistency of order flow and result in extended directional daily runs.
If a trend day occurs close to 20 days high or low (stopping just short OR pushing slightly through) then wait an additional day before trading intraday reversion strategies.

Trend intensity 65 TI65––––History & Credit
This indicator has been inspired by public videos of StockBee and his community. Stockbee is a famous successful trader, who has approach to detail and backtesting. The TI65 is a great confirmation tool for the trend strenght.
–––––What it does
TI65 is an indicator that measures trend and momentum over 65 days.
When there is a green cloud we have a confirmed uptrend with certain velocity.
The calculation is simple as it measures the ratio between the 7d SMA over the 65D sma.
–––––How to use it
Look for entry points when during green trade intensity.

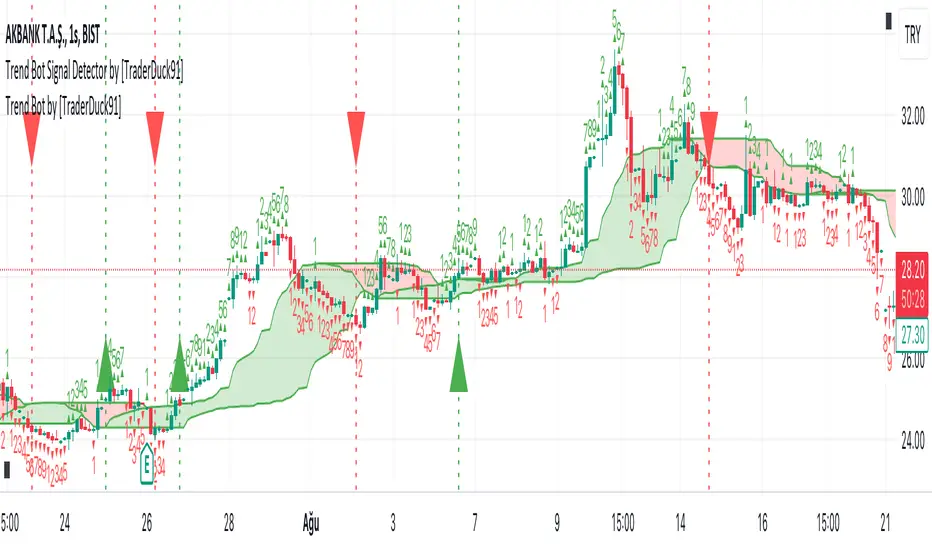
Trend Bot by [ToplaninKizlarUcuyoruz]Description:
1. Just a moving average strategy used in this indicator.
2. If the src2 (you can change it in settings) close above highest MA, appear the long signal.
3. And if the src2 close under the lowest MA, appear the short signal.
How is it using:
Green is an uptrend. Red is a downtrend.
-If you see the green up triangle signal, open long (and close short)
-If you see the red down triangle signal, open short (and close long)
*** Please check signals with your own strategy and your favorite indicators ***
inspired by the original open source indicator and added some new setting options:
(click on the image to open the original indicator's page)
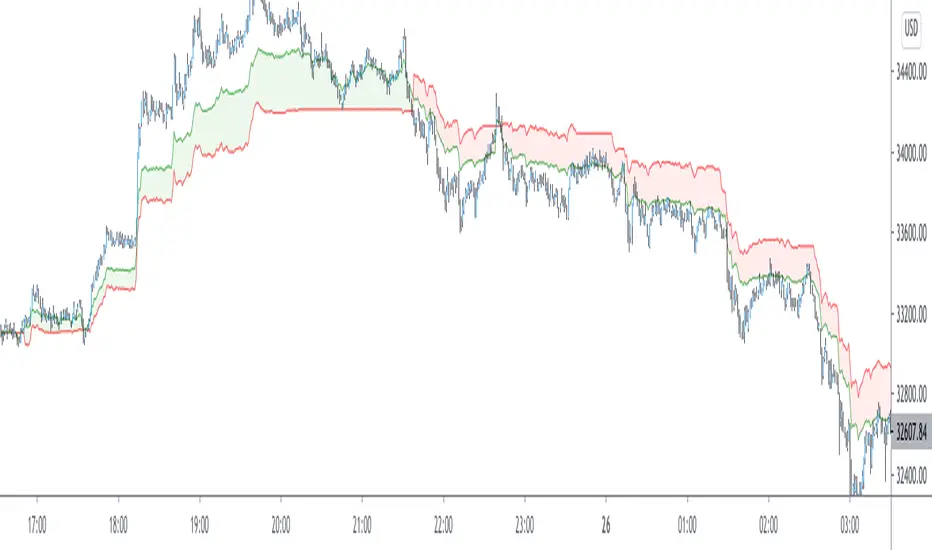
Trend MagicTrend Magic is originally a MT platform (MetaTrader) indicator and it can be used with any forex trading systems / strategies for additional confirmation of trading entries or exits. Converted the MT platform code to TradingView Pine version 4. Also you can use Multiple Time Frame.
It also works well with Crypto and Stock Markets.
Trend Magic consists of two main calculation parts as momentum and volatility:
First part is ATR based (like ATR Trailing Stop) logic, second part is all about CCI which also determines the color of Trend Magic.
Blue: when CCI is positive
Red: when CCI is negative
Also added alert condition regarding price crosses :
when LOW CrossesAbove TM
and HIGH CrossesBelow TM
Enjoy
Kıvanç Özbilgiç

Trend Line Fibonacci [TLF]TLF is a price based Adaptive Scalping Indicator ideally to be used over lower timeframes
1min, 5min,.... 30 min
Its made using pivot calculations of fibonacci lookback lengths, which gives it an adaptability
default lookback lengths are:
55,89,144,233
This indicator is a pine script clone of Trend Line Fibonacci as available in MT4
google search ( prorealcode , trend line fibonacci )
Trend Visualizer with S/RDetection and color visualization of the trend direction by constructing a candle envelope based on exponential moving averages and a double exponential moving line.
Analysis of highs and lows and construction of trend lines.
Showing support/resistance levels and trend forecast.
English version.
Trend Visualizer with S/R (Russian version)Обнаружение и цветная визуализация трендового направления путем построения свечного конверта по экспоненциальным скользящим средним и линии двойной экспоненциальной скользящей.
Анализ максимумов и минимумов и построение трендовых линий. Показ уровней поддержки/сопротивления и прогноз тренда.
Рускоязычная версия интерфейса. Англоязычная версия позже.
Detection and color visualization of the trend direction by constructing a candle envelope based on exponential moving averages and a double exponential moving line.
Analysis of highs and lows and construction of trend lines. Showing support/resistance levels and trend forecast.
Russian-language version of the interface. English version later.
Trend Trader Buy/Sell SignalsTrend Trader
The code is open source, what it uses to print signals is MACD cross and ADX. Bar colors change in relation to where price is according to the 50 day MA. The MA ribbon is used for visualizing trend and using it for dynamic support/resistance. The ribbon is comprised of the 50 day and 100 day MAs.
Main reason to publish this script is because some like to jumble up scripts together slap some moving averages on it to "follow trend" and then label it an algorithm, market it and sell it to people online. No single system will work 100% of the time, do you due diligence in anything you are interested in buying. Plenty of free scripts in the TV library that can do you justice when trading.

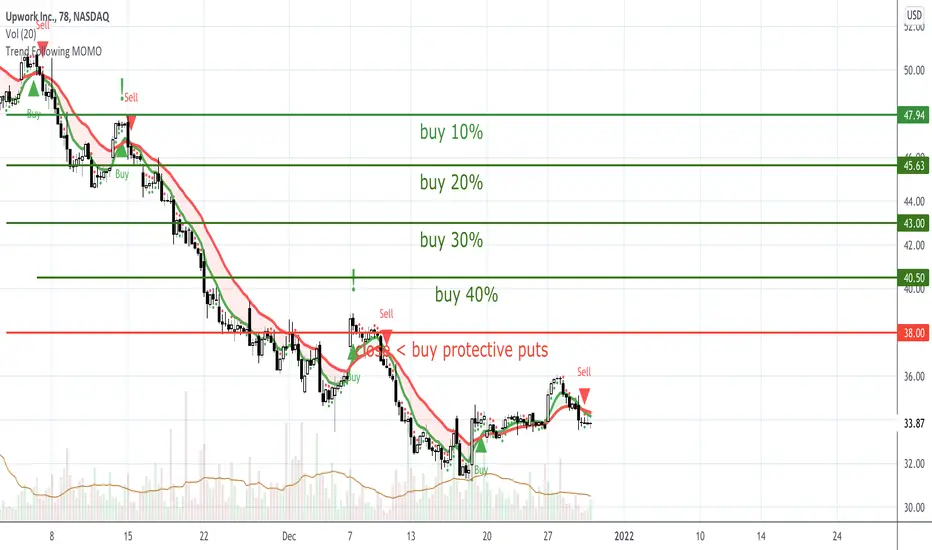
Trend Following MOMOIngredients
Daily chart
8ema & 21ema on a 78-minute chart
Trend Following v1 indicator for TradingView (optional)
Steps
Identify stocks that tend to move the same direction for one or more weeks at a time.
Find and locate stocks where the 8ema is crossing above (bullish) or below (bearish) the 21 ema on a 78-minute chart.
If the 8ema > 21ema, the indicator will show a GREEN shaded area , be bullish OR if the 21ema > 8ema, the indicator will show a RED shaded area, be bearish.
Buy to open with a “Limit buy” order if a green arrowis present at CLOSE of a 78-minute candle or sell to open with a “limit sell” or if a red arrowis present at CLOSE of a 78-minute candle.
Use either stocks or options. allocate the same $$ for each trade, continue in the trend (stay in the trade) until you 1) trend is changing. 2) ready to lock in profits.
Optional
The shift from bearish to bullish is the best scenario, consider Long only / short only / long and short.
Set alerts “Trend Reversal” inside the v1 trend following TradingView indicator and ONLY trade your alerts.
Premium indicator has built-in strategy tester.
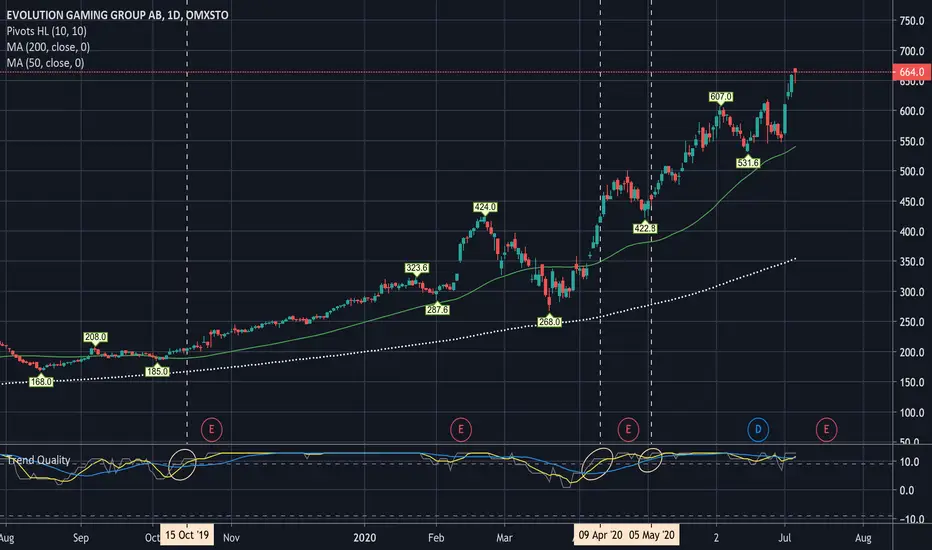
Trend QualityThe quality of the current trend is calculated by adding or subtracting
one point to the total value depending on the following criteras:
1. EMA-8, MA-20, MA-50, MA-100, MA-200 , each get a point if they are increasing.
2. EMA-8 > MA-20 > MA-20 > MA-50 > MA-100 > MA-200 , each condition that is true gets one point.
On top of the Trend Quality value we apply a "weekly" (5 periods) and
a "monthly" (22 periods) moving average.
When above a value of 5, a strong trend is indicated and hence
a trend following strategy should be used.
Use this to Buy when bouncing back from e.g MA-20 or a confirming
consolidation/candlestick/trendline pattern.
When the trend decreases below Zero a trend shift may have occured.
Idea, curtesy: Tobbe Rosèn
Trend Counter-Trend LinesThis analysis tool takes 4 local samples to product a trend line (green) and a counter-trend line (red). The concept of this is similar to finding wedges where 4 points (usually alternating highs and lows) are used to form the wedge. The purpose of this is to give a general long term direction and pattern.
3-way Trend DeterminationTrend determination in 3 different ways
Pivot lows and highs
Moving Average Crosses
Heikin Ashi


Trend MeterUse as a supplementary Indicator to confirm your entries, but it is as good on it's own.
When you first apply the indicator to your chart make sure you shrink it down It looks a lot better that way
The indicator consists of 3 different Trend Meters and a Trend Bar which are used to confirm trend
As a bonus Possible Momentum Setup entries based on Stochastics are marked as well, these are very Powerful however please use with caution
How to Use
The more Trend meters are lit up the better
Look for Support or Resistance Levels for price to be attracted to
Find confluence with other indicators
Enter Long above the Setup Bar
Enter Short Below the Setup Bar

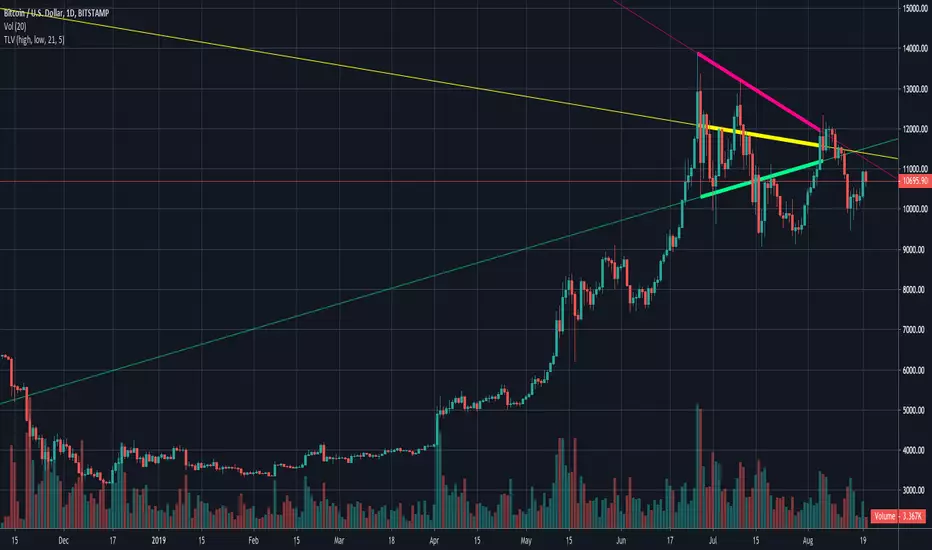
Trend Lines by VolumeA variant of the Trend Lines indicator; this one relies on volume highs and lows to dictate the trend.

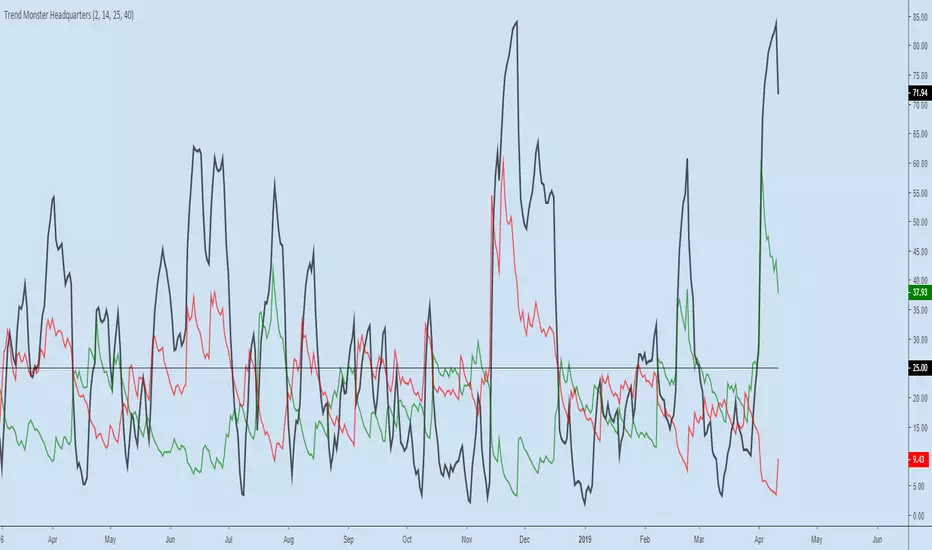
Trend Monster HeadquartersADX-DMI enhanced & modified for faster reaction
ADX (black line) above 80 = mega-trend peaked, reversal imminent, rare case scenario
ADX (black line) above 60 = trend topping out, reversal possible, depending on other indicators
ADX (black line) above 25 threshold = trend strenghening
DMI- (red line) - above 25 - bear trend strenghening
DMI+ (green line) - above 25 - bull trend strenghening
DMI- (red line) - coming off the bottom - bull trend weakening
DMI+ (green line) - coming off the bottom - bear trend weakening