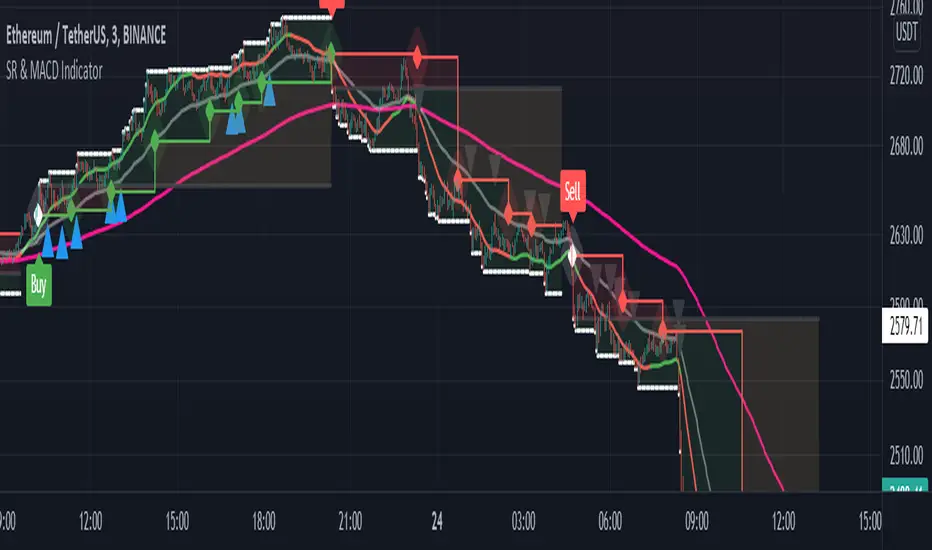
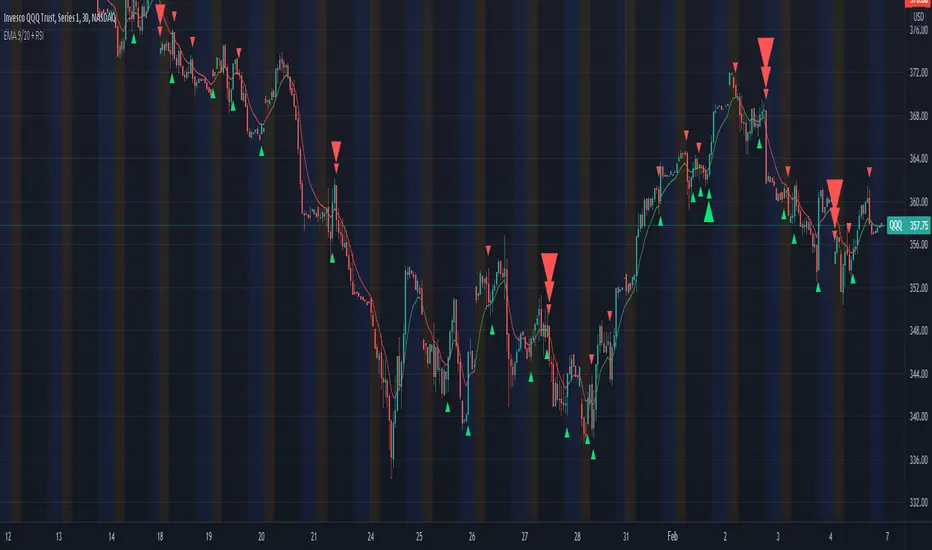
Support and Resistance with MACD IndicatorOriginal script from ©akpaswaniitk. I just added MACD to filter out bad trades and alert function so that we get notified whenever indicator gives us an entry signal. Most of the false breakout has been removed but the remaining ones only pop up during consolidation, so it's wait for the retest before entry. Works better in continuous market. Also look at the color of EMA for further confirmation, only focus on buy side when EMA is green and sell when EMA is red or when after the buy signal EMA changes color from red to green. These are the highly profitable setups I've found with this indicator.
Signals
Red or Green solid line with diamond are trailing stoploses
dotted black line is entry level
dotted white line is optimal exit
Simple Moving Average (SMA)
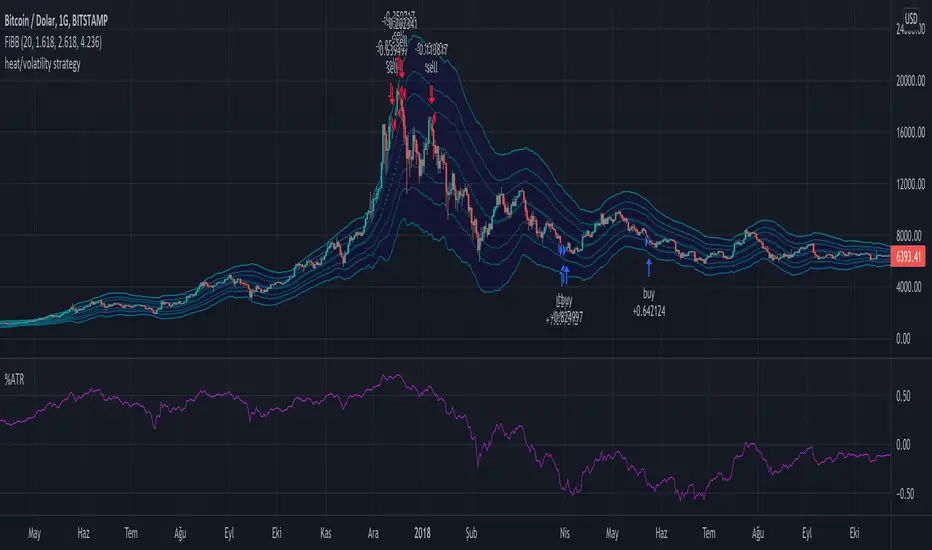
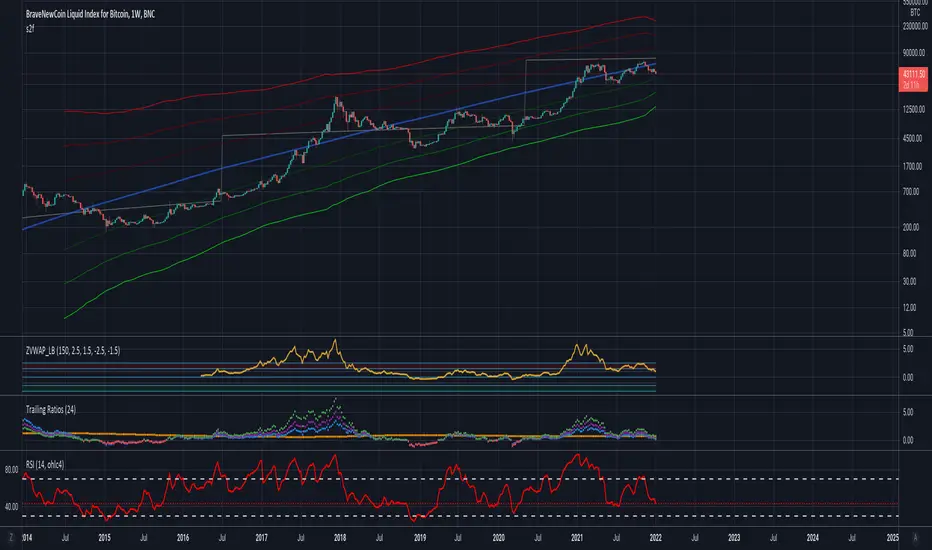
Long Term Heat/Volatility - Accumulation/Distribution v1This is a strategy specifically made for 1D BTC/USD with the aim of capturing cycle tops and bottoms. It's mainly based on two indicators: 21d average of ATR (volatility) and (BTC.price - 180d sma)/BTC.price (heat). The strategy only signals buys or sells after occurrences of high volatility, followed by extremely high or low heat values. It's optimized for utilizing accumulation and distribution at lower and higher prices respectively with respect to last 14 days. 2nd version will include dynamic dollar cost averaging during the accumulation and distribution periods.
Mix1 : Ema Cross + Trend Channel [Gu5] - BacktestBacktest of the indicator "Mix1: Ema Cross + Trend Channel "
Trend indicator, by the crossing of moving averages
SMA200 with a channel as a filter confirms the trend.
The crossing of two moving averages, give alert only in trend.

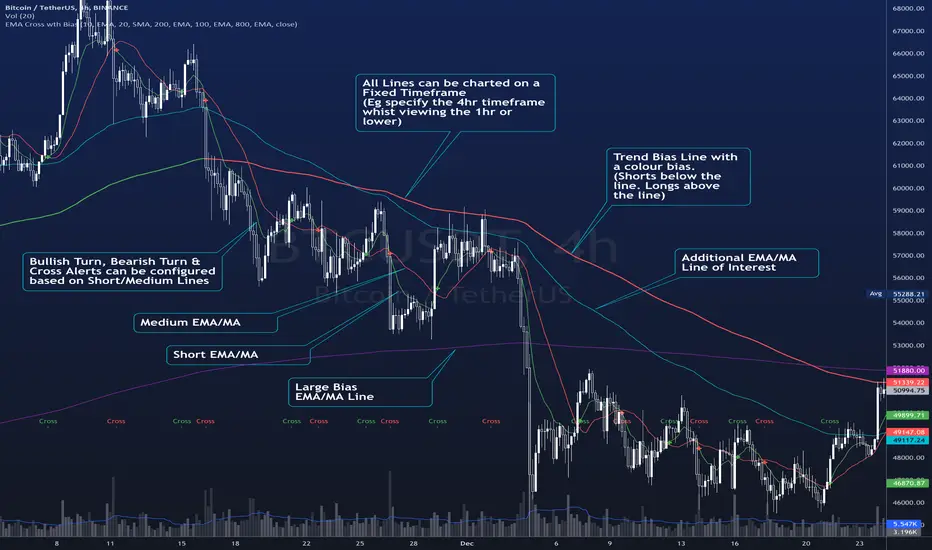
EMA Cross wth BiasThe Script plots 4 Moving averages.
1. Short Moving Average
2. Medium Moving Average
2. Trend Bias (Usually a much slower Moving Average) - Plots in Green when price action is above the line and Red for when price action is below the line.
3. Alerts are triggered when the short MA/ EMA turns. Can be used for Early Entry signals and Exits.
4. Alerts are triggered for Crosses of the Short and Medium MA
Each Moving average line can be confirmed to be a Simple MA or and EMA
Multiple Timeframe continuity with Crossover Alerts█ OVERVIEW
This Indicator calculates the EMA 9/20 and the RSI with its SMA on multiple timeframes and indicates their crossings. In addition this script alerts the user when crossings appear.
█ USAGE
Use the checkboxes to activate different timeframes. With the dropdown menu you can select the timeframe in minutes.
Furthermroie use the checkboxes to activate different crossovers. At the end of the settings you can find the same options for the RSI.
You can also let the script indicate only the overlapping of both indicator crossovers by using the combination option.
█ KNOWLEDGE
EMA: The ema function returns the exponentially weighted moving average. In ema weighting factors decrease exponentially. It calculates by using a formula: EMA = alpha * source + (1 - alpha) * EMA , where alpha = 2 / (length + 1).
SMA: The sma function returns the moving average, that is the sum of last y values of x, divided by y.
RSI: The RSI is classified as a momentum oscillator, measuring the velocity and magnitude of price movements. Momentum is the rate of the rise or fall in price. The RSI computes momentum as the ratio of higher closes to lower closes: stocks which have had more or stronger positive changes have a higher RSI than stocks which have had more or stronger negative changes.
RMA: Moving average used in RSI. It is the exponentially weighted moving average with alpha = 1 / length.
(Source: TradingView PineScript reference & en.wikipedia.org)
█ Credits
Thanks to @KhanPhelan with his EMA 9/20 trading idea
Credits to TradingView for their RSI function
█ Disclaimer
This is my first Script, any feedback is welcome.
Forex Dogs Moving Averages with Distance TableThis is an indicator based on the book【Forex】ForexDog’s Vacuum Zone Trading 2021: Trading Strategy to “not lose” based on Experience and Logic written by Forex Dog (yes, this is his author name on Amazon; he is a trader popular mostly in Japan). It consists of simple moving averages which should somewhat correspond to the higher timeframes moving averages. The original was traded on a 15m chart and the periods are as follows: 5, 20, 40, 50, 80, 100, 200, 400, 640, 1600, 1920, 3200.
Then, there is a big table with a distances overview. This should give you an idea of how far each average is in ticks. The minus in front of the ticks_total signifies direction.
I expect some feedback on this because I don't think the user convenience is very with tables being so bright. My goal is to create a system that limits the number of "noodles" on the chart but still carries the information via the tables on the side.
Moving Average Length is not adjustable by design. The book says to use these quite explicitly, although the logic would work just fine with some other levels, it would not be the original strategy.
Good luck!

Zeal Trade HelperOnce you have mastered a trading strategy, risk management is the most important aspect of trading that will enable and long and successful trading career. The Zeal Trade Helper is based on Van Tharp's theory of R. It provides an immediate visual trading plan, as well as sizing parameters for trading equity and options (.25 and .50 deltas) based on a number of inputs to help you avoid needing to do quick mental math in the moment of taking a trade.
HOW TO USE
- First, you will need to input your R value. To find your R value, divide your **average green day** by the **average number of trades you take in a day**. Once you have this number, enter it into the "Your R Value" field in the indicator settings.
- The indicator settings then provides you with 5 different setup entries. When you have your watchlist ready for the day, simply go through and choose the specific stock, enter your entry price, stop loss, target, and setup type (build, short, bounce, or reject).
OUTPUTS
**Trading Plan**
The indicator will display a visual trading plan based on the inputs you entered on each individual stock's chart. The trading plan will have a green box and red box to represent your entry, target, and stop loss.
**Risk Parameters**
The indicator will also display text outlining what your risk parameters and sizing should be for the trade based on your R value. You will see 3 different lines: the first line showing the number of shares you can trade, the second line showing the number of option contracts you can trade at .50 delta, and the third line showing the number of option contracts you can trade at .25 delta. For reference, at the money options are .50 deltas. Even if you aren't trading exactly .50 or .25 deltas, these values will still help as a frame of reference in the moment of putting on the trade.
**Note that you can toggle the appearance of either of these outputs by checking/un-checking the boxes next to "Display trading plan" and "Display risk parameters" in the indicator settings.
Examples:
1. "**240 shares with $1.25 risk**" means you can take 240 shares and risk $1.25 on the share's price based on your R value
2. "**4.8 Cons @ .50 delta with $0.62 risk**" means you can take either 4 or 5 at the money option contracts and risk $0.62 **on the option contract's value** based on your R value
3. "**9.8 Cons @ .50 delta with $0.31 risk**" means you can take either 9 or 10 option contracts that have a .25 delta (a bit out of the money) and risk $0.31 **on the option contract's value** based on your R value
Happy Trading!

MACD_STO-SAMI This indicator depends on the trend. You must first determine the general trend and then wait for the signals that indicate buying in the bullish direction and the signals that indicate selling in the bearish direction, which is the green signal is considered buying and the red signal is considered selling
Also, this indicator differs from the rest of the indicators that the signal is prior to the movement of hair, meaning that it is predictive and is strong.

MA Bollinger Bands + RSI This script uses the standard deviation of a given moving average along with an RSI direction.
When: rsi crossover neutral line + price crossover lower deviation boundary => long
When: rsi crossunder neutral line + price crossunder upper deviation boundary => short

Moving Average CombinationsThis moving average indicator is used to plot either EMA or SMA as per users choice. User also has the options to choose different type of sources for each of the moving average lines like high, low, close etc. Again, flexibility is added to plot moving averages of different timeframe than the current timeframe of the chart. By doing so in daily chart user can plot averages of different timeframe like hourly, weekly or monthly and vice versa. Length is also as per the choice of the user.
So for a example, in a daily timeframe chart you can plot 9SMA High Daily, 200EMA Close 1Hr, 200EMA Close 2Hr, 200EMA Close Daily, 9SMA High Weekly and so on. This will help in play moving average crossovers and contractions.
Label for each moving average line is also added.

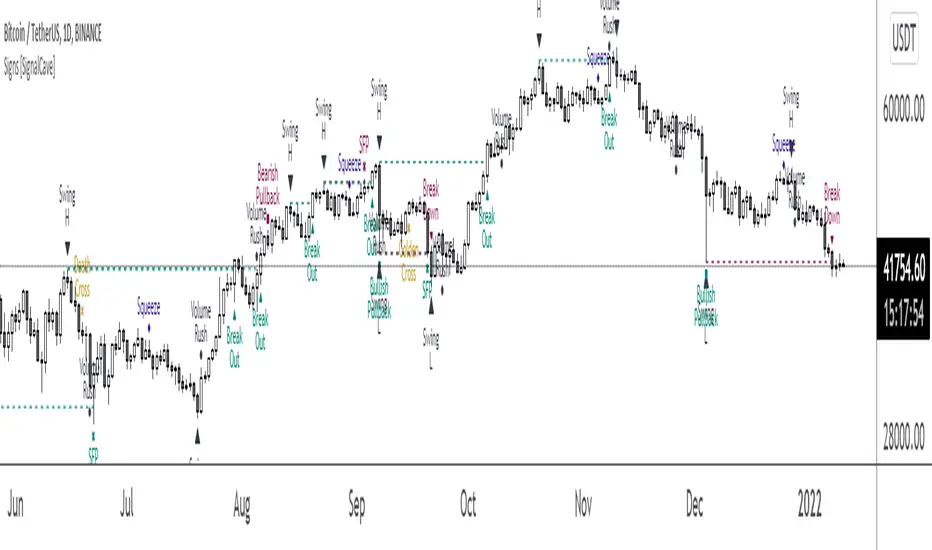
Signs [SignalCave]Swings, Engulfs, Golden & Death Crosses, Price Squeezes, Pullbacks, Breakout & Breakdowns, Volume Rushes
A swing low is when price makes a low and is immediately followed by consecutive higher lows. Likewise, a swing high is when price makes a high and is followed by consecutive lower highs.
Swing Failure Pattern (SFP) is a type of reversal pattern that can be used as buy or sell signals.
Engulfing candles tend to signal a reversal of the current trend in the market. This specific pattern involves two candles with the latter candle 'engulfing' the entire body of the candle before it.
On this indicator, bullish engulfs visible only on downtrend and oversold conditions. Bearish engulfs visible only on uptrend and overbought conditions.
The death cross and golden cross are technical analysis terms for when a moving average (MA) intersects with another from either above or below.
The cross, depending on which it is, can signal the start of a new trend or the end of one.
Squeeze signs signifies low volatility, market preparing itself for an explosive move up or down direction.
Bullish Pullbacks are widely seen as buying opportunities after an asset has experienced a large upward price movement. Most pullbacks involve an asset's price moving to an area of technical support , such as a moving average, before resuming their uptrend.
Bearish Pullbacks are widely seen as selling opportunities after an asset has experienced a large downward price movement. Most pullbacks involve an asset's price moving to an area of technical resistance , such as a moving average, before resuming their downtrend.
A breakout refers to when the price of an asset moves above a resistance area, breakdown refers to when the price of an asset moves below a support area.
Breakouts/breakdowns indicate the potential for the price to start trending in the breakout direction.
For example, a breakout to the upside from a chart pattern could indicate the price will start trending higher.
Volume rush signs appears when the trading volume increases more then a usual period. It can be useful with combining breakout signals as a confirmation.
Alerts are available for various conditions such as "Bullish/Bearish SFP, New Swing High/Low, Breakout/Breakdown, Bullish/Bearish Engulf, Golden & Death Cross, Bullish/Bearish Pullbacks, Squeeze, Volume Rush"
Type asset name on symbol search area.
Adjust your timeframe that you wish to track.
Click "Create Alert" .
Select one of the condition that you wish to get inform from create alert panel.
Select "Once Per Bar Close" option.
Click "Create" .
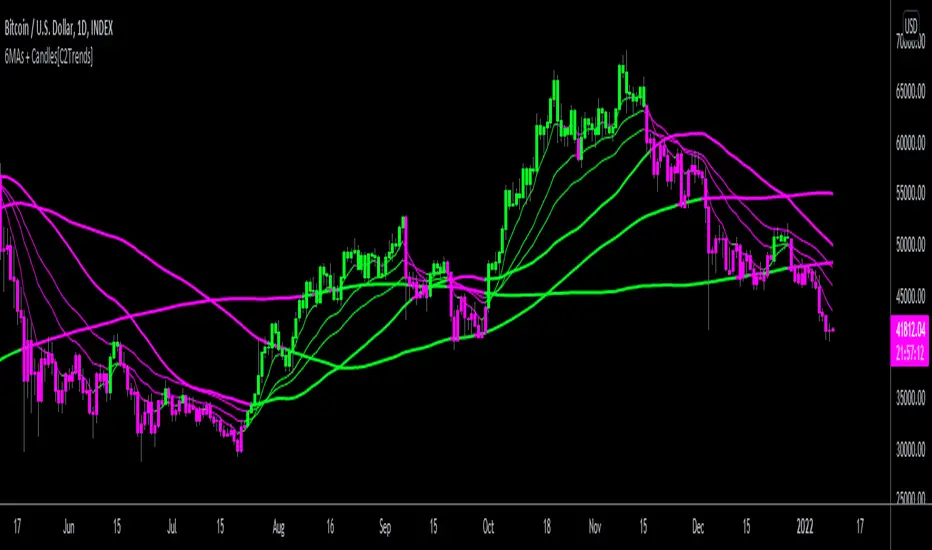
3 EMA/SMA + Colored Candles[C2Trends]// Indicator Features:
// 1) 3 Exponential Moving Averages and 3 Simple Moving Averages.
// 2) Additional EMA input for colored candles(EMA is hidden from chart, input used for coloring of candles only)
// 3) Turn colored candles on/off from main input tab of indicator settings.
// 4) Turn SMA's and EMA's on/off from main input tab of indicator settings.
// 5) Select single color or 2 color EMA and SMA lines from main input tab of indicator settings.
// Indicator Notes:
// 1) 'Candle EMA' input is the trend lookback period for the price candle colors. When price is above desired Candle EMA, price candles will color green. When price is below the Candle EMA, price candles will color fuchsia.
// 2) If you are using another indicator that colors the price candles it may overlap the candle colors applied by this indicator. Trying hiding or removing other indicators to troubleshoot if having candle color issues.
// 3) Using 2-color price moving averages: when price is above an average the average will color green, when price is below an average the average will color fuchsia.
Stage AnalysisThis indicator helps in identification of stage cycle of a stock. Only to be analysed on Weekly and Daily timeframe.
Stages
Stage 1 - Accumulation phase of a stock
Stage 2 - Uptrend phase
Stage 3 - Distribution phase
Stage 4 - Downtrend
As shown in the chart, each stock go through its stage cycle. Below points confirms the uptrend of a stock
This will give idea of when to buy a stock
Wait for first green label up bar to appear which is confirmation for stage 1 completion
Another green label appears which will indicate stage 2 is starting
Finally yellow label up appears which confirms the stage 2 uptrend
Once the yellow bar appears, Wait for a base to be formed then go for buy.
credits: Inspired from @BigBitsIO tutorials and @finallynitin

DTFL FOREX OverlayThese tools are used by FOREX traders who primarily follow the DTFL trading strategy, however, they can easily be utilized by any other FOREX trader looking for an all-in-one indicator that includes sessions, previous high/lows, session values, various moving averages and lockable ADR/ATR lines.

EMA/MA Cross + BB + Alerts Short hand notes - I made this for friend and I. Unsure how to share it with him so made it public.
u/ tmyerskerry for the math on slope and look back period (look back period isn't perfect for slope calculation as 200ma is slow moving so some signals are goign to be strong instead of weak and visa versa. If you know a better way than i'm all ears!
Can set mutliple EMA's and MA's.
Default BB built in. Couldn't figure out how to set default shadow transparency so you will have to turn it down.
Added red and green lines that indicate when price has gone above and below the BB shadow.
Added arrows for when EMA1 crosses EMA2. Right now set for 9 + 32. And depending on MA200 color changes if its with the trend or against.
Alerts in the works. (please don't ask for them as i'm doing this part time and don't know pinescript)

Moving Averages Different Type & SourceThis is a indicator to plot moving averages. User has the option to choose whether to plot SMA (simple moving average) or EMA (exponential moving average). Length of the averages also can be changed by user. The main feature also is use of different source for different length of MAs. Like you can plot 9SMA High with 20EMA Close etc. So, you can plot different types of combinations with type of MA (sma and ema) and Source type (high, low, open, close etc.).
A table also added in the right top to show the values of MA in selected timeframe. The red color indicate current price is below that ma and green color indicate current price is above that ma. Same feature added in plot of ma line by checking toggle color feature option on. It will show green color ma when price is above it and red color ma lines when price is below it.

R950S- MehmetAltun
hello, it allows you to see both rsi and ma and ema values on the same screen. You can set the levels you want in the Aarlar section. You can make the coloring you want.

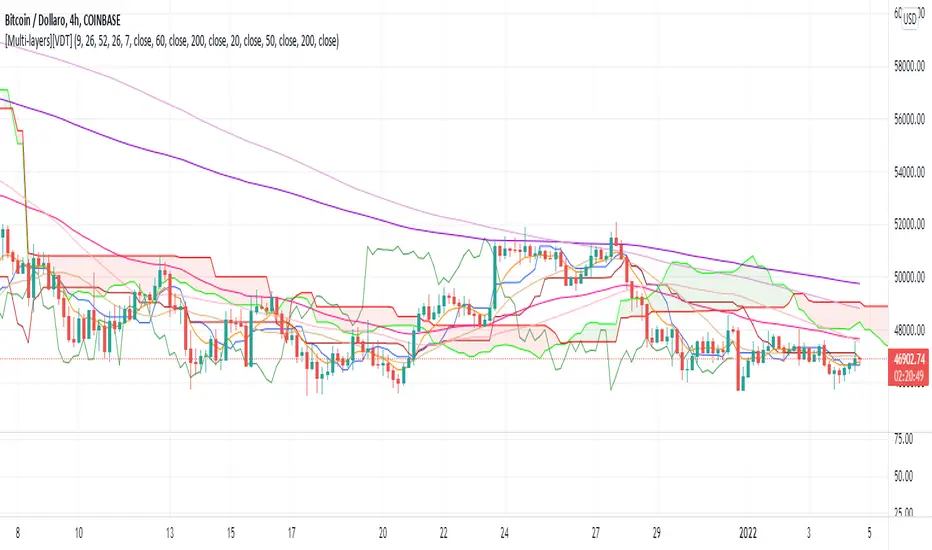
[Multi-layers][VDT]New multi-indicator to merge together three of the most popular indicators used by traders in technical analysis:
1) Ichimoku Cloud, with parameters editable by the trader. Default parameters are: 9-26-52-26
2) 3X Simple Moving Average (SMA), with periods editable by the trader. Default periods are: 20-50-200
3) 3X Exponential Moving Average (EMA), with periods editable by the trader. Default periods are: 7-60-200
Traders can decide whether to print or to hide each indicators separately in the graph, creating three different overlays.
Time Locked Moving AverageSuccinct Description
Generates moving average that stays locked to users desired time preference.
Verbose Description
The default moving average indicator does not stay locked to the chart timeframe. Meaning, if you want to see a 1 day SMA on a 15 minute chart, you have to do math and adjust the moving average length to 96.
Needing to do this constantly (especially while flipping through multiple time frames) was really annoying, so I codded up this script to do it for me... and now it can for you too!
Error Handling
If you receive a 'study error' that says, "function sma references too many candles in history".
Go to the Time Locked Moving Average settings and increase the timeframe interval until error goes away.
Furthermore, UNCHECK gaps, to show real-time approximated moving average values.
Enjoy :)

Intraday MAs for Regular/Extended SessionThis indicator will allow you to show multiple EMA/SMAs for different timeframes on your chart. In addition, it can show you indicators calculated from regular and extended sessions, independently of the session type you have selected for your chart.

Trailing Stoploss Bottom ActivationThe Basics
The indicator is visible on the chart as circles above and below the bar.
It will trigger an alert when the current price goes below, the low of the previous candle.
Or an alert when current price goes above, the high of the previous candle.
The indicator can be used as a trailing stoploss for (DCA/ TV) bots.
The distance between the circles and candlesticks can be adjusted. If the user prefers to set an alert e.g. a few ticks lower than the candle bottom.
What Makes It Different
The user can preset the price (of the asset e.g. BTC), where it will start looking for the condition: current price is below previous candle low (when in long position). Current price is above previous candle high (when short).
Example
In the chart above MATIC/BUSD the user has drawn a blue line at 1.70. Since there is where he expects resistance.
The user has a long position (bought at the green arrow.) The user wants to start trailing at price 1.70.
The alert will only trigger when the following conditions are met:
Condition 1 - Crossed 1.70
Condition 2 - Current candle price is below previous candle low.
In the chart above price crossed above 1.70 on 26th Oct. Current candle price (at that moment) went below previous candle low on 27th Oct, indicated with a red arrow. Here the alert will go off at 1.659 BUSD (indicated in pink).
It ignores the other two lows, indicated with orange arrows. Because condition 1 is not met.
It is possible to use multiple time frames at the same time. Some time frames might not be available depending on your Tradingview subscription.
Final Words
Disclaimer: Please use it with care and at own risk. The owner of this indicator is not liable for any financial losses.
Past performance is no guarantee of future returns.

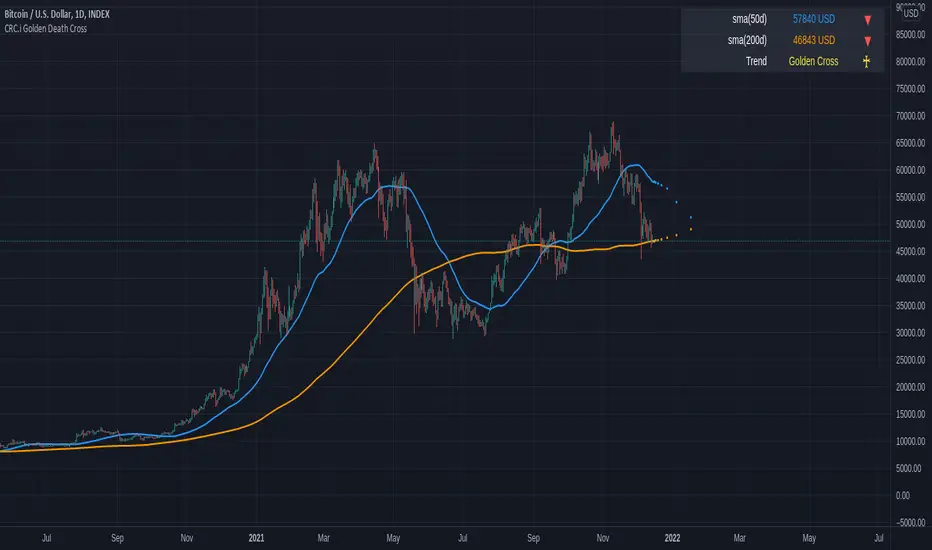
CRC.i Golden Death CrossThis is a simple reproduction of a common indicator used for analyzing the current momentum trend.
Golden Cross => 50 day simple moving average (sma) crosses over the 200 sma
Death Cross => 50 day simple moving average (sma) crosses under the 200 sma
Forecasting used in this indicator is a simple moving average, considering the price sma with length of (sma period - future bar count).
More articles at
mirror.xyz
medium.com