[Fedra Algotrading Strategy Trailing Stop]Algotrading strategy optimized for cryptocurrencies. Originally conceived to trade automatically through bots (that's how I use it), it also works to get signals and trade manually in any exchange.
It works in spot.
Buy the dip:
Attempts to buy on the dip, finding entries when the price makes abrupt dips that break deviation of the linear regression of the last periods.
Trend Detection:
Determines whether the market is in an uptrend or downtrend by crossing 2 SMAs + super trend in different temporalities. This affects the performance of the strategy. It works as a filter to avoid making entries in a downtrend. It also includes other advanced filters to find the best selling price on losses.
Break Even:
If the market enters a downtrend with an open trade, the Break Even sell is triggered, (configurable, default 1.5%). The intention is to close the trade as soon as possible, but without losses. The value of 1.5% is intended to cover commission costs and a possible spread.
Conditional SL Level: Determines a tolerance level in %, from which it is allowed to sell at a loss, while the price is above this level, the scrip will only sell at a profit.
% Trailing Stop Loss. The Stop Loss is placed a % below the price and accompanies it in the rises to make the most of an uptrend.
It allows you to easily configure the backtest period to optimize the parameters for consistent results.
The strategy calculates by default a commission of 0.1% on each trade to make the backtest more "pessimistic".
Includes advanced features for compatibility with different bots platforms in the market.
Risk management by % of equity or by maximum series of losses.
////////////////SPANISH///////////////////
Estrategia de Algotrading optimizada para criptomonedas. Originalmente concebida para operar de manera automática mediante bots (así la utilizo yo), funciona también para obtener señales y operar manualmente en cualquier exchange.
Funciona en spot.
Buy the dip:
Intenta comprar en el dip, encontrando entradas cuando el precio hace bajadas abruptas que rompen la desviación de la regresión lineal de los últimos periodos
Detección de Trend:
Determina si el mercado tiene una tendencia alcista o bajista mediante el cruce de 2 SMAs + super trend en distintas temporalidades. Esto afecta el funcionamiento de la estrategia. Funciona como filtro para evitar realizar entradas en una tendencia bajista. Incluye también otros filtros avanzados para encontrar el mejor precio de venta en pérdidas.
Break Even:
Si el mercado entra en tendencia bajista con una operación abierta, se activa la venta en Break Even, (configurable, por defecto 1.5%). La intención es cerrar la operación lo antes posible, pero sin pérdidas. El valor de 1.5% está pensado para cubrir los costos de comisiones y un posible spread.
Nivel de SL Condicional: Determina un nivel de tolerancia en %, a partir del cual se permite la venta en pérdidas, mientras el precio esté sobre este nivel, el scripto sólo venderá en ganancias
% Trailing Stop Loss. El Stop Loss se ubica un % debajo del precio y lo acompaña en las subidas para aprovechar al máximo un uptrend.
Permite configurar de manera muy fácil el periodo de backtest para optimizar los parámetros para resultados consistentes.
La estrategia calcula por defecto una comisión de 0.1% en cada operación para que el backtest sea más "pesimista".
Incluye funciones avanzadas para compatibilidad con diferentes plataforma de bots del mercado.
Administración de risego por % del capital o por máxima serie de pérdidas
Trailingstop

ST_trailingThe trailing indicator. If ohlc4 becomes "Percent activate trail" above the entry price set by the value and entry date, then the trailing function is activated, which is considered as the maximum ohlc4 for the time in the position minus "Percent activate trail" multiplied by "koeff trail"

ATR Trailing Stop v5 One of my favorite stops is the ATR Trailing Stop-loss. With the implementation of PineScript v5, a code update was needed in order to use this stop/exit-strategy with newer strategy scripts. A timeframe selector that was not featured on earlier versions is also included. This new version can be plugged into PineScript v5 strategies, and also has a simpler/cleaner code that makes the code logic easier to follow than prior versions.
For those that are unfamiliar with the ATR Trailing Stop exit strategy; it is a trailing stop that takes into account the volatility of the underlying asset by trailing the price series using a multiple of the Average True Range (ATR). In practice I’ve found that this exit can be more effective than traditional trailing stops, depending on the volatility of the asset you are trading. More detailed information can be found at www.stockopedia.com
How do I use it? Add it to your chart as an indicator to visualize where the ATR stop would be with your settings. Or, copy and add it to your v5 strategy with the addition of a ta.crossunder(close, ATRTrailingStop) or ta.crossover(close, ATRTrailingStop) function. Special thanks and credit to HPotter who coded an earlier version of this in pine!

SuperTrend+ CleanedSimilar to SuperTrend+ which allows for confirmation bars.
Differences:
Limited to SMA calculation of average true range.
Can filter outlier volatility.
Can apply a standard deviation to the ATR value.

Trailing StopMost of the trailing stops on TradingView are made of using the lowest lows and the highest highs. Not many are based around what I called the volatile trailing stop.
This is where the trailing stop will move around according to a set percentage difference from the previous closing value. This allows you to say "If the current bar moves x percent, then stop". The script I've made here is a simple version of that with a few options for smoothing and setting the percent change.
Disclaimer: This is not financial advice, please do your own research before making any decisions.

Bjorgum AutoTrailOne Time Trade Risk Management
Incorporating the new interactive feature, this script is meant as a one time trailing stop for the active trader to manage positional risk of an ongoing trade. As a crypto trader or Fx trader, many may find themselves in a position late into the evening, or perhaps daily life is calling while a trade progresses in their favor. Adding a trailing stop to a position thats trending can help to keep you in the trade and lock in gains if things turn around when you are unable to react.
To use the trail, the user would add the script to the chart. Once added, a set of crosshairs will appear allowing the user to choose a point to begin. Often choosing to start a trail from a swing high/ low can be an ideal option. This tends to provide some protection for a stop by placing it under support for a long trade or above resistance for a short trade.
Price based trail
The trail will automatically plot and the offset is a factor of the distance from price action selected by the crosshairs. If placed above price action the script will plot a short trail, if placed below it will trail for a long position.
Additionally, there are several other trail types other than price based. There is also percent based, which offsets the trail as a percent from close. A hard stop is placed at the cross hair value, then once the distance is exceeded by the percentage specified, the trail begins.
There are 2 more volatility based trails. There is a PSAR trail which can provide quicker and tighter stops that accelerate with the trend locking in gains faster, and an ATR trail that keeps a distance from price action as a function of volatility. Volatility levels can be adjusted from the menu.
Volatility based trail (ATR)
Volatility based trail (PSAR)
Lastly, within the code for more the more technical savvy, is some starting setups for string alerts to be sent to exchanges via 3rd party or custom API applications. Some string manipulation is required for specific providers to meet their requirements, but there is some building block alerts that will take the ticker symbol, recognize the asset your trading (Fx, Crypto, etc) and take input quantity or exchange names from the settings via inputs.
Complex strings can be built to perform almost any trade related task when to comes to alerts via web hook. A little setup this way with some technology to back your system can mean a semi-automated half man, half machine setup that actually manages your trail stop while you cannot. For those that don’t go this far, there is some basic alert functionality that well trigger when a trail is hit so you can react and make a decision.
Please note that for now, interactive mode is engaged only when the script is added to the chart. Additional stops, or for adjustments to be made it is best to add a new version. Also as real trades could be at play managing an actual position, alerts are designed to go off only once to ensure no duplicate orders are sent meaning alerts are not reoccurring. Once an alert is triggered, a new trail is to be set up.
A modified version of the TradingView built in SAR equation was used in this script. To provide the value of the SAR on the stop candle, it was necessary to alter the equation to extract this value as the regular SAR “flips” at this point. Thank you to TradingView for supplying access to the built in formula so that this SAR could behave the same as the built-in function outside of these alterations
Example of SAR value maintained in trigger candle
Cheers and happy trading.

Kaufman's Efficiency Ratio Strategy [KL]I recently published an indicator called "Kaufman's Efficiency Ratio Indicator". In the description of that script, I hypothesized about how the Efficiency Ratio could be applied to identify bullish moves in instances where price had already gone up steeply, but rests for a while, allowing for entry in expectation that price will continually rise. I decided to test out this idea with Pinescript.
About Kaufman's Efficiency Ratio ("ER")
ER was developed by a systematic trader by the name of Perry J. Kaufman.
Formula
The formula is:
= A divided by B,
where:
A = Current closing price minus the closing price at the start of the lookback period
B = Sum of differences between closing prices (in absolute terms) of consecutive bars over the lookback period
How this strategy enters a trade (Long):
- code: entry_signal_long = ER > 0 and ER_is_mid
- meaning: when ER is positive, strategy assumes price has risen. Usually ER value begins high (red), and unless it is a false move, then it should stay positive. This strategy will patiently wait until ER drops to medium (yellow), and then place a trade.
- how low/medium/high is dynamically determined: Refer to the description of my other script("Kaufman's Efficiency Ratio Indicator") for details. Trying to keep this as short as possible.
How this strategy exits a trade (Long):
- when price hits stop limit; stop limit is based on low of bars, trails upward based on ATR
- included a feature called "tightening TSL", which tries to reduce the stop-buffer during periods of high volatility implied by ER (very experimental, opening the floor for suggestions on how this can be improved)

ATR Bands Trailing StopsA NRTH_ Technical Indicator Study
Comes included with the Premium Package.
Indicator features
Use Trailing ATR as a StopLoss for both Long and Short positions.
Set Fixed Stop Loss or Take Profit levels based on current or previous candle close ATR values
Customizable Period, Multiplier, and Calculation Method.
Usage Tips
Works on all timeframes and markets.
Designed for use in other study strategies that do not have built-in position sizing.
Set Stoploss and RR based on ATR Values or let trades run into a trailing stop.
-------------------------------------------
Disclaimer
Copyright NRTH_ Indicators 2021.
NRTH_ and all affiliated parties are not registered as financial advisors. The products & services NRTH_ offers are for educational purposes only and should not be construed as financial advice. You must be aware of the risks and be willing to bear any level of risk to invest in financial markets. Past performance is not necessarily indicative of future results. NRTH_ and all individuals associated assume no responsibility for your trading results or investments.
All investments involve risk, and the past performance of a security, industry, sector, market, financial product, trading strategy, or individual’s trading does not guarantee future results or returns. Investors are fully responsible for any investment decisions they make. Such decisions should be based solely on an evaluation of their financial circumstances, investment objectives, risk tolerance, and liquidity needs.

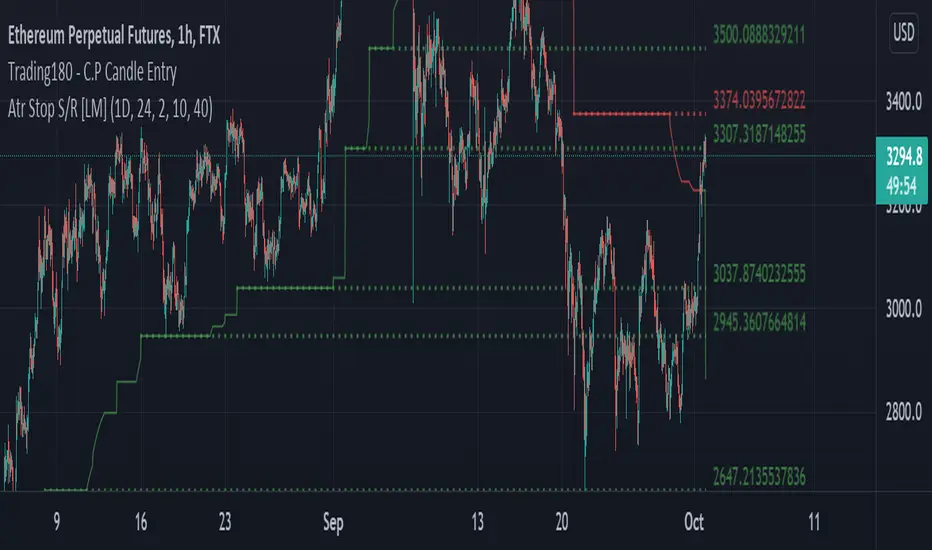
ATR Trailing Stops S/R [LM]Hello Traders,
I would like to introduce you ATR Trailing Stops S/R . The idea is to look for important levels that are identified by trailing stop line, where it usualy spents a lot of time without any move usualy turns out to be good level for bounces.
Script for atr trailing line is originaly taken from: script made by @dgmoon
It has various setting
Timeframe and atr settings
Show lines
Extend lines
Line count - how many lines will be rendered
Candle count - how many candles has to trailing line spend at the same level
Colors - controls color of plot and lines
I hope you will enjoy it, as I enjoyed to write it.
Lukas
3Commas BotBjorgum 3Commas Bot
A strategy in a box to get you started today
With 3rd party API providers growing in popularity, many are turning to automating their strategies on their favorite assets. With so many options and layers of customization possible, TradingView offers a place no better for young or even experienced coders to build a platform from to meet these needs. 3Commas has offered easy access with straight forward TradingView compatibility. Before long many have their brokers hooked up and are ready to send their alerts (or perhaps they have been trying with mixed success for some time now) only they realize there might just be a little bit more to building a strategy that they are comfortable letting out of their sight to trade their money while they eat, sleep, etc. Many may have ideas for entry criteria they are excited to try, but further questions arise... "What about risk mitigation?" "How can I set stop or limit orders?" "Is there not some basic shell of a strategy that has laid some of this out for me to get me going?"
Well now there is just that. This strategy is meant for those that have begun to delve into the world of algorithmic trading providing a template that offers risk defined positions complete with stops, limit orders, and even trailing stops should one so choose to employ any of these criteria. It provides a framework that is easily manipulated (with some basic working knowledge of pine coding) to encompass ones own ideas and entry criteria, while also providing an already functioning strategy.
The default settings have a basic 1:1 risk to reward ratio, which sets a limit and a stop equal distance from the entry. The entry is a simple MA cross (up for long, down for short). There a variety of MA's to choose from and the user can define the lengths of the averages. The ratio can be adjusted from the menu along with a volatility based adder (ATR) that helps to distance a stop from support or resistance. These values are calculated off the swing low/high of the user defined lookback period. Risk is calculated from position entry to stop, and projected upwards to the limit as a function of the desired risk to reward ratio. Of note: the default settings include 0.05% commissions. Competitive commissions of the leading cryptocurrency exchanges are .1% round trip (one buy and one sell) for market orders. There is also some slippage to allow time for alerts to be sent and orders to fill giving the back test results a more accurate representation of real time conditions. Its recommended to research the going rates for your exchange and set them to default for the strategy you use or build.
To get started a user would:
1) Make a copy of the code and paste in their bot keys in the area provided under the "3Comma Keys" section
- eg. Long bot "start deal" copied from 3commas in to define "Long" etc. (code is commented)
2) Place alert on desired asset with desired settings ensuring to select "Order fills and alert() function calls"
3) Paste webhook into the webhook box and select webhook URL alerts (3rd party provided webhook)
3) Delete contents of alert message box and replace with {{strategy.order.alert_message}} and nothing else
- the codes will be sent to the webhook appropriately as the strategy enters and exits positions. Only 1 alert is needed
settings used for the display image:
1hr chart on BTCUSD
-ATR stop
-Risk adjustment 1.2
-ATR multiplier 1.3
-RnR 0.6
-MAs HEMA/SMA
-MA Length 50/100
-Order size percent of equity
-Trail trigger 60% of target
Experiment with your own settings on your crypto of choice or implement your own code!
Implementing your trailing stop (optional)
Among the options for possible settings is a trailing stop. This stop will ratchet higher once triggered as a function of the Average True Range (ATR). There is a variable level to choose where the user would like to begin trailing the stop during the trade. The level can be assigned with a decimal between 0 and 1 (eg. 0.5 = 50% of the distance between entry and the target which must be exceeded before the trail triggers to begin). This can allow for some dips to occur during the trade possibly keeping you in the trade for longer, while potentially reducing risk of drawdown over time. The default for this setting is 0 meaning unless adjusted, the trail will trigger on entry if the trailing stop exit method is selected. An example can be seen below:
Again, optional as well is the choice to implement a limit order. If one were to select a trailing stop they could choose not to set a limit, which could allow a trail to run further until hit. Drawdowns of this strategy would be foregoing locking gains at highs on target on other trades. This is a trade-off the user can decide on and test. An example of this working in favor can be observed below:
Conclusion
Although a simple strategy is implemented here, the benefits of this script allow a user a starting platform to build their strategies from with built in risk mitigation. This allows the user to sidestep some of the potential difficulties' that can arise while learning Pine and taking on the endeavor of automating their trading strategies. It is meant as an aid, a structure, and an educational piece that can be seen as a "pick-up-and-go" strategy with easy 3Commas compatibility. Additionally, this can help users become more comfortable with strategy alert messages and sending strings in the form of alerts from Pine. As well, FAQs are often littered with questions regarding "strategy.exit" calls, how to implement stops. how to properly set a trailing stop based on ATR, and more. The time this can save an individual to get started is likely of the best "take-aways" here.
Happy trading

Prophit Ninja: Hidden ScrollStay ahead of the markets moves with "Prophit Ninja: Hidden Scroll".
Our legendary senseis have mastered the arts of wielding the Katana and Shuriken over many decades of focused practice and distilled their systems and techniques down to their most vital form- storing their knowledge in this ancient scroll for easy adoption by any ninja practiced enough to be able to decipher it.
═════════════════════════════════════════════════════════════════════════
█ INTERPRETATION
Each sub-indicator in this package can be used as a confirmation tool to check your bias and give you a more informed decision as they all take into account every reading shown and not shown being calculated across all Prophit Ninja packages. A sentiment rating below the candle shows bullish bias while a green color emphasizes bullish strength- a sentiment rating above the candle shows bearish bias while a red color emphasizes bearish strength- gold color signifies a strong turn in the market while grey/dark grey is a weak reading. A green trend sensei reading is bullish- while a red trend sensei reading is bearish. A green bull trade sensei label signifies a possible bullish trade set up, while a red bear label trade sensei signifies a possible bearish trade set up. Stat sensei gives you tick by tick multi-time frame readings to always keep you aware of the exact environment you're in. Lastly risk sensei will give you the most optimal least risk trade set-up based on user defined variables and give you tick by tick readings of your trade status. This can be used as a standalone decision-maker, or used in confluence with other indicator packages in our Prophit Ninja bundle to get higher precision.
═════════════════════════════════════════════════════════════════════════
█ OVERVIEW
1 — Sentiment Sensei: A toggle-able tick by tick rating system (0-100%) for each candle based on over 100 individual readings .
2 — Trend Sensei: A toggle-able background coloring that easily shows you the trend bias behind the moves.
3 — Trade Sensei: A toggle-able trade finder that finds confluent trade set-ups to give you the upper hand.
4 — Stat Sensei: A toggle-able multi-time frame candle progress tracker with a built in trend bias and price/volume/momentum change/ratio trackers.
5 — Risk Sensei: A toggle-able risk manager with two variations of auto profit target zones , three variations of trailing stop losses , a win/loss tracker , trade duration timer and all the information you need to stay updated with the status of your trade at a glance whether long or short.
═════════════════════════════════════════════════════════════════════════
█ EASY CUSTOMIZATION
i.imgur.com
With a fully customizable and easy-to-use input menu , this indicator gives you the ability to tailor your trading experience to your needs and see as much (or as little) information as you want to; presented in the manner you deem most viable with the following options in just a few clicks:
Indicator Package- This option allows you to switch between the four display modes available so in any moment you can completely change the metrics you’re reading in just two clicks. This allows you the ability to make decisions based on not only what you’re comfortable with; but also to find confirmation or disagreement with other systems instantly.
Color Theme- There are four color themes available which include original, colorful, monochrome and solid. These not only allow you a quick and easy way to change the colors to suit your style; they also make it so you can challenge your bias in an instant by viewing the data in a completely different way.
Dual Attack Modes- Whether you’re a scalper, day trader, swing trader, or investor; this option allows you to see the chart based on four different risk tolerance/time expectancy mentalities for the Katana and Shuriken separately in just two clicks. Investors can see what the scalpers are thinking and vice/versa to broaden their decision making and/or hone in when optimal.
Dual Sharpness Levels- This algorithm allows the user to display the data on five different smoothness levels for the Katana and Shuriken separately without suffering the inherent lag that accompanies most other indicators. Whether you like to see every tick of a choppy movement, or filter out the false signals into smooth readings, you can do so at any moment.
═════════════════════════════════════════════════════════════════════════
█ RISK SENSEI EXAMPLE
═════════════════════════════════════════════════════════════════════════
█ PRE-BUILT ALERTS
With Prophit Ninja: Hidden Scroll's built-in alerts you can enable alerts for any piece of the Hidden Scrollin just a few clicks. These alerts are way more specific and optimized than you can possibly achieve with the custom alert settings. Each checking for multiple possible activation triggers instead of one and populating the message field automatically so you can just click create.
═════════════════════════════════════════════════════════════════════════
As you can see; this ancient scroll has the ability to adapt to any reader or adversary and give those in control of its power the upper hand. Any mode of battle, any opponent, any circumstance- 'Prophit Ninja: Hidden Scroll' was polished by our finest artists to inform any reader and make sure they know when to attack, defend or simply allow the fight to play out by its easy-to-read coloring system. As long as you learn the techniques you'll have a much better chance of making the right decision than when you didn't.
This state-of-the-art tool is great for experienced traders, those who just started learning to trade, or anyone in between- truly made to suit the needs of any trader, in any moment, with any mindset (along with the other indicators in our Prophit Ninja bundle) you'll notice an immediate improvement in your market dexterity after learning it.
═════════════════════════════════════════════════════════════════════════
*everything displayed is part of the Prophit Ninja indicator bundle; this is an otherwise blank chart*

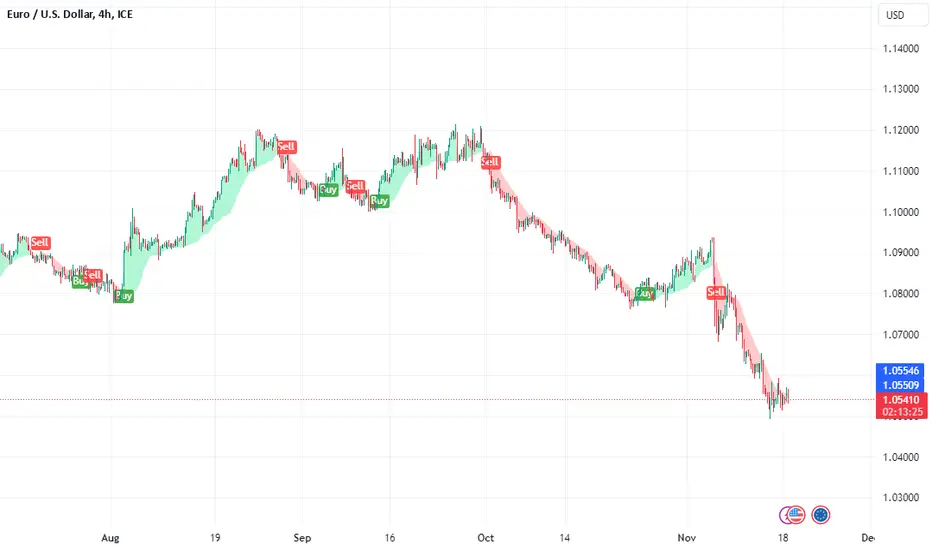
IZCI [xaurr]Yet another trailing stop loss script, using optional percentage or atr values to follow the last price.
Green area: bullish , long
Red area: bearish, short
IZCI means trailing in Turkish.
If you find it usefull, please like it.
Good Luck :)
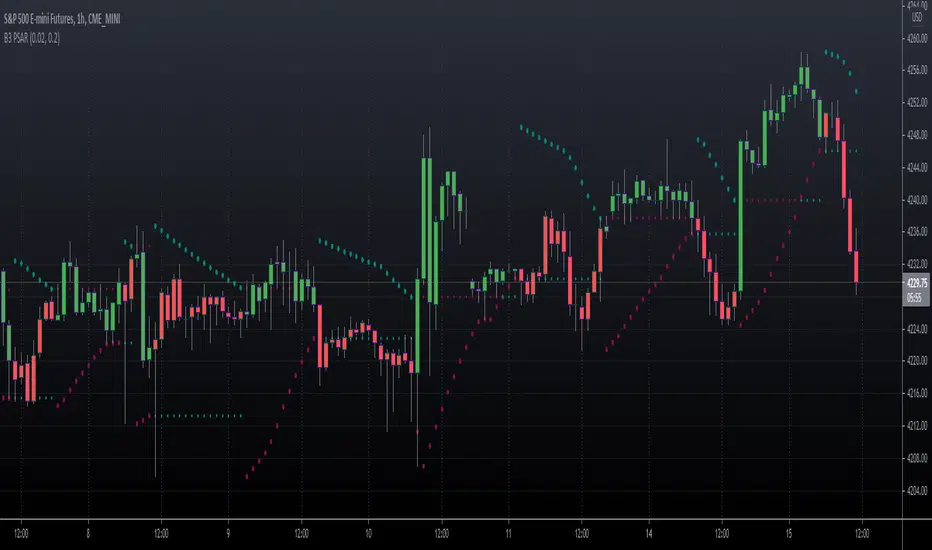
B3 PSAR v4This is an update to Pinescript version 4 for one of my oldest indicators, Parabolic Stop and Reverse.
The indicator math and algorithm has not been modified, but the stylization and usage has improved.
Added:
Bar-coloring = User sets the up and down colors in user interface style menu.
Inputs = The two inputs' up-down arrows now increment by thousandths & hundredths respectively. This is a vast improvement! Just leave the UI up when fishing for a value and watch the chart change.
Alerts!!! = Set your alerts to "B3 PSAR" then "Any alert() function call" in your Alerts User Interface; and you can also quickly turn alerts on/off in the PSAR indicator's UI.
Important Note:
TradingView has a version of PSAR, and you may find other scripters make the indicator as well.
People make claims on what math or algorithm is correct and what were Wilder's intentions for the indicator.
I am not interested in the theory, MY VERSION OF PSAR MATCHES OTHER PLATFORMS' CHART RESULTS for their native PSAR (Tradestation, TOS, etc). ;-)
Text copied from the obsolete posts:
Version 1 notes:
I have seen Parabolic SAR done several ways in the past and on several platforms. I have a few trailing systems I use to have a time-affected stop, meaning that as time goes, the way the stop works changes. In this method, you have a stop starting off of the high or low at the time of the cross of the previous stop, giving you a binary flipping agent. I like the usage of this system upon trendy action, however, in sideways action, the indicator flips back and forth with no pertinence. The flat lines represent the last price that was crossed, and as the PSAR crosses the line you essentially lock in profits in the trend.
Version 2 notes:
The minimum value inputs for acceleration and limiter inputs have been set to zero, by P.M. request.
Open Range Breakout with TSLThis ORB with TSL Indicator Session Time is Indian NSE and BSE Equity Market
This indicator Provide you 2 type Setup
Opening Range Plot Only for Observation
1st Range Breakout = Long
2nd Range Breakout = Short
How to work This Indicator?
When Market is Open This Indicator automatically Plot Opening Range High and Low,
if Market bullish & Candle Close above Opening Range high When This Indicator automatically Plot 1st Range High and Low if You Want to 1st Range High Plot Crossingup any Candle You can Also Add Alerts
if Market Bearish & Candle Close Below Opening Range Low When This Indicator automatically Plot 2nd Range High and Low if You Want to 2nd Range Low Plot CrossingDown any Candle You can Also Add Alerts
If you Have any Suggestion please mention here
Thank you so much
This Also Automatically start trailing SL on basis of ATR

Gann HiLo Activator [CC]The HiLo Activator was created by W.D. Gann and I was surprised to not see more of his technical indicators on here. I will start adding more of his indicators on here if I get more interest. This is the original version of the indicator that performs like a trailing stop that also works well as a trend line. Buy when the line turns green and sell when it turns red.
Let me know if there are any other indicators you want me to publish!

Study Backtester [MS]Backtest your study like a strategy with our Study Backtester. Visualize your script's performance directly on the chart.
Simple to use, copy-paste a few lines of code (shown below) into your script, then set your script as input to the Study Backtester.
Visualize how your script performs against buy-and-hold over time, and get a nice print out of stats.
Settings
Set your buy and sell signal inputs
Add a stop loss
Choose normal or trailing stop loss
Choose the start date and time for backtesting
Set trading commissions
Use leverage or not
Set carry cost for leveraged trades
Version 1
Only supports buy-sell-buy-sell alternating signals. Any non-alternating signals will be ignored.
Testing begins with 1 share of the asset at your first buy signal.
Things To Note
This cannot enter or exit mid-candle. With the exception of the stop loss feature, which will calculate exits at the exact stop price.
Stops are not treated as stop-orders, but as market-exists at the stop (or trailing stop) price.
This DOES NOT take into account any loss of funds due to liquidation if price goes against you in a margin position.
Short positions are not currently supported.
Only `study` scripts are supported
How To Use
1) Add the following to the bottom your study's code.
//------------------------------------------------------------------------------
// FOR BACKTESTER
plot(buy ? 1 : sell ? -1 : na, title="Signals", display=display.none, editable=false)
2) Make sure `buy` and `sell` variables are assigned appropriately according to your strategy.
3) Add both your study and this script to your chart.
4) Set the "Signals Plot" setting of this script to: : Signals
5) Adjust this script's settings (start date, commission, stoploss, etc) as necessary.
PM us with any questions about this script.

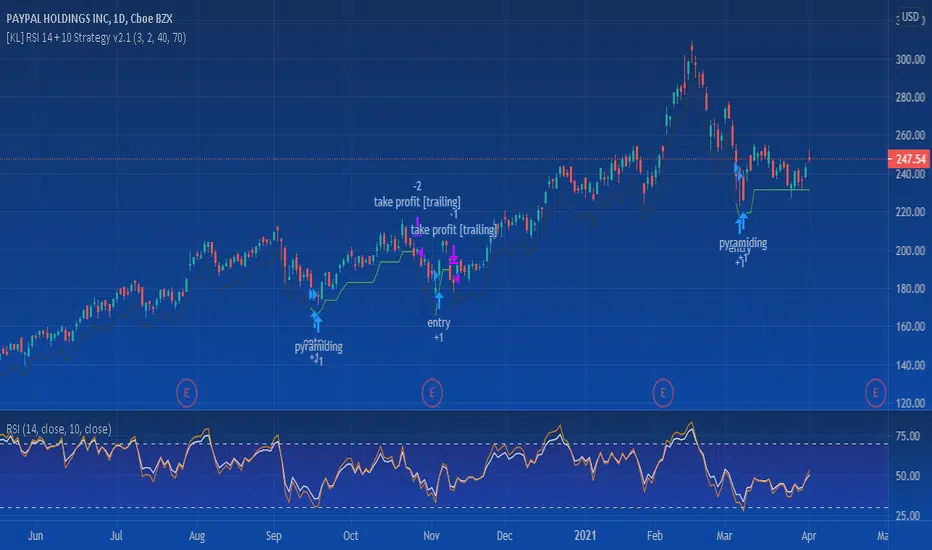
[KL] Bollinger bands + RSI StrategyThis strategy is based on two of my previous scripts, one called “RSI14 + 10”; the other one called “Bollinger Bands Consolidation”. At its core, it combines the main setups from each of those two scripts but excludes the auxiliary features that were considered as experimental. This strategy will identify periods of squeeze, and then enter long during consolidation with a trailing stop loss set.
Primary indicator will be the Bollinger Bands. By comparing the width of the BBs with the ATR of the same lookback period (i.e. 2 standard deviations of the 20 recent closing prices vs ATR(20) x2), we begin to look for confirmation for entry whenever the standard deviation of prices is less than the ATR. This can be seen visually in the plots (i.e. default gray lines representing ATRx2 relative to BB center line).
Confirmation for entry will be the RSIs (slow-14, and fast-10). If both are upward sloping, then we assume prices are in an uptrend and may eventually break above upper band. RSIs are typically in mid-range when prices are consolidating, therefore no need to measure it.
Exits will happen in two cases, (1) when trailing stop loss hits, or (2) when RSIs signal that the instrument is overbought. No. 1 is self-explanatory. No. 2 happens, when RSI14 reaches above 70 (can be changed), followed by RSI10 catching up and surpassing RSI14.

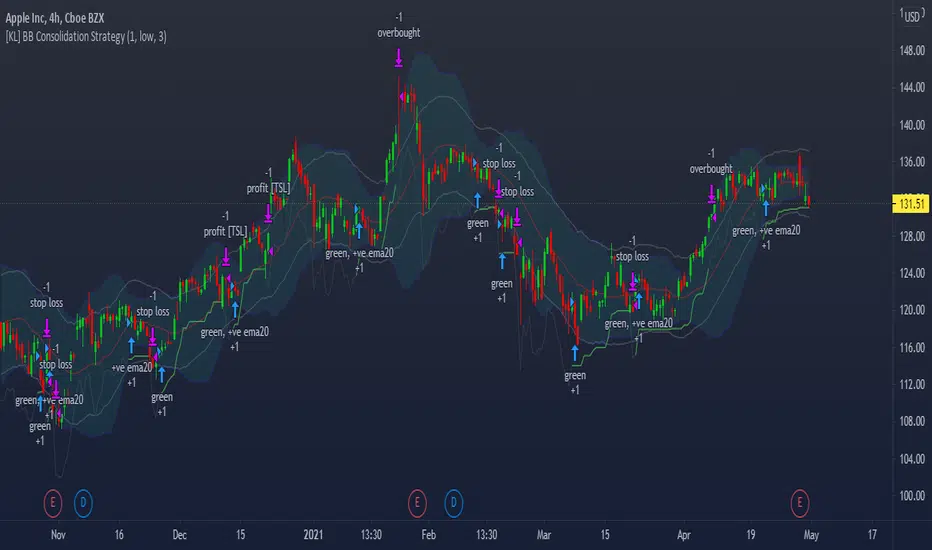
[KL] Bollinger Bands Consolidation StrategyThis strategy will enter into long position based on the volatility of prices implied by indicators of (a) Bollinger bands, and (b) ATR.
Application of Bollinger bands ("BOLL")
Using plain vanilla settings for BOLL (i.e. 20 period moving average, and 2 standard deviations of closing prices), we are interested to know about the shape of the area that is bounded by the upper and lower bands.
In theory, consolidation happens when volatility of price decreases. Visually speaking, this is represented by the narrowing of the upper/lower bands. This strategy considers the narrowing of BOLL bands as the primary indicator for long-entry.
Application of ATRs (as confirmations)
Firstly, to confirm that BOLL bands are narrowing (as mentioned above), the ATR at a potential point of entry is compared against the standard deviation of prices over BOLL's lookback periods. Once again, visualizing the shape of BOLL bands during consolidation, we assume the lines begin to squeeze when the distance between the center line and upper/lower band is less than two current ATRs.
Secondly, this strategy looks into the moving average of ATRs to assure that prices are not too choppy when entering into market. If the moving average of ATR decreases at a point in time such that all the above conditions are met, then we can assert that the volatility of price is decreasing.
Thirdly, ATR is used for determining the size of our trailing stop loss. We will keep the multiplier fixed at two.
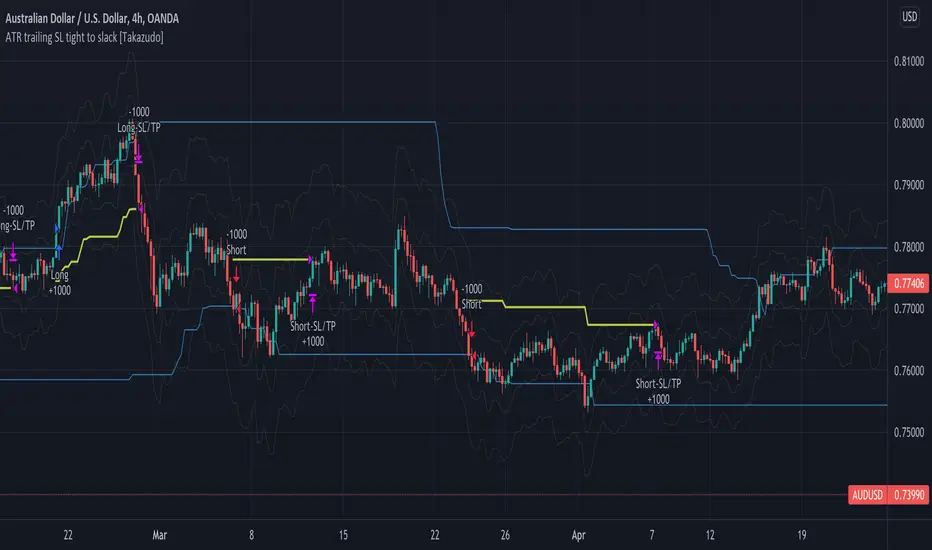
ATR trailing Stop Loss tight to slack [Takazudo]This is a demo of ATR based trailing Stop Loss.
This SL strategy uses 2 types of ATR based SL.
tight SL as initial (ATR * 1.5)
slack SL as trailing (ATR * 4)
When any entry singal occurs by the buy/sell conditions, this SL strategy uses the "tight SL" as the initial SL.
Then the SL will chase the price as trailing SL. However, this strategy uses the "slack SL" in this trailing phase.
So you can set the tight SL first.
Then SL will chase the price as the slack one.
Note: The entry strategy in this script is not intented to win. Check the result. Be careful. Just a module of my strategy.
(IK) Stoch-60-15This strategy uses 60 minute and 15 minute stochastic data to determine entry and exit; it only executes long trades. I've only used this on BTC/USD, but I imagine the concepts employed should hold for any ticker
The script builds a simple Stochastic indicator for the current timeframe, and it also plots a single stochastic line for a higher resolution time frame. I've found good results trading on 15 minutes with a 60 minute higher resolution.
We enter a trade if the higher resolution stochastic is in an uptrend, if the current resolution stochastic is in an uptrend, and if the current stochastic value is less than 50.
We exit a trade when the current stochastic value crosses below 80 or the trailing stop loss is hit.
Stop loss is calculated with the input value, Stop Loss Percent. This value represents the percent of capital you're willing to lose before exiting a trade. A stop loss percent of 0.050 means your trade will exit if it falls 5% from the highest high since entering a trade. You will have at least 95% of your original capital left. There is no option to change a trailing stop loss to a set stop loss (in order to keep the code as simple as possible), however, you can turn it off by setting Stop Loss Percent to 1.
I tried to keep the script itself lightweight and very easy to understand, so it's not very customizable in regards to input options. You can change stochastic data, as well as the trailing stop percentage. The script can be adjusted to other timeframes, however this requires a small change in the code (details in script comments). Changing just the "Higher Resolution" input will not produce expected results
My hope is that by keeping it lightweight and simple, it will be easier for you to adjust to your specific needs, or work into a larger strategy.

[KL] RSI 14 + 10 StrategyThis strategy uses RSI14 for entry and exit signals; applies RSI10 for confirmation. The thresholds can adjusted in Settings.
Trailing stop can also be applied if wanted.
Tested on daily/hourly charts.
[KL] BOLL + MACD Strategy v2 (published)This strategy will look for opportunities when price touches the lower Bollinger band, then enters Long when it anticipates a MACD crossover signal.
Setup: on 1-day chart interval
Exits when either (a) hitting trailing stop loss, or (b) meeting risk-to-reward, if defined by user.

Cyatophilum Strategy BuilderAn indicator to create strategies, backtest and setup alerts.
The user can choose one or multiple TA entry conditions, if more than one the conditions are combined with a logical AND.
The entries will open up a trade, which is then handled by a risk management system including Trailing Stop, Take Profit and up to 100 Safety Orders.
This indicator can be used to backtest 3commas DCA bots who are using TA presets, RSI or ULT.
Its main goal is to create strategies by combining indicators.
Let's dive into the details of what's included:
Entry Condition: MACD
Triggers an entry when macd crosses with the signal line.
Configure the fast, slow length, signal smoothing and timeframe to trigger the condition.
Entry Condition: RSI
Triggers an entry when the RSI is higher or lower than the long/short threshold.
Configure the length, timeframe, long and short threshold to trigger the condition.
Entry Condition: ULT (Ultimate Oscillator)
Triggers an entry when the ULT is higher or lower than the long/short threshold.
Configure the 3 lengths, timeframe, long and short threshold to trigger the condition.
Entry Condition: Bollinger Bands
Triggers an entry when the price is above the upper band for long and below the lower band for short.
Configure the length, standard deviation and timeframe to trigger the condition.
Entry Condition: MFI (Money Flow Index)
Similar to RSI, it triggers an entry when the MFI is higher or lower than the long/short threshold.
Configure the length, timeframe, long and short threshold to trigger the condition.
Entry Condition: CCI (Commodity Channel Index)
Another oscillator that triggers an entry when its value is higher or lower than the long/short threshold.
Configure the length, timeframe, long and short threshold to trigger the condition.
Trend Filters
Use one or two trendlines to filter your trades: go only long/short when the trendline is bullish/bearish.
Choose between the several trendlines: ema, sma, wma, hull ma, kama, alma, rma, swma, vwma, Tilson T3, and the unique Adaptive T3 and Adaptive Hull MA.
If this is not enough, you can use the external trendline feature to plug in any other indicator for your trendline.
The second trendline can be MTF and come from another symbol if needed.
Combining Indicators
Most of the time we will not be using a single indicator at a time, but instead, combine them in order to get stronger entries.
The entry conditions are combined using a AND logical gate, meaning all conditions must be true for the entry to trigger.
Here is an example using a combination of 2 indicators: Bollinger Bands and RSI.
We can see less entries are being triggered on the bottom chart than on the top chart because the bottom chart is combining the 2 indicators while the top chart is only using Bollinger Bands.
You can combine up to all 6 indicators if you want, but keep in mind that combining too many may lead to triggering no entry at all.
Risk Management and Trade system
The indicator will not trigger more than one long or short entry in a row.
To start a new trade, the indicator will wait for either take profit, stop loss or an opposite entry if no SL and TP is set.
Stop Loss and Take Profit
Configure your stop loss and take profit for long and short trades.
You can also make a trailing stoploss and a trailing take profit.
Safety Orders
Just like 3commas bots, you can create a strategy with up to 100 safety orders.
Configure their placement and order size using the price deviation, step scale, take profit type (from base order or total volume), and volume scale settings.
Note: only the 20 first safety order steps or so will be plotted due to graphic limiations. The steps after that still trigger alerts and backtest results.
Creating Alerts
The indicator is using the newest alert system:
1. Write your alert messages in the indicator settings (alert section at the bottom)
2. Click "Create Alert" as usual, but choose "alert() function calls only"
Data Window
Since the indicator is applied on top of the price chart, the oscillator indicators cannot be plotted. You can always add them on another pane but if you want to just see their values, you can use the Data Window to see the value of each oscillator on each bar.
Backtest settings
Used to get the results below:
Initial Capital: 100 000$
Base Order Size: 0.1 contract (BTC)
Safety Order Size: 0.1 contract (BTC)
Commission: 0.1%
Slippage: 100 ticks
pyramiding: 6
The indicator settings are plotted in the main chart panel.
