Strategy Myth-Busting #12 - OSGFC+SuperTrend - [MYN]This is part of a new series we are calling "Strategy Myth-Busting" where we take open public manual trading strategies and automate them. The goal is to not only validate the authenticity of the claims but to provide an automated version for traders who wish to trade autonomously.
Our 12th one is an automated version of the "The Most Powerful Tradingview Buy Sell Signal Indicator " strategy from "Power of Trading" who doesn't make any official claims but watching how he trades with this, it on the surface looked promising. The strategy author uses this on the 15 min strategy on mostly FOREX. Unfortunately as indicated by the backtest results below, we were not able to substantiate any good positive trading metrics from this, be it Profit, Markdown, Num Of Trades etc. This does seem to do okay with some entries but perhaps adding another indicator to this to filter out more noise might make it better. At least how this strategy is presented now, this is not something I recommend anyone use.
This strategy uses a combination of 2 open-source public indicators:
SuperTrend by TradingView Internal
One-Sided Gaussian Filter w/ Channels By Loxx
The SuperTrend indicator and the One-Sided Gaussian Filter complement each other by providing a more complete and accurate picture of market trends. The SuperTrend indicator is used to identify trends. It does this by calculating a moving average of the underlying securities price and then comparing the current price to the moving average. When the current price is above the moving average, the trend is considered bullish, and when it is below, the trend is considered bearish.
The One-Sided Gaussian Filter is a mathematical tool that is used to smooth out fluctuations in financial data. It does this by removing random noise from the data, making it easier to identify patterns and trends.
When the SuperTrend indicator is used in conjunction with the One-Sided Gaussian Filter, the smoothed price data generated by the filter is used as the input for the SuperTrend calculation. This provides a more accurate representation of market trends and helps to eliminate false signals generated by short-term price movements. As a result, the SuperTrend indicator is able to more accurately identify the underlying trend in the market and provide traders with a cleaner and more reliable signal to act upon.
In summary, the SuperTrend indicator and the One-Sided Gaussian Filter complement each other by providing a more accurate and reliable representation of market trends, resulting in improved performance for traders.
If you know of or have a strategy you want to see myth-busted or just have an idea for one, please feel free to message me.
Trading Rules
15 min candles
FOREX or Crypto
Stop loss at swing high/low | 1.5 risk/ratio
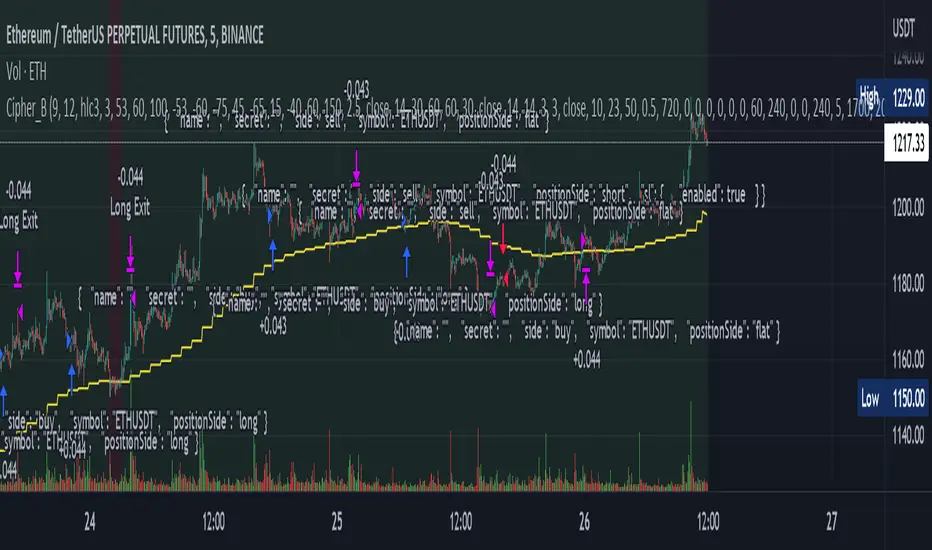
Long Condition
SuperTrend and OSGFC generate buy signal
Close Buy on Gaussian generating a sell signal
Short Condition
SuperTrend and OSGFC generate sell signal
Close Buy on Gaussian generating a buy signal
Pine Script® strategy