$AXL/USDT — Massive 90% Breakout, But Is It Time To Buy?$AXL/USDT — Massive 90% Breakout, But Is It Time To Buy?
NYSE:AXL has exploded +90% in just 2 days, breaking out of a long-term downtrend with huge volume.
The chart looks fire — but traders, beware:
High volatility = high risk at these levels.
Here’s the technical read:
✅ Downtrend broken
✅ $0
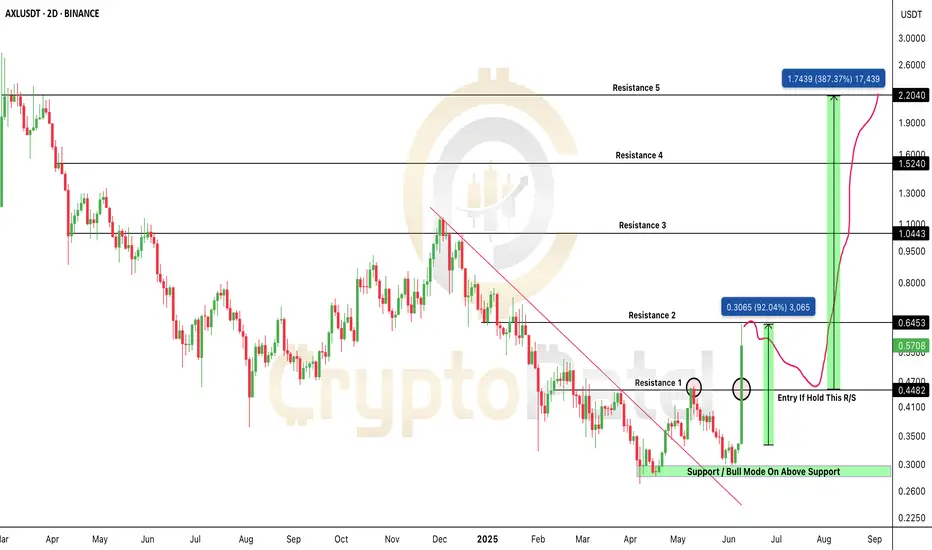
AXLUSDT.P
A trendline breakout is a powerful signal in technical analysis1
. It occurs when the price of an asset moves beyond a trendline that has been acting as a support or resistance level2
. This can indicate a potential continuation of the trend or a reversal, depending on the context.
Here are some k

See all ideas
Summarizing what the indicators are suggesting.
Oscillators
Neutral
SellBuy
Strong sellStrong buy
Strong sellSellNeutralBuyStrong buy
Oscillators
Neutral
SellBuy
Strong sellStrong buy
Strong sellSellNeutralBuyStrong buy
Summary
Neutral
SellBuy
Strong sellStrong buy
Strong sellSellNeutralBuyStrong buy
Summary
Neutral
SellBuy
Strong sellStrong buy
Strong sellSellNeutralBuyStrong buy
Summary
Neutral
SellBuy
Strong sellStrong buy
Strong sellSellNeutralBuyStrong buy
Moving Averages
Neutral
SellBuy
Strong sellStrong buy
Strong sellSellNeutralBuyStrong buy
Moving Averages
Neutral
SellBuy
Strong sellStrong buy
Strong sellSellNeutralBuyStrong buy
Displays a symbol's price movements over previous years to identify recurring trends.