$AXL/USDT — Massive 90% Breakout, But Is It Time To Buy?$AXL/USDT — Massive 90% Breakout, But Is It Time To Buy?
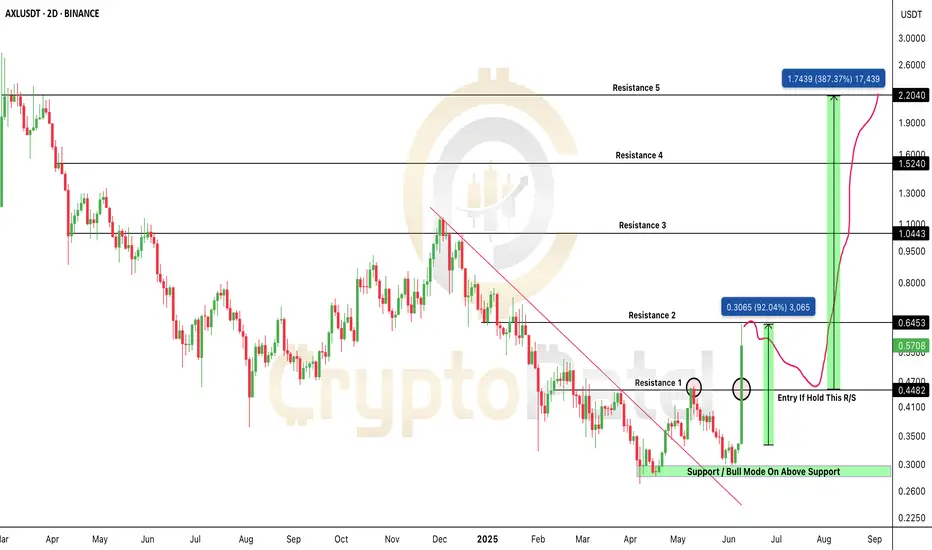
NYSE:AXL has exploded +90% in just 2 days, breaking out of a long-term downtrend with huge volume.
The chart looks fire — but traders, beware:
High volatility = high risk at these levels.
Here’s the technical read:
✅ Downtrend broken
✅ $0.4482 resistance flipped → acting as strong support
✅ Structure is bullish — but a healthy correction is expected
My current view:
→ I do NOT suggest entering at this level.
→ If already holding → now is a good time to book partial profits.
👉 I expect a ~30% pullback from here.
👉 A 2-day close above $0.4482 will confirm strength and create a good accumulation zone.
👉 If not → deeper pullback toward $0.44–$0.34 zone likely.
Best Accumulation Zone:
$0.44–$0.34 — patience required — don’t chase tops.
Targets after correction: $1 → $2 → $3 → $5
Stop Loss: below $0.31
Bottom line:
The trend shift is real — but after a parabolic +90% move, entering now is chasing risk.
NFA & DYOR
AXLUSDT.P trade ideas
AXLUSDT.P
A trendline breakout is a powerful signal in technical analysis1
. It occurs when the price of an asset moves beyond a trendline that has been acting as a support or resistance level2
. This can indicate a potential continuation of the trend or a reversal, depending on the context.
Here are some key points to consider when analyzing a trendline breakout:
Volume: Look for an increase in trading volume during the breakout. Higher volume can confirm the breakout's validity3
.
Candlestick Patterns: Pay attention to candlestick patterns around the breakout. Bullish patterns (like a hammer or engulfing pattern) can strengthen the breakout signal.
Support/Resistance Levels: Ensure that the trendline has been a significant support or resistance level. A breakout from a well-established trendline is more reliable.
