S&p BSE MIDCAP INDEX- time ripe for consolidation aka correction. An observation of Monthly charts of S&P BSE Midcap index reveals that its ripe for a consolidation cum correction for a periods of 15-18 months from Today i.e May 2022. So reasonable to say time for super cycle growth can start from 2024-2026 for tgt of 38000-50000. 61.8% retracement for the entire...
Amazing rally - where will it stop? 28000 may prove to be a tough number of conquer
watch specific stocks to form bottom this week. next big move coming soon
A possible target in Bse Mid cap Index Wll be 30k in few years Some correction Possible Before Hitting 30K
Probably midcap rally to gain pace at the break out of channel
Same patterns in BSE Midcap Index. Let's see what is in store ?
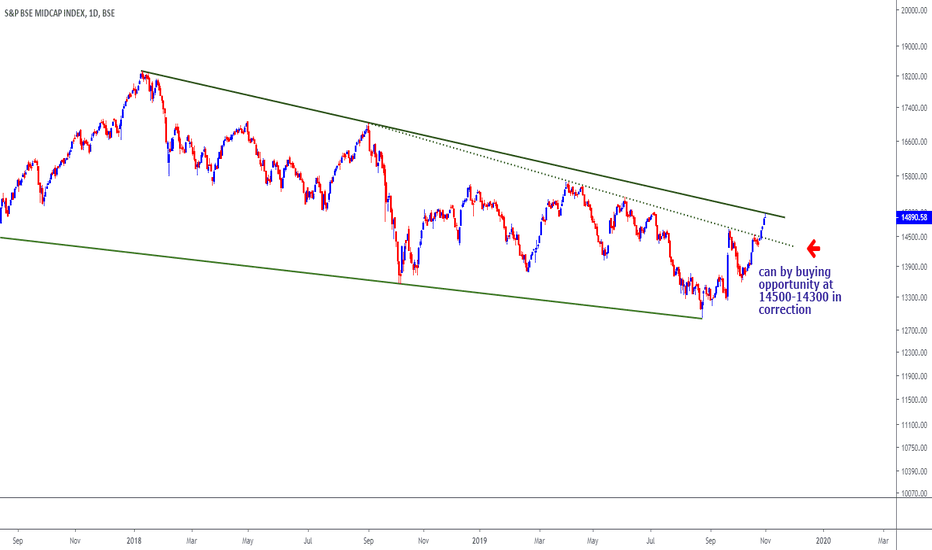
#BSEMIDCAP (weekly) resistance around 15000 and then 15600 crossover of which expect move toward Life time high downside support 13500 so buy good quality midcaps in correction of 10500-14300 and keep sl of 13500
On monthly charts the MIDCAP index has broken major trendline support and all indicators pint to big crash in coming months..Investors beware !!
The Evening Star Pattern is viewed as a bearish reversal pattern, that usually occurs at the top of an uptrend. See the image.
disclaimer... not an investing/trading recommednation
disclaimer... not an investing/trading recommendation
other charts.... forum.valuepickr.com disclaimer... not an investing/trading recommendation
Time to bottom fish some good valuation stocks in the mid and small cap space... Disclaimer.. not an investing/trading recommendation
DIsclaimer... not position on the index.. a reference chart for my investments in mid and small caps.. suspicion of reaccumulation , should be confirmed by the post spring change of character towards sos/markup.. else as mentioned the 52week ema change of character towards a resistance will potentially make this as a distribution schematics... proceedings will...
DISCLAIMER...this is not an investing/trading recommendation
The BSE:MIDCAP went through the following events.. 1.A rounding top formation 2.Breakout of the neck line 3.Entered into a symmetrical triangle Projections... 1.Symmetrical triangle breakout 2. Bearish bat completion 3. Ichimoku green cloud in potential reversal zone 4.Price rejection by ichimoku cloud 5.Price reversal from prz(potential reversal zone)...
midcap index is trading at high pe level as well as broke the trend .breakdown looks similar to breakdown of October 2016. stay cautious any long is not advisable . correction expected till 13256; 50% entrancement of move from December 2016 lows buying is not advisable
A trader has messaged me privately, has confessed that for past 6 years he had been trying hard to make TA & Elliott Wave work for him and its not turning around and shall he continue the effort or drop it? Shall he entirely drop stock market altogether? Answer: Whatever I will say here I will say on the basis of my own direct experience, will say only the...