BROTHERHOOD- MANY BRILLIANT BRAINS GOING WASTEHEY.. WE MIGHT CREATE A TRADERS GROUP INTURN CREATE WEALTH FOR YOUR FOLLOWERS... HOPE SOMEONE MIGHT TAKE UP THIS RESPONSIBILITY... REF; IDEA ATTACHED.
SENSEX trade ideas


SENSEX Recession Chart Bear Market Layout - Elliot WaveSENSEX Recession Chart Bear Market Layout - Elliot Wave
Corona Virus has affected us and Economy a lot which I think will surely lead to a Recession,
As in 2008 recession, Market had 63 % decline from ATH which lead to housing market crash.
I think the same will happen again for next 2 years. Good buying level to enter the market for long term is around 21000 level as shown in chart.
also 33000 level is also good to enter short or exit market.

Market Bottom 404?In 2008 crash BSE Sensex dipped approximately 63%. If it happens again going by the ever increasing corona virus numbers, we might end up near 15500. Just a thought.

LET US START An INTRADAY TRADER'S CLUB.LET US FIND THE HEAD FOR THIS CLUB.
WHO SHOULD HEAD THIS PLEASE CHOOSE FROM THE TOP AUTHORS . CAST YOUR PRECIOUS VOTE TO SELECT A LEADER.

Sensex dropped harder than 2008 global financial crisisSensex dropped harder(-15k pts) than 2008 global financial crisis (12.3k pts)


SENSEX FORCAST !! LONG-SHORT-SKYROCKET !!PLEASE IF YOU LIKE WHAT I POST & DO, PLEASE DO NOT REFRAIN FROM GIVING UP A LIKE.
WE PROVIDE CALLS IN THE FREE GROUPS.
ALSO JOIN OUR TELEGRAM CHANNEL.

BSE:SENSEX is at ATH but rejected by a 15 month old trendlineBSE:SENSEX has recorded a All Time High today(26-Nov-19) but it was rejected by a trendline that extends from August 2018 till today. If this trendline is broken on a daily closing basis then I am expecting SENSEX to continue to the upside.

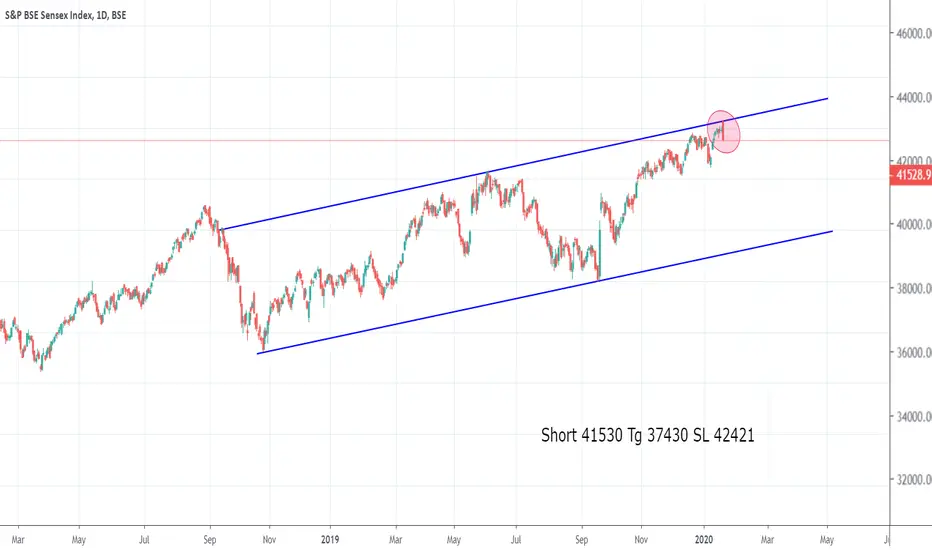
Sensex : Looking For A ShortA massive uptrend was seen in the market from 20th September. From the previous price pattern there is a higher probability for the market to make a correction and test the previous support trend-line before making an upward move. The scenario might change if any radical measures or policies to revive and boost the economy is made from the government side.

On the Way Towards New High Sensex may make a new high once it breaks that red resistance zone to complete abcd pattern
Consult you financial advisor before investment This is just for education and monitoring purpose


Sensex Assessment – Bear MarketSensex Assessment – Bear Market
• Most Reliable resistance level will be broken, If the Price Comes below Support level, then this will act as Resistance and you can expect the market to go down 28,000
• Head and Shoulder Pattern is in formation, the stock to be sold once the re-test done as marked on the chart
• Market have reached 1.618 Level which is most high point, now the market should reverse as a corrective action
• 1st Sell Target to be set to 28000, Will be able to give exact target once the retest is done


Expect long positions from hereWe may see pullback from here technically as we can see strong support level, but it also depends on relief discussion for FPIs and Global markets.

Big bear ahead ?If Sensex long term trend follows suit, we can expect a bear market to extend into 2022


