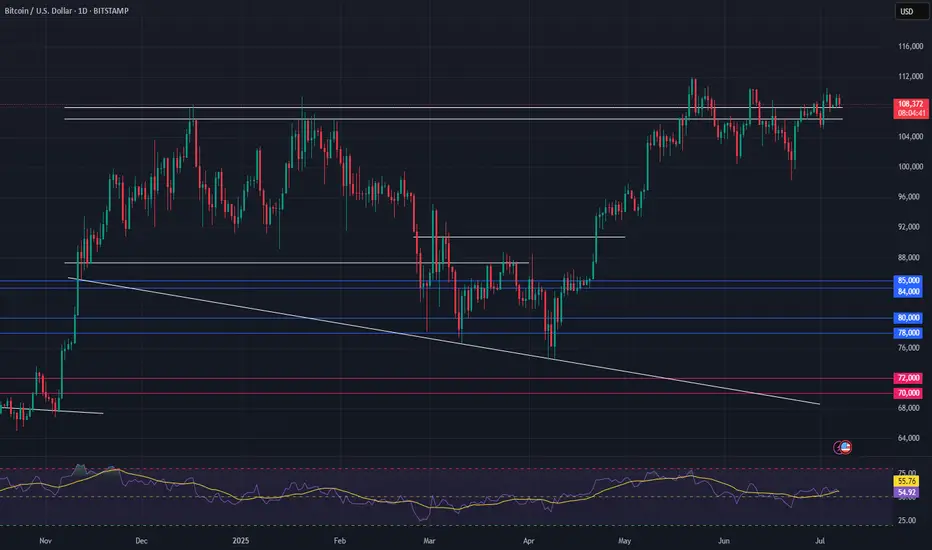
Bitcoin Eyes Breakout — Bullish Setup Gathers StrengthConsolidation Above Key Support:
Bitcoin continues to hold firmly above the $100,000–$105,000 support zone, a critical area that acted as major resistance earlier in 2025. This sustained price action reinforces the prevailing bullish momentum and signals strength beneath the surface.
Wedge Formation Nearing Resolution:
The prolonged wedge pattern now taking shape suggests a substantial move is imminent. The structure supports a breakout scenario, with an initial target of $130,000–$135,000 in play.
Uptrend Intact, No Signs of Exhaustion:
Despite recent weeks of sideways action, Bitcoin continues to consolidate near its highs—a pattern that historically favors continuation, not reversal. The broader trend remains upward and firmly intact.
Focus & Opportunity:
Bitcoin's technical setup justifies close attention in the days ahead. At the same time, traders and investors should keep an eye on select altcoins, which could offer amplified upside as capital rotation picks up momentum.
#Bitcoin #BTC #Crypto #TechnicalAnalysis #BullishSetup #WedgeBreakout #PriceAction #Altcoins #CryptoMarket #MarketUpdate #AllTimeHigh
BTCETH.P trade ideas
BTC/USD Stuck in Range | Watch VWAP & Key Support at 107.5K The recent rejection from near $110K and persistent selling pressure below VWAP across all intraday timeframes (45m/15m/5m/1m) shows bearish momentum building.
$BITSTAMP: BTCUSD
🔍 Key Observations:
VWAP: Price is trading below session VWAP on all short timeframes, showing intraday bearish sentiment.
Structure: Lower highs on the 4H chart signal weakening strength.
Support Zone: Immediate intraday support is seen near $107,500; a breakdown could lead to $106,000 or lower.
Resistance: Sellers are active at $109,000–$110,000.
Optionally add RSI (14) on 1H or 4H to watch for divergences near support/resistance levels.


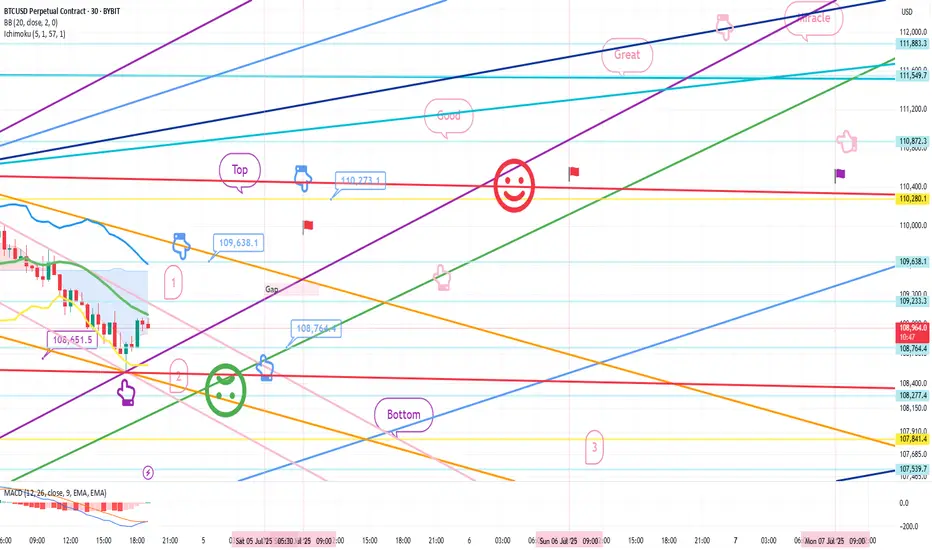
Bitcoin Bybit chart analysis July 4Hello
This is Bitcoin Guide.
If you "follow"
You can receive real-time movement paths and comment notifications on major sections.
If my analysis was helpful,
Please click the booster button at the bottom.
Here is the Bitcoin 30-minute chart.
There is no Nasdaq index announcement today.
There is a possibility that Nasdaq will fall sharply,
but even if it moves sideways, the probability of the strategy succeeding increases.
On the left, with the purple finger,
I connected the 2nd section of the long position that I entered yesterday.
*When the blue finger moves,
Bidirectional neutral
Short->Long or long waiting strategy
1. 109,638.1 dollars short position entry section / cut-off price when orange resistance line is broken
2. 108,764.4 dollars long position switching / cut-off price when green support line is broken
3. 110,273.1 dollars long position 1st target -> target price in order from Miracle
If the strategy is successful, I left a simulation with the pink finger,
so please refer to it.
Those who held long positions yesterday, please check if the purple support line is broken,
If it falls immediately from the current position or
If the pink resistance line is not broken when the 1st section at the top is touched,
It is a vertical decline section,
And if the 109,638.1 dollar short position entry section at the top is not touched,
It is a long waiting strategy at the 2nd section at the bottom.
I think it would be good to think of it as a game in the 1+4 section.
From the 2nd section breakout, I have marked the Bottom -> 3rd section at the bottom.
Up to this point, please just refer to and use my analysis,
I hope you operate safely with principle trading and stop loss prices.
Thank you for your hard work this week.
Bitcoin – Eyes on Breakout Extension Toward $112K and BeyondWeekly structure holds, with short-term triggers aligning for continuation into Fibonacci target zone
⸻
Market Overview
Bitcoin remains structurally bullish across all major timeframes, with higher lows intact and a clean recovery from the last corrective phase. Price action has reclaimed a critical daily level near $108,386.44, and short-term continuation could lead to a retest of the all-time high (ATH) at $112,000. Multiple Fibonacci extension levels suggest a target zone well beyond that mark.
⸻
Long-Term Outlook
On the weekly timeframe, BTC has reestablished its upward expansion after a multi-month corrective leg. The weekly pivot level at $78,370.75 remains untested since the March–April correction, supporting the ongoing bullish phase. Fibonacci projections from the previous impulsive leg position the 123.6% to 161.8% extension between $112,000 and $120,000, with the ATH ($112,000) aligning with the 123.6% marker.
⸻
The Daily Chart
BTC printed a bullish engulfing candle above daily support at $108,386.44, reclaiming structure after breaking a short-term downtrend line. The current advance has established a bullish continuation sequence, with minor consolidation observed below the ATH. The pivot at $105,711.78 is now the key level for trend validation.
⸻
Short-Term Dynamics
The H4 chart shows a break of the descending countertrend line, followed by a successful retest of the H4 pivot at $108,086.43. Price is now approaching a local resistance around $109,578.57, with upside potential into the target Fibonacci cluster. A zig-zag continuation path is sketched, with interim resistances likely to be stair-stepped into higher extensions.
⸻
Trigger Conditions
• Long Trigger: Break and hold above $109,578.57
• Short Trigger: Break below $108,086.43 (risk of deeper retest into $105,711.78 daily pivot)
⸻
Target Zones
• H4 Target Fibonacci: $111,241.94 (161.8%)
• Weekly Fibonacci Zone: $112,000 (ATH), $116,000 (150%), $120,000 (161.8%)
⸻
Validity
Daily pivot at $105,711.78. A breakdown below this level would invalidate the current bullish continuation thesis and shift the focus back to the $105K–$103K support range.
⸻
Summary
Bitcoin remains structurally bullish with alignment across weekly, daily, and H4 charts. The reclaim of $108K daily support and break of short-term countertrend structure supports further upside toward the ATH at $112,000 and higher Fibonacci levels. Key trigger for upside continuation lies just above $109,578.57. Downside invalidation sits at the daily pivot ($105,711.78), which must hold to sustain the bullish outlook.
What’s your take on BTC’s current setup? Share your view in the comments—let’s compare frameworks.

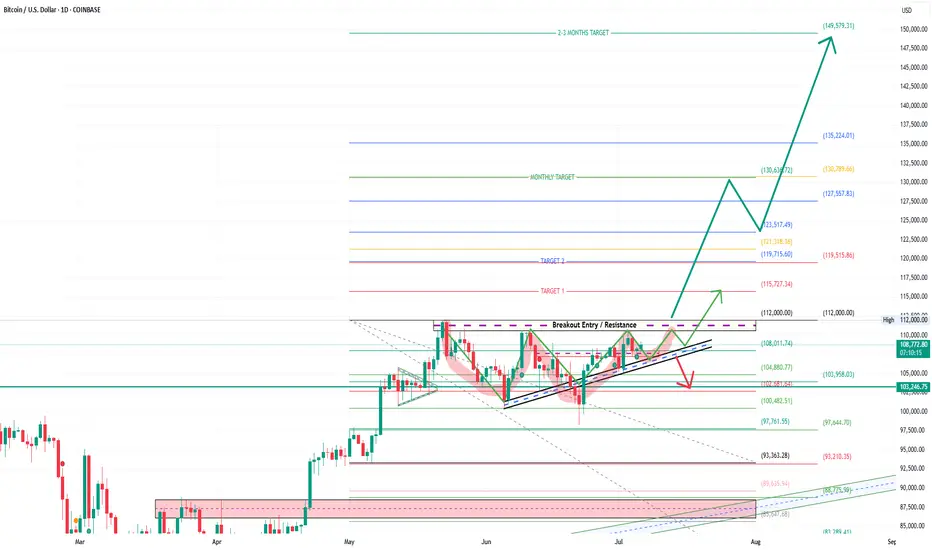
Bitcoin Breakout Setup | Monthly Target $130K, Eyeing $149KBitcoin is forming a strong ascending triangle pattern, approaching a key horizontal resistance zone near $112,000, as marked by “Breakout Entry / Resistance” on the chart.
The price structure shows higher lows converging under a flat top, which indicates potential energy build-up for a major breakout. The setup suggests strong bullish momentum if the breakout confirms with volume.
Key Levels & Targets:
Breakout Level: $112,000
Target 1: $115,727
Target 2: $123,517
Monthly Target: $130,639
Extended Targets (2–3 Month Outlook): $135,224 → $149,579
Support Zones to Watch:
$108,011 → $104,880 (ascending trendline)
$103,958 → $100,482 (critical support)
Breakdown invalidation: Below $97,761 could trigger deeper downside
Trade Plan:
Entry Zone: On breakout above $112,000
Stop Loss: Below $104,880 (aggressive), or $103,246 (safe)
Target Path: $115K → $123K → $130K → $149K
Pattern: Ascending Triangle Breakout
Risk-Reward: High reward with well-defined risk control
Bitcoin’s trend is aligning with strong demand and pattern continuation signals, supported by breakout volume zones and long-term Fibonacci levels. This may be the start of a major leg higher if resistance is flipped to support.
Disclaimer:
This chart is for educational purposes only. Please consult your financial advisor and apply proper risk management before entering or exiting trades.
BTC/USD Bullish Reversal Breakout Pattern BTC/USD Bullish Reversal Breakout Pattern 🚀
Technical Analysis:
🔹 Trend Reversal: The chart shows a clear inverse head and shoulders pattern highlighted with orange circles — a strong bullish reversal signal after a downtrend.
🔹 Breakout Zone: The neckline resistance around 108,000 USD has turned into support (marked as “SU00QT” due to a typo, assumed to be “SUPPORT”). Price action is consolidating just above this zone.
🔹 Trendline Support: The upward blue trendline confirms bullish structure, with price forming higher lows. Recent price action is bouncing off this trendline, showing strength.
🔹 Bullish Confirmation: Green arrows indicate strong bullish rejections from key levels, aligning with breakout retests.
🔹 Target Projection: The measured move from the inverse head and shoulders pattern projects a target towards the 114,000 USD resistance zone 📦 highlighted above, suggesting a potential 5-6% upside move 📊.
Conclusion: As long as price holds above the 108,000 support zone and the ascending trendline, BTC/USD remains bullish with potential continuation towards 114,000 USD. A breakout above minor consolidation could trigger a strong bullish rally 💥.
🛑 Invalidation: A sustained break below 106,000 USD would invalidate the bullish structure and may lead to further downside.

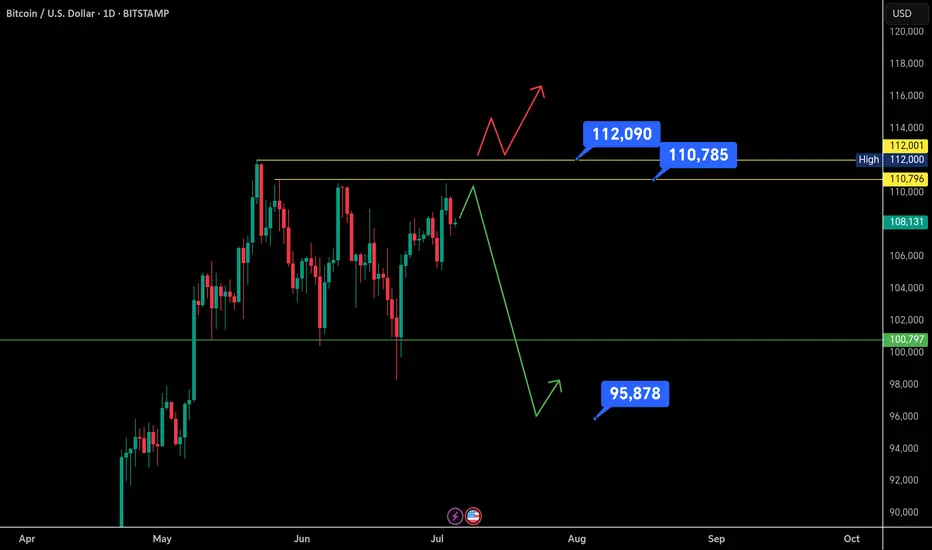
$Btc Summer Scenarios: Breakout or Breakdown?Bitcoin is currently forming higher lows, indicating bullish intent — but strong resistance around $110.6K continues to hold.
There are 3 key scenarios developing:
1. Double Top Formation: If BTC faces rejection again near $110.5K, a double top may form, leading to a potential drop.
2. Bullish Breakout: A successful breakout above both resistance levels could push BTC toward $116K–$120K.
3. Bearish Breakdown: If rejection happens earlier without retesting, BTC might crash directly to a lower low around $95K–$96K.
RSI indicates underlying strength, but until a decisive breakout or rejection confirms, traders should remain cautious and patient.
Bitcoin levels buy near support sell near resistance also How My Harmonic pattern projection Indicator work is explained below :
Recent High or Low :
D-0% is our recent low or high
Profit booking zone: D13% -D15% is
range if break them profit booking start on uptrend or downtrend but only profit booking, trend not changed
SL reversal zone : SL 23% and SL 25% is reversal zone if break then trend reverse and we can take reverse trade
Target : T1, T2, T3, T4 and .
Are our Target zone

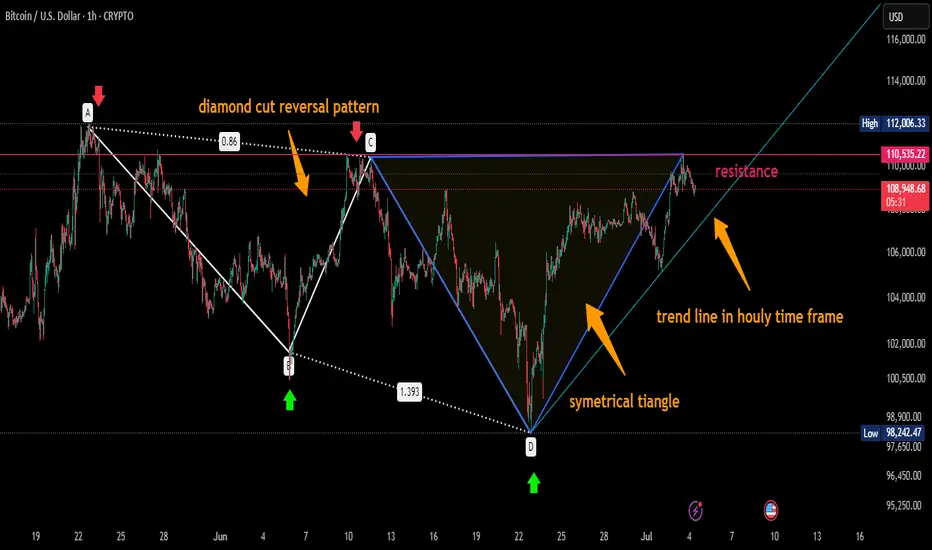
BITCOIN FORMED TWO PATTERNHere i drawn two pattern
1 diamond cut pattern which i call kite which is reversal patten and here you can see clearly that reversal fron exacly at its ratio.
color WHITE
2 There is symmetrical triangle pattern which is trend following pattern but her minor trend change is visible whenever it break resistance mentioned here we can expect bigger move .
Long only at sopport and breakout this is not my buy/sell call.
3 A trend line of hourly support lini in BLUE.
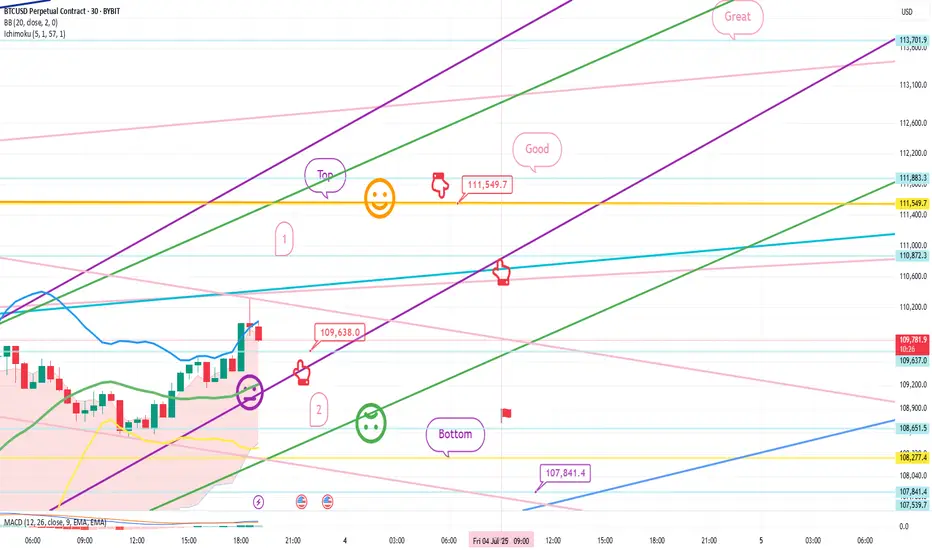
Bitcoin Bybit chart analysis July 3Hello
This is Bitcoin Guide.
If you "follow"
You can receive real-time movement paths and comment notifications on major sections.
If my analysis was helpful,
Please click the booster button at the bottom.
Here is the Bitcoin 30-minute chart.
There will be a Nasdaq index announcement at 9:30 and 11:00 in a little while.
I created today's strategy based on the Nasdaq pattern and Tether dominance vertical decline conditions.
*One-way long position strategy when the red finger moves
1. $109,838 long position entry point / stop loss price when the purple support line is broken
2. $111,549.7 long position 1st target -> Great 2nd target
The 1st section at the top and the 2nd section at the bottom are sideways sections.
Even if the strategy fails, if the green support line is not broken,
it is good for a long position.
Below that
Bottom -> Please note that it is open up to 107,841.4 dollars
Up to this point, I ask that you simply use my analysis for reference and use only
I hope that you operate safely with principle trading and stop loss prices.
Thank you.
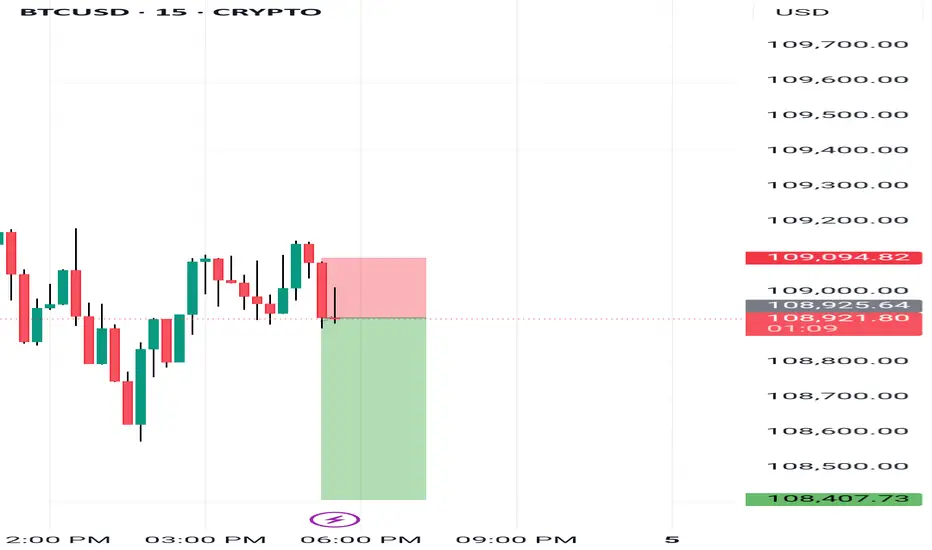
Bitcoin is currently exhibiting a strong bullish structure on thBitcoin is currently exhibiting a strong bullish structure on the 15-minute timeframe. The price action has consistently formed a series of Higher Lows (HLs), indicating sustained buying pressure and strength in the uptrend.
The most recent HL has been respected, and price is now attempting to bounce from this zone. A long position appears to be in play with a favorable risk-reward setup, suggesting expectations of further upside.
🔼 Key Bullish Signals:
Series of Higher Lows indicate trend continuation.
Price reacting positively near recent HL.
Strong support just below current levels.
📍Resistance (Target): 110,697
📍Support (Stop Loss): 108,534

Master Institutional TradingBenefits of Option Trading:
Leverage with less capital.
Hedging against market risks.
Income generation through premium collection.
Risks of Option Trading:
Complex pricing structures.
Potential for significant losses if not properly managed.
Divergence Trading
Divergence trading is a technical strategy based on the observation that asset prices and their related indicators (like RSI, MACD, etc.) sometimes move in opposite directions.

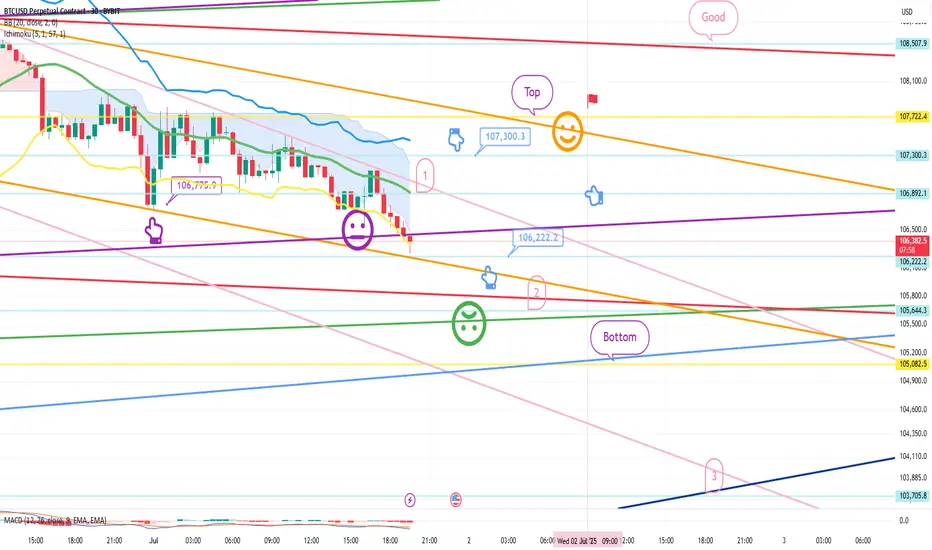
Bitcoin Bybit chart analysis July 1
Hello
This is Bitcoin Guide.
If you "follow"
You can receive real-time movement paths and comment notifications on major sections.
If my analysis was helpful,
Please click the booster button at the bottom.
Here is the Bitcoin 30-minute chart.
Shortly later at 10:30 PM and 11:00 PM, there will be a NASDAQ index announcement.
On the left, with a purple finger,
I connected the long position entry point of $106,775.9, which I entered yesterday, to today's strategy.
Since the rebound was not strong yesterday,
the 12-hour chart -> daily chart MACD dead cross is currently under pressure.
Depending on the situation, it can drop strongly to the 3rd section at the bottom,
and since there may be some people who are maintaining long positions yesterday,
I will explain in detail the operating method such as the loss cut price,
so please check it carefully.
*When the blue finger moves,
Bidirectional neutral
Short->Long switching strategy
1. 107,300.3 dollars short position entry section / stop loss price when orange resistance line is broken
2. 106,222.2 dollars long position switching / stop loss price when section 2 is touched
3. Top section long position 1st target -> Good 2nd target
It is important until 9 o'clock when the 12-hour candle is created.
After 9 o'clock, the blue finger 106,222.2 dollars at the bottom
Becomes the main support line
If it comes down from the current position, section 2
The main support line is divided.
In terms of the pattern, it is section 6+12.
If section 2 is touched right away,
There is a high possibility of a strong drop today,
So you should be careful.
- Those who are maintaining a long position
If you touch the 2nd section before 9 PM without touching the short position entry point at the top
You should operate at a loss cut price.
I think it would be good to adjust it according to leverage.
If it falls after touching the 1st section at the top
It becomes a vertical decline condition.
From the bottom, from the 3rd
Maximum Bollinger Band daily chart support line section
Please note that it can be pushed up to 100,685.5 dollars.
I have never changed my perspective suddenly or irresponsibly after leaving an analysis article.
I did my best until the end today.
Please use my analysis article so far only for reference and use
I hope you operate safely with principle trading and loss cut prices.
Thank you.
BTCUSD Short Opportunity – Bearish Channel Resistance TestPair: BTCUSD
Timeframe: 4H
I’m planning a short position on Bitcoin based on this well-defined descending channel structure.
🔹 Setup Explanation:
Price has been respecting a downward-sloping channel, with multiple touches at both the upper and lower bounds.
Currently, BTC is testing the upper trendline resistance of this channel near the $108,000–$109,000 area.
This area also aligns with prior supply zones where strong selling pressure emerged.
The recent impulsive move up appears overextended, increasing the likelihood of a technical pullback.
🔹 Potential Reversal Area:
Upper channel boundary: ~108,500–109,000 USD
Confluence with previous horizontal resistance
Weak momentum candles forming near this resistance
🔹 Trade Plan:
Entry Zone: Between 108,000–109,000 (as price consolidates near the channel top)
Stop-Loss: Above 110,000 to protect against breakout and invalidation of the pattern
Target Zone:
First Target (TP1): 104,500 (gray support zone mid-channel)
Second Target (TP2): 97,000 (lower channel boundary)
🎯 Risk-to-Reward:
Targeting a 1:2 to 1:3 R:R, depending on execution
This means risking ~1,500–2,000 points for a potential reward of 4,000–10,000 points
🛡️ Important Notes:
Watch for strong bullish momentum or a clean breakout above 110,000—this invalidates the setup.
Confirm rejection with lower timeframe bearish signals (e.g., bearish engulfing or supply zone rejection).
Be prepared to trail stop after TP1 is hit to secure profits.
✅ Summary:
This setup aims to capitalize on the potential rejection from the upper boundary of a long-standing descending channel, expecting BTCUSD to retest the mid and lower range support zones.

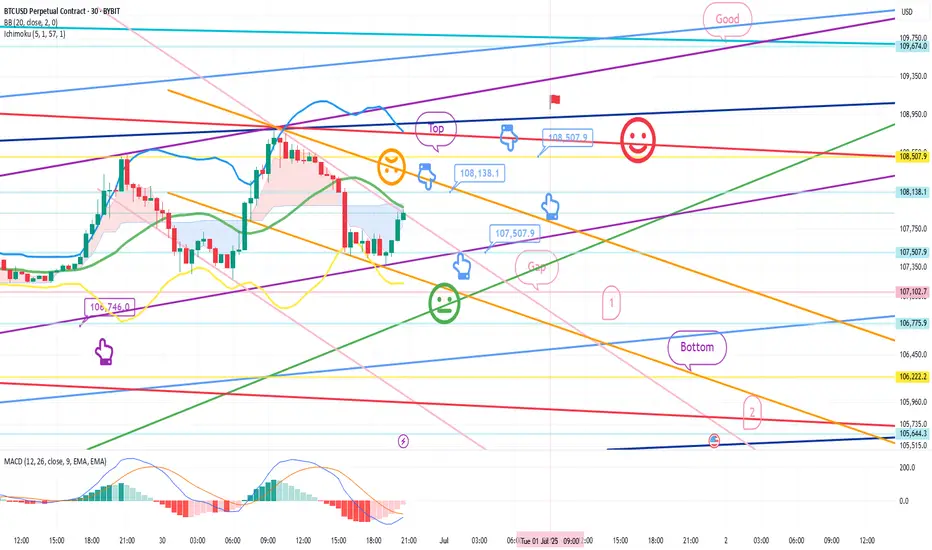
Bitcoin Bybit chart analysis June 30 Hello
This is Bitcoin Guide.
If you "follow"
You can receive real-time movement paths and comment notifications on major sections.
If my analysis was helpful,
Please click the booster button at the bottom.
This is the Bitcoin 30-minute chart.
There is no separate indicator announcement today.
The weekly and daily charts are being adjusted at the same time as they are created.
The strategy was carried out based on the Nasdaq pattern and the Tether dominance pattern.
The long position entry section on the 25th, $106,746, was connected as is.
*When the blue finger moves,
It is a two-way neutral
short->long switching or long waiting strategy.
1. $108,138.1 short position entry section / stop loss price when orange resistance line is broken
2. $107,507.9 long position switching / stop loss price when green support line is broken
3. $108,507.9 long position 1st target -> Good 2nd target price
You can also use the long position re-entry indicated in the middle.
If it comes down right away without touching the short entry section at the top,
it is a long waiting strategy at the gap section of 107,102.7 dollars,
and the stop loss price is the same.
And, if it succeeds in rebounding within the purple support line today,
the reason it is safe from a long position is
because the low point of the weekly and daily candles created this week is maintained without additional deviation.
Please note that the 1st section at the bottom is a sideways market / the 2nd section is open up to the bottom.
Please use my analysis article so far only for reference and use,
and I hope you operate safely with the principle trading and stop loss price.
Thank you.
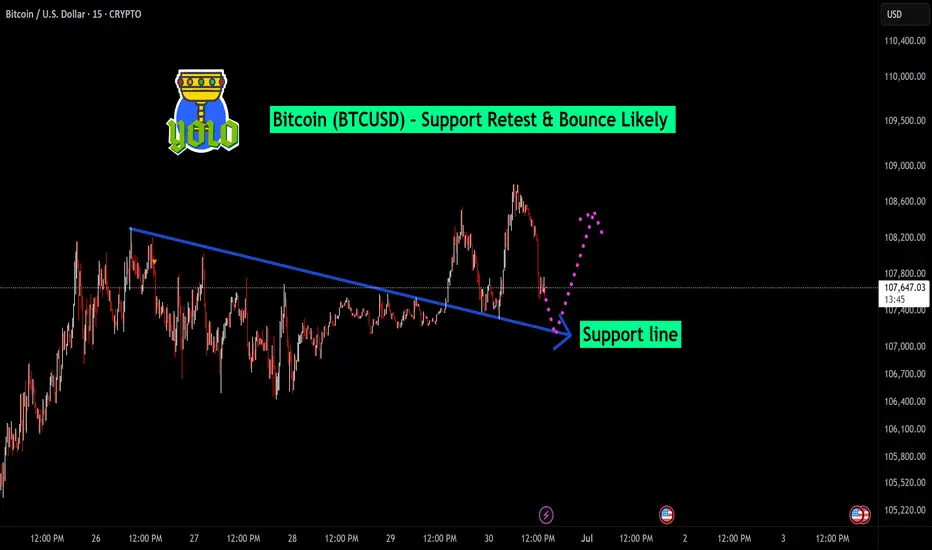
Bitcoin (BTCUSD) – Support Retest & Bounce Likely BTC has pulled back after a strong upward move and is now approaching a key support zone near $107,150 – $107,000. This level has previously acted as a breakout zone and now may serve as a strong demand area.
🔄 Scenario Building:
Price is coming down to retest the former resistance (now turned support).
If the support at $107,150 – $107,000 holds, a bounce back toward $107,800 – $108,000 can be expected.
Structure suggests bullish continuation if buyers step in around this zone.
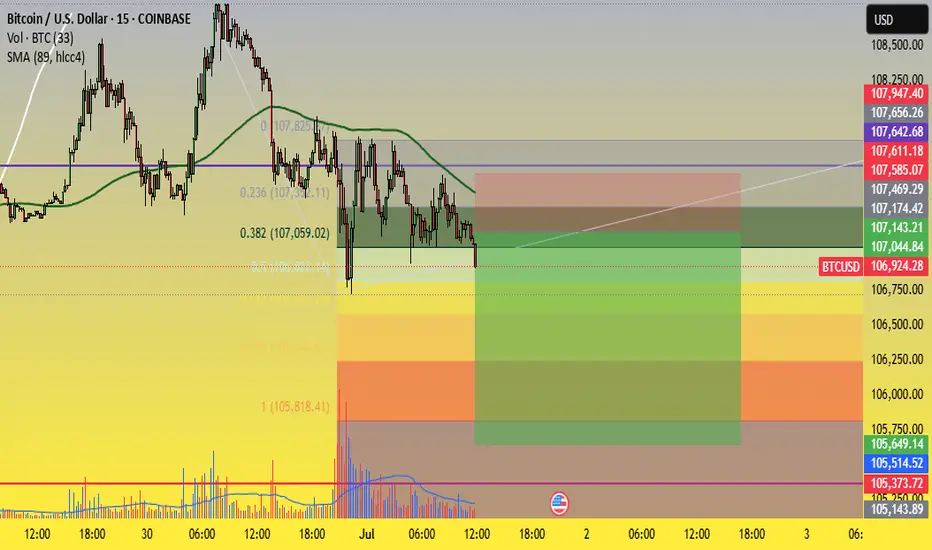
BTCUSD SELL Recommendation – 15-Minute Chart (M15)Sell on short-term downtrend continuation after a technical pullback near resistance and Fibonacci levels.
🎯 Trade Setup:
Sell Zone: 107,000 – 107,200
Stop Loss (SL): 107,650 – 107,850 (above resistance + Fib 23.6% zone)
Take Profit (TP): 105,500 – 105,700
Risk:Reward Ratio: Approx. 1:2 to 1:2.5 – suitable for short-term scalping/swing
📊 Technical Analysis:
1. Fibonacci & Resistance Confluence:
Price is reacting to the Fibonacci 0.382 level (107,059) – a common retracement level in downtrends.
The zone 107,000 – 107,200 overlaps with historical resistance and previously rejected candles → indicating distribution.
2. Moving Average (MA) Pressure:
Price is trading below the MA, and recent pullbacks failed to break above it.
The most recent bounce was rejected around 107,200, suggesting bearish pressure remains.
3. Volume Analysis:
Volume declined on the pullback, showing weak buying momentum.
Meanwhile, the recent drop came with a high-volume bearish candle → sellers are in control.
4. Target Zone – Support Area:
105,500 – 105,700 is a previous swing low and aligns with the Fibonacci 0.618 – 0.786 zone, making it a strong potential bounce area.
This is a reasonable target before the market decides its next direction.
⚠️ Risk Management Notes:
Look for bearish reversal candlestick patterns (e.g., pin bar, bearish engulfing) in the entry zone for confirmation.
If BTC closes strongly above 107,650, consider the short setup invalidated.
Fl me and trading with me! fl Ytb....
Shorting BTCUSD After Trendline Failure & Bearish RetestPlanning to short BTCUSD as price has rejected from the descending trendline resistance after breaking the minor ascending trendline support. The confluence of trendline rejection and bearish retest suggests potential downside continuation.
Entry Zone: ~107,300–107,350
Stop-Loss: Above 107,550 (recent high)
Target: 106,550 support area
Risk-to-Reward Ratio: ~1:2 (Min) 1:4 (Final Target)
Quote:
"Trendline confluence and failed bullish continuation often lead to deeper pullbacks."
📊 Summary of the Idea
✅Reason for Entry: Multiple rejections at trendline + structure breakdown.
✅Confirmation: Retest rejection candle.
✅Invalidation: A clean breakout and hold above the descending trendline.

Bitcoin buy near 106000 upside fresh ATH possible SL 103500 How My Harmonic pattern projection Indicator work is explained below :
Recent High or Low :
D-0% is our recent low or high
Profit booking zone: D13% -D15% is
range if break them profit booking start on uptrend or downtrend but only profit booking, trend not changed
SL reversal zone : SL 23% and SL 25% is reversal zone if break then trend reverse and we can take reverse trade
Target : T1, T2, T3, T4 and .
Are our Target zone

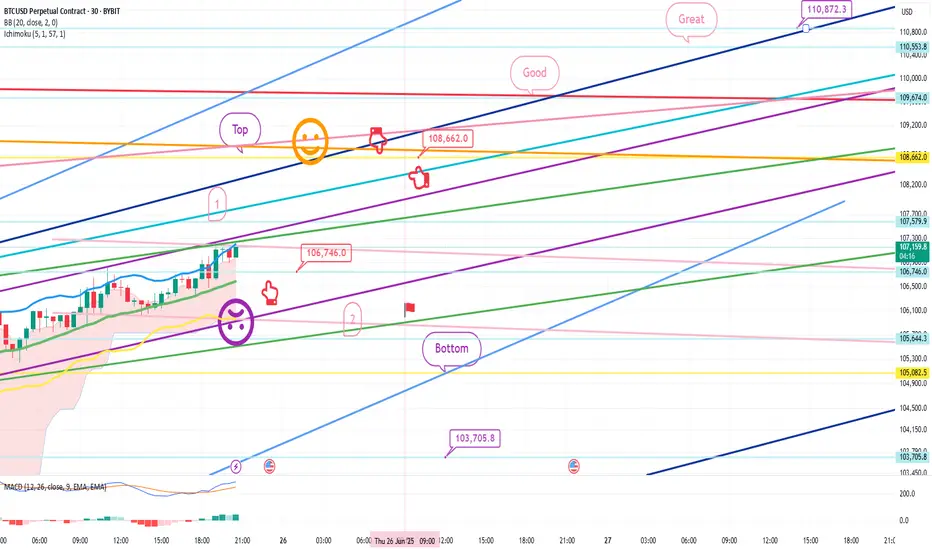
Bitcoin Bybit chart analysis June 25Hello
This is Bitcoin Guide.
If you "follow"
You can receive real-time movement paths and comment notifications on major sections.
If my analysis was helpful,
Please click the booster button at the bottom.
This is the Bitcoin 30-minute chart.
Nasdaq indicators will be announced at 11 o'clock shortly.
Nasdaq is rising vertically + renewing its all-time high.
Accordingly, I ignored the weekly MACD dead cross and
proposed the strategy for the pattern by substituting Tether dominance.
Although it is not visible on the screen,
I created today's strategy with the condition of maintaining the long position of $100,587.9 that was confirmed on the 23rd.
* One-way long position strategy when the red finger moves
1. $106,746 long position entry section / When the purple support line is broken
or when section 2 is touched, stop loss price
2. $108,66 long position 1st target -> Good 2nd -> Great 3rd target price
When section 1 at the top touches, it can be connected to an upward trend,
and section 2 is a sideways market.
At the very bottom and the very top,
I have indicated the maximum possible trend until tomorrow afternoon.
Up to this point, I ask that you simply use my analysis for reference and use only
I hope that you will operate safely with the principle of trading and stop loss.
Thank you.
Exhausted all buerys As in daily time frame market show of big bull run of 1000 points burnt but after reaching 980 points it is showing some rejection at top levels as buyers are not interested and not consecutive why is happening at this levels so it is a coming downwards so I have to cut trade at 1 hour setup seeing that market is exhausting all buyers as buyers make it trapped in such a move so got a risk reward of 1:10
