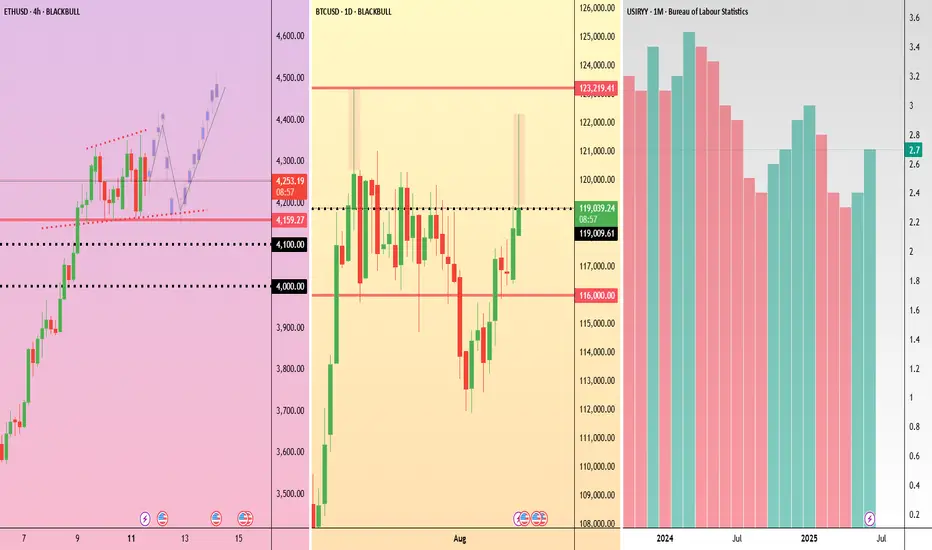
Inflation Countdown: BTC and ETH at Key Levels Ahead of CPI Market focus is quickly turning to the US CPI report coming up this week. A higher-than-expected figure might weigh on risk assets like Bitcoin and Ethereum, keeping the former in rangebound mode and the latter fighting for a handle above $4,000.
Ethereum is consolidating just above the $4,150 level after a sharp rally. The recent higher highs and higher lows keep the short-term bias bullish, but a sustained move below $4,100 could indicate shifting momentum.
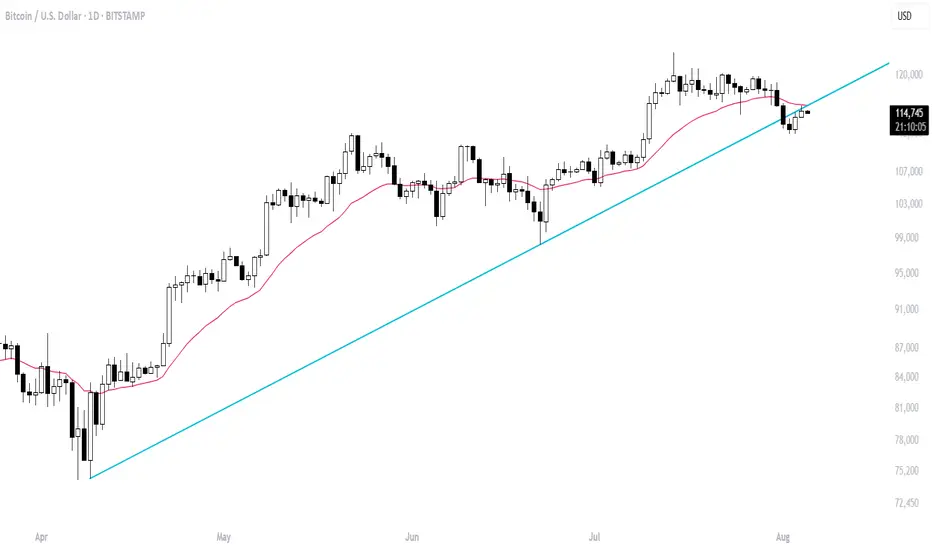
Bitcoin is testing resistance at $119,000 after a solid recovery from below $113,000. The price remains inside a broader range between $116,000 and $123,000, with repeated upper wicks signalling sellers defending the top of the range.
Trade ideas
Bitcoin buy recommended @116800 near today booked profit 122000Bitcoin buy given at 116800 near today booked profit at 122000, more than 5000 points profit, , bitcoin buy on dip levels given on chart , bitcoin 125000 , 127000 positional target

Psychology & Risk Management in Trading 1. Introduction
Trading is often thought of as a purely numbers-driven game — charts, technical indicators, fundamental analysis, and economic data. But in reality, the true battlefield is inside your head. Two traders can have access to the exact same market data, yet end up with completely different results. The difference lies in psychology and risk management.
Psychology determines how you make decisions under pressure.
Risk management determines whether you survive long enough to benefit from good decisions.
Think of trading as a three-legged stool:
Strategy – Your technical/fundamental system for entering and exiting trades.
Psychology – Your ability to stick to the plan under real conditions.
Risk Management – Your safeguard against catastrophic loss.
If one leg is missing, the stool collapses. A profitable strategy without psychological discipline becomes useless. A strong mindset without proper risk controls eventually faces ruin. And perfect risk management without skill or discipline simply results in slow losses.
Our goal here is to align mindset with money management for long-term success.
2. Understanding Trading Psychology
2.1. Why Psychology Matters More Than You Think
When you’re trading, money is not just numbers — it represents:
Security (fear of losing it)
Freedom (desire to win more)
Ego (feeling smart or dumb based on market outcomes)
This emotional attachment creates mental biases that cloud judgment. Unlike a chessboard, the market is an uncertain game — the same move can lead to a win or loss depending on external forces beyond your control.
The primary enemy is not “the market,” but you:
Closing winning trades too early out of fear.
Holding onto losing trades hoping they’ll recover.
Overtrading to “make back” losses.
Avoiding valid setups after a losing streak.
2.2. The Main Psychological Biases in Trading
1. Loss Aversion
Humans hate losing more than they like winning. Research shows losing $100 feels twice as bad as gaining $100 feels good.
In trading, this causes:
Refusing to take stop losses.
Adding to losing positions to “average down.”
2. Overconfidence Bias
After a streak of wins, traders often overestimate their skill.
Example: Turning a $1,000 account into $2,000 in a week might lead to doubling trade size without a valid reason.
3. Confirmation Bias
Seeking only information that supports your existing view. If you’re bullish on gold, you might only read bullish news and ignore bearish signals.
4. Recency Bias
Giving too much weight to recent events. A trader who just experienced a big rally might expect it to continue, ignoring long-term resistance levels.
5. Fear of Missing Out (FOMO)
Jumping into trades without proper analysis because you see the market moving.
6. Revenge Trading
Trying to “get back” at the market after a loss by taking impulsive trades.
2.3. Emotional States and Their Effects
Fear – Leads to hesitation, missed opportunities, and premature exits.
Greed – Leads to over-leveraging and chasing setups.
Hope – Keeps traders in losing trades far longer than necessary.
Regret – Causes paralysis, stopping you from entering new opportunities.
Euphoria – False sense of invincibility, leading to reckless trades.
3. Mastering the Trader’s Mindset
3.1. Accepting Uncertainty
Markets are probabilistic, not certain. The best trade setups still lose sometimes. The key is to think in terms of probabilities, not certainties.
Mental shift:
Bad trade ≠ losing trade.
Good trade ≠ winning trade.
A “good trade” is one where you followed your plan and managed risk — regardless of the outcome.
3.2. Developing Discipline
Discipline means doing what your trading plan says every time, even when you feel like doing otherwise.
Practical ways to build discipline:
Pre-market checklist (entry/exit rules, risk per trade, market conditions).
Post-trade review to identify emotional decisions.
Simulated trading to practice following rules without monetary pressure.
3.3. Managing Emotional Cycles
Traders often go through repeated emotional phases:
Excitement – New strategy, first wins.
Euphoria – Overconfidence and overtrading.
Fear/Panic – Sharp drawdown after reckless trades.
Desperation – Trying to recover losses quickly.
Resignation – Stepping back, reevaluating.
Rebuilding – Adopting better discipline.
Your goal is to flatten the cycle, reducing extreme highs and lows.
4. Risk Management: The Survival Mechanism
4.1. The Goal of Risk Management
Trading is not about avoiding losses — losses are inevitable. The aim is to control the size of your losses so they don’t destroy your capital or confidence.
4.2. The Three Pillars of Risk Management
1. Position Sizing
Determine how much capital to risk per trade. Common rules:
Risk only 1–2% of total capital on any single trade.
Example: If you have ₹1,00,000 and risk 1% per trade, your max loss is ₹1,000.
2. Stop Losses
Predetermined exit points to limit losses.
Hard stops – Fixed at a price level.
Trailing stops – Move with the trade to lock in profits.
3. Risk-Reward Ratio
A measure of potential reward vs. risk.
Example:
Risk: ₹500
Potential Reward: ₹1,500
R:R = 1:3 (good)
4.3. The Power of Capital Preservation
Here’s why big losses are dangerous:
Lose 10% → Need 11% gain to recover.
Lose 50% → Need 100% gain to recover.
The bigger the loss, the harder the comeback. Capital preservation should be your #1 priority.
4.4. Avoiding Overleveraging
Leverage magnifies both gains and losses. Many traders blow accounts not because their strategy was bad, but because they used excessive leverage.
5. Integrating Psychology with Risk Management
5.1. The Feedback Loop
Poor psychology → Poor risk decisions → Bigger losses → Worse psychology.
You must break the loop by locking in good risk rules before trading.
5.2. The Risk Management Mindset
Treat each trade as just one of thousands you’ll make.
Focus on execution quality, not daily P/L.
Celebrate following your plan, not just winning.
5.3. Journaling
A trading journal should include:
Entry/exit points and reasons.
Risk per trade.
Emotional state before/during/after.
Lessons learned.
Over time, patterns emerge that reveal weaknesses in both mindset and risk control.
6. Practical Tips for Building Psychological Strength
Meditation & Mindfulness – Keeps emotions in check.
Physical Health – A healthy body supports a calm mind.
Sleep – Fatigue increases impulsive decisions.
Routine – Structured trading hours reduce stress.
Detach from P/L – Judge performance over months, not days.
7. Case Studies: When Psychology Meets Risk
Case Study 1 – The Overconfident Scalper
Wins 10 trades in a row, doubles position size.
One loss wipes out previous gains.
Lesson: Stick to fixed risk % per trade regardless of winning streaks.
Case Study 2 – The Hopeful Investor
Holds losing position for months.
Avoids taking stop loss because “it’ll recover.”
Lesson: Hope is not a strategy; use predefined exits.
8. Conclusion
Trading success is 20% strategy and 80% mindset + risk control. The market will always test your patience, discipline, and emotional control. By mastering your psychology and implementing rock-solid risk management, you give yourself the best chance not just to make money — but to stay in the game long enough to grow it.

BTC/USDThe BTC/USD trade with an entry price of 116,579, stop-loss at 116,404, and exit price at 116,932 is a short-term buy trade setup aimed at capturing a modest upward movement in Bitcoin’s price. This trade targets a profit of approximately 353 points, with a controlled risk of about 175 points, giving a favorable risk-to-reward ratio of nearly 1:2.
The entry price of 116,579 is likely chosen after confirming bullish momentum through technical analysis. This could include a breakout above a short-term resistance level, a bounce from support, or confirmation from indicators such as RSI, MACD, or moving averages. Entering at this point suggests the trader expects continued upward movement toward the profit target.
The stop-loss at 116,404 is placed strategically below a recent support area. This ensures that if the market moves against the trade, losses are minimized and capital is preserved. In volatile assets like Bitcoin, having a tight but logical stop-loss is critical to avoid large drawdowns.
The exit price of 116,932 serves as the take-profit level. This target is likely aligned with a nearby resistance zone or calculated through chart patterns like Fibonacci extensions. Securing profits at this point helps prevent losses from sudden reversals.
Overall, this setup reflects disciplined trading with a well-defined entry, strict risk control, and a realistic profit goal—key elements for consistent success in BTC/USD trading.

Part9 Trading MasterclassCategories of Options Strategies
Directional Strategies – Profit from a clear bullish or bearish bias.
Neutral Strategies – Profit from time decay or volatility drops.
Volatility-Based Strategies – Profit from big moves or volatility increases.
Hedging Strategies – Reduce risk on existing positions.
Directional Strategies
Bullish Strategies
These make money when the underlying price rises.
Long Call
Setup: Buy 1 Call
When to Use: Expect sharp upside.
Risk: Limited to premium paid.
Reward: Unlimited.
Example: Nifty at 22,000, buy 22,200 Call for ₹150. If Nifty rises to 22,500, option might be worth ₹300+, doubling your investment.
Bull Call Spread
Setup: Buy 1 ITM/ATM Call + Sell 1 higher strike Call.
Purpose: Lower cost vs. long call.
Risk: Limited to net premium paid.
Reward: Limited to difference between strikes minus premium.
Example: Buy 22,000 Call for ₹200, Sell 22,500 Call for ₹80 → Net cost ₹120. Max profit ₹380 (if Nifty at or above 22,500).
Bull Put Spread (Credit Spread)
Setup: Sell 1 higher strike Put + Buy 1 lower strike Put.
Purpose: Earn premium in bullish to neutral markets.
Risk: Limited to spread width minus premium.
Example: Sell 22,000 Put ₹200, Buy 21,800 Put ₹100 → Credit ₹100.

BTC HOURLY CHART ANALYSISHere you can understand movement of BTC easily
there is a triangle ABCD pattern in yellow dotted line where break out is clearly visible at point D ,After breakout came to take support which is shown here i orrange horrizontal line.
And now we will come to ascending channel which is in blue coloured parrallel line. BTC following this channel you can buy/sell at support and resistance .
during trading take care of breakout /breakdown ad decide as per situation.
this is not my buy/sell call.

BTC trade planBullish: BTC broke major resistance yesterday with strong green candle, it may retest at 115000 level and continue upside momentum.
Bearish: If it breaks115000 level and starts going down wait for retest and target can be below trend line.

BTCUSD Eyes Lowest Support Retest-Weakness PersistsThis 15-minute chart on BTCUSD reflects sustained bearish conditions, with clear rejection patterns and sell momentum guided by Leola Lens SignalPro overlays.
🔍 Technical Structure Highlights
🔻 Multiple SELL signals continue to appear below compression zones — indicating persistent supply.
🟡 Caution Labels marked each major swing low, capturing high-probability trend reversal zones, but no structural breakout followed.
🟥 Price remains trapped beneath both adaptive red and white base trendlines, confirming dominant downside bias.
🟩 A brief BUY signal appeared inside a narrow range, but failed to follow through — highlighting overall market weakness.
🔁 What to Watch
A clean move above $113,374 is needed to shift momentum toward the $114,800–$116,000 resistance band.
If rejection holds, price may rotate back toward the lower support zone near $112,713, or further.
🧠 This chart illustrates a structure-first approach using Leola Lens SignalPro. For educational analysis only. Trade safe.
#BTCUSD #Bitcoin #Crypto #LeolaLens #StructureTrading #SmartContext #PriceAction

Bitcoin Short-Term Rejection at Golden Pocket Zone!Bitcoin faced strong resistance near the 61.8% Fibonacci retracement level (~116,400), aligning perfectly with a descending trendline from the previous highs — a classic confluence zone for a rejection.
🔻 Price formed a rejection wick and is now trading below that key zone, suggesting potential bearish pressure unless bulls reclaim and sustain above 116.4K.
📌 Key Levels:
Resistance: 116,400 (61.8% Fib + Trendline)
Immediate Support Zone: 115,250–114,500
Deeper Demand Zone: 113,250–113,000
💡 Watch how price reacts at the mid-support zone (115k). If broken, BTC could revisit the deep demand zone. Bulls must reclaim 116.4K for further upside continuation.
⚔️ Structure: Lower High in play
⏳ Timeframe: 1H
🛑 Bias: Short-term Bearish unless breakout confirmed above 116.4K
#Bitcoin #BTC #BTCUSD #CryptoTrading #TechnicalAnalysis #TradingView #PriceAction #Fibonacci #SupportResistance #BearishRejection #CryptoIndia #BitcoinAnalysis #BTCUpdate
BTC Correction Over? Not yet!The day candle is yet to close, and even though the current price for BTC has penetrated above 20DEMA, the correction isn't technically over. Two hurdles remain to be conquered by the bulls. First, getting over the upward trend line (blue), which is now acting as resistance. Second, crossing above the falling parallel channel (purple).
I would call it the end of correction when BTC closes above $117,339 on a daily chart. That level is also the lowest closing price during the 19-day consolidation.

Part9 Trading MasterclassHow Options Work
Let’s break this down with an example.
Call Option Example:
You buy a call option on Stock A with a strike price of ₹100, paying a premium of ₹5. If the stock price rises to ₹120, you can buy it for ₹100 and sell it for ₹120—earning a ₹20 profit per share, minus the ₹5 premium, netting ₹15.
If the stock stays below ₹100, you simply let the option expire. Your loss is limited to the ₹5 premium.
Put Option Example:
You buy a put option on Stock A with a strike price of ₹100, paying a ₹5 premium. If the stock falls to ₹80, you can sell it for ₹100—earning ₹20, minus ₹5 premium = ₹15 profit.
If the stock stays above ₹100, the option expires worthless. Again, your loss is limited to ₹5.
Why Trade Options?
A. Leverage
Options require a smaller initial investment compared to buying stocks, but they can offer significant returns.
B. Risk Management (Hedging)
Options can hedge against downside risk. For example, if you own shares, buying a put option can protect you against losses if the price falls.
C. Income Generation
Writing (selling) options like covered calls can generate consistent income.
D. Strategic Flexibility
You can profit in bullish, bearish, or neutral markets using different strategies.

IPO & SME IPO Trading Strategies1. Understanding IPOs and SME IPOs
A. What is an IPO?
An Initial Public Offering (IPO) is when a private company issues shares to the public for the first time. This transitions the company from being privately held to publicly traded on stock exchanges such as NSE or BSE.
Objectives of IPO:
Raise capital for expansion, debt repayment, or R&D.
Provide liquidity to existing shareholders.
Enhance brand visibility and corporate governance.
B. What is an SME IPO?
SME IPOs are IPOs issued by Small and Medium Enterprises under a special platform like NSE Emerge or BSE SME. They have:
Lower capital requirements (₹1 crore to ₹25 crore).
Minimum application size of ₹1-2 lakh.
Limited liquidity post-listing due to low float and trading volume.
SME IPO Characteristics:
Typically involve regional businesses, startups, or family-run enterprises.
Volatile listings; both massive upmoves and severe falls.
HNI & Retail driven subscriptions.
2. IPO Trading vs Investing
There are two main approaches to IPO participation:
Type Objective Horizon Focus
IPO Trading Capture listing gains Short-Term Sentiment, Subscription, Grey Market Premium
IPO Investing Long-term wealth creation 1–3+ years Fundamentals, Business Model, Financials
Smart traders often mix both: aim for short-term gains in hyped IPOs and long-term holds in quality businesses like DMart, Nykaa, or Syrma SGS (for SME IPOs).
3. Key Pre-IPO Metrics to Track
A. Grey Market Premium (GMP)
Unofficial trading before the listing. High GMP indicates strong sentiment but can be manipulated.
B. Subscription Data
Track QIB, HNI, and Retail bids:
QIB-heavy IPOs → Institutional confidence.
HNI oversubscription → High leveraged bets.
Retail overbooking → Mass interest.
C. Anchor Book Participation
High-quality anchors (like mutual funds, FPIs) validate the IPO’s credibility.
D. Valuation Comparison
Compare PE, EV/EBITDA, and Market Cap/Sales with listed peers to spot under/over-valuation.
E. Financial Strength
Growth consistency, debt levels, margins, and cash flows are critical for long-term investing.
4. IPO Trading Strategies
A. Strategy 1: Grey Market Sentiment Play
Objective: Capture listing gains based on GMP trend and subscription buzz.
Steps:
Track GMP daily before listing (via IPO forums/Telegram).
Apply in IPOs where GMP is rising + oversubscription >10x overall.
Exit on listing day—especially in frothy market conditions.
Example: IPO of Ideaforge, Cyient DLM saw over 50% listing gains using this sentiment-led approach.
Risk: GMP can be manipulated; exit if listing falls below issue price.
B. Strategy 2: QIB-Focused Play
Objective: Follow institutional money to ride solid listings.
Steps:
Check final day subscription numbers:
QIB > 20x: High confidence
Retail < 3x: Less crowded
Apply via multiple demat accounts (family/friends).
Hold 1–5 days post listing if the stock consolidates above issue price.
Example: LIC IPO had poor QIB response → poor listing. In contrast, Mankind Pharma had solid QIB backing → stable listing + rally.
C. Strategy 3: Volatility Breakout Listing Day Trade
Objective: Trade listing day volatility using price action.
Steps:
Wait for 15–20 mins after listing.
Use 5-minute candles to identify breakout/breakdown.
Trade the direction with volume confirmation.
Tools:
VWAP as intraday trend indicator.
RSI divergence for reversal points.
SL near listing price or day’s low/high.
Ideal For: Fast traders using terminals like Zerodha, Upstox, or Angel One.
D. Strategy 4: IPO Allotment to Listing Arbitrage
Objective: Profit between allotment date and listing date when GMP rises.
Steps:
Apply in SME or hot IPOs via ASBA.
If allotted, and GMP rises 2–3x, sell pre-listing via grey market (via IPO dealers).
No market risk on listing day.
Note: SME IPOs have active grey markets.
Example: SME IPOs like Zeal Global or Droneacharya had pre-listing buyouts at massive premiums.
E. Strategy 5: Post-Listing Re-Entry on Dip
Objective: Re-enter quality IPOs after listing correction.
Steps:
If IPO lists flat or down due to weak market, wait for panic selling.
Re-enter when price approaches IPO issue price or support zones.
Use fundamentals + volume profile for entry.
Example: Zomato, Paytm corrected 30–50% post-listing, then rebounded on improved sentiment.
5. SME IPO Specific Strategies
A. Strategy 6: Low-Float Listing Momentum
Objective: Capture momentum due to low float and limited sellers.
Steps:
Identify SME IPOs with issue size < ₹25 crore and float < 10%.
Strong HNI + retail over-subscription + no QIB dilution.
Hold 2–3 days post listing; ride circuit filters.
Warning: Exit when volumes dry up or promoter pledges shares.
B. Strategy 7: SME IPO Fundamental Bet
Objective: Identify potential multi-baggers from new economy SMEs.
Checklist:
Niche business model (EV, automation, D2C, defence).
Revenue CAGR >20% YoY.
EBITDA Margin >10%.
Clean auditor + experienced management.
Example: SME stocks like Syrma SGS, Droneacharya, Concord Biotech became multi-baggers.
Hold Duration: 1–2 years with regular results tracking.
6. IPO & SME IPO Risk Management
A. Avoid Bubble IPOs
Stay away from IPOs with:
Unrealistic GMP vs fundamentals.
Massive dilution by promoters.
Peer valuations show overpricing.
B. Avoid Leverage in SME IPOs
Leverage via NBFC funding in SME IPOs can lead to forced selling.
C. Exit When GMP Crashes Pre-Listing
Sudden GMP collapse = bad sentiment/news. Exit if listing turns risky.
D. Avoid Penny SME IPOs
New SEBI rules aim to stop manipulation, but penny stocks still see pump-and-dump schemes. Check:
Past promoter frauds.
Unrealistic financials.
Low auditor credibility.
Conclusion
IPO and SME IPO trading isn’t just about luck or hype—it’s about data-driven decisions, sentiment analysis, technical timing, and smart risk control. With the right strategies, traders can enjoy quick gains, while long-term investors can spot future market leaders early.
Key Takeaways:
For short-term listing gains, focus on GMP, subscription trends, and QIB interest.
For long-term wealth, choose fundamentally strong IPOs with scalability.
In SME IPOs, look for low-float momentum or niche growth companies.
Always apply with discipline, avoid chasing every IPO.
Buy on Dips | 4H timeframeBitcoin seems to have completed the formation of triangle and entered into an upward move.
The SL for this study would be price entering the price range of 111,700.
Profit could be booked on the marked Fibonacci levels (darker the color, more important the resistance level)

BTC BUY PLAN - 4HR BULLISH SETUPBitcoin is currently showing signs of strength on the 4H chart, with a bullish shift in structure forming around a key Order Block (OB).
I’m tracking the following plan:
🟢 Buy Zone
114,000 – 113,500
This zone is built around a 4H OB + fractal structure shift. A bullish reaction here could trigger continuation.
Stop Loss (SL): 112,000
🎯 Targets
TP1: 116,500
TP2: 117,500
These levels align with liquidity above recent highs and prior inefficiency zones.
📌 Trade Idea
The 4H chart trend is bullish, and the structure has shifted in favor of buyers. However, confirmation from price action is key before entering.
Patience is important — wait for the price to respect the buy zone and signal strength.
⚠️ Disclaimer: This is for educational purposes only, not financial advice. Always use strict risk management.

[LONG] BTCUSDT - Wave 5 Elliott Wave forecast 🧠 Technical Analysis Summary (Elliott Wave Perspective)
✅ Pattern Structure Observed:
Wave 1–2–3–4 appears to be complete or nearly complete.
The current price action suggests we are potentially entering Wave 5, following a successful Wave 4 correction.
The chart shows:
A bullish flag/channel breakout.
A well-respected parallel rising channel, hinting Wave 5 is forming.
EMA support (purple line) is holding.
Volume remains relatively low but stable.
📈 Wave 5 Forecast:
Target: Near 136,824 (as marked on your Fibonacci level 1), aligning with the upper boundary of the channel.
Launch Zone: Around 112,060, where Wave 4 likely ended (Fibonacci 0).
Price Projection: Wave 5 can reach or slightly overshoot the upper resistance of the yellow rising wedge.
🧭 Indicators:
Volume: No large spike yet — if a breakout begins, look for a confirming volume surge.
RSI (bottom indicator): Currently neutral. No extreme overbought/oversold — leaves room for upward movement.
🧮 Elliott Wave Count (Annotated):
Wave 1: Start of May to mid-May
Wave 2: Mid-May to late May pullback
Wave 3: June rally into mid-July
Wave 4: Late July correction (falling wedge/bull flag)
Wave 5: Aug–Sep potential move up, projected in red arrow
🔔 Things to Watch:
Break above the mini wedge (Wave 4 flag) is critical.
RSI divergence near the top of Wave 5 could signal exhaustion.
Volume confirmation will help validate a true breakout.
Channel support/resistance should be monitored closely for invalidation.

BTCUSD buy and sell both target hit now sell on rise Bitcoin sell given at 1185000 booked near 113200 , again buy given at 112900 and booked at 115300 ,
Yesterday again sell given at 114900 booked at 112700 now not holding any trade .
Sell on rise near resistance area

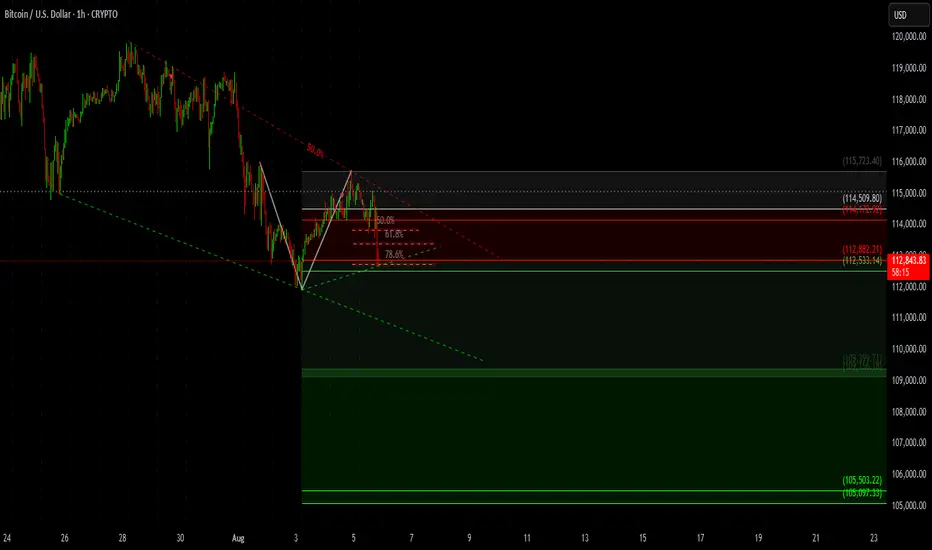
Bitcoin Analysis – 1H ChartBearish Pennant forming — price is consolidating within a descending triangle/pennant after a sharp drop, indicating a possible continuation.
🔺 Key Resistance Zones:
$114,509 – $114,742 (marked with dark red zone)
Fibonacci 50% – 61.8% levels aligning with this resistance zone
🔻 Support Zones:
$112,533 (current 78.6% fib retracement acting as intraday support)
$109,320 – $108,720 (potential bounce zone)
$105,503 – $105,097 (final bearish target if breakdown continues)
📐 Fibonacci Retracement Levels
Price retraced to 50%–61.8% and is now testing lower levels.
Breakdown from this region confirms bearish pressure.
📈 Bias: Bearish below $113,000
📉 Next Potential Target:
Short-term: $109,300
Medium-term: $105,000
💬 Conclusion: BTC is showing weakness after a failed breakout and rejection from fib resistance. If $112,500 breaks, expect acceleration toward $109K and possibly $105K.
Bitcoin short-term correction over?#Bitcoin getting rejected at upward trendline (blue) as well as at 20DEMA (pink) isn't good news for bulls. For it to end its correction and resume the uptrend, BTC has to close above $115,800 on the daily chart, sooner than later.
Bitcoin next movement update If price closed above that level and sustain here after some positive priceaction from that level we can expect new buying from here...

BTC NEXT MOVE FOR INTRADAY 🟠 BTC/USD – Both Side Opportunity Ahead
Bitcoin is currently consolidating within a tight range, and price action is offering opportunities on both sides depending on confirmation. Let’s break it down:
🔹 Bullish Scenario
✅ If BTC breaks above 114,750, wait for a retest of this level.
🟢 Entry: On successful retest above 114,750
🎯 Potential Upside: Towards the 116,000 – 116,500 zone initially
🔒 Stop Loss: 113,900
🔹 Bearish Scenario
⚠️ BTC is approaching a strong Sell Zone between 116,510 – 117,140
🔴 This area aligns with previous supply + rejection points
📉 Possible Short Entry: Within 116,510 – 117,140, only if confirmation appears
🔒 Stop Loss: 117,500
📊 Key Notes
This is not an A+ setup, but structured for traders who adapt both sides.
Confirmation is absolutely important — don’t jump in without strong displacement and retest.
Always follow risk management and avoid over-leverage.
📌 Final Thought
BTC is showing mixed signals — the key will be how it reacts around 114,750 on the upside and 116,510 – 117,140 on the supply side. Traders should stay flexible and wait for confirmation before positioning.
👉 What’s your bias right now — Bullish above 114,750 or Bearish from 116,500+? Share your thoughts below!
⚠️ This is a market observation for educational purposes, not financial advice.

BTC-USD Price Analysis!This analysis, using MACD and EMAs, aims to predict the price of BTC in the near term as well as in the coming years.

Resistance Breakdown Expected in BTCUSD Bitcoin is currently testing a key resistance level around $114,976, which previously acted as a strong rejection zone. The price has shown a breakout attempt with minor consolidation just above the resistance, suggesting a possible shift in market structure.
📌 Chart Insight:
Price has broken above a well-tested resistance level.
Consolidation near the breakout zone could indicate accumulation before a continuation move.
Risk-to-reward setup is visible with clearly defined stop-loss and target levels.
📈 Trade Bias:
If BTC sustains above this resistance-turned-support zone, we could expect bullish momentum to follow. However, a failure to hold above may invalidate the breakout, leading to a possible pullback.
🕒 Timeframe: 15-Minute
⚠️ Always use proper risk management and monitor the price action near critical levels.

BTCUSD 1H Breakdown Alert!Bitcoin just broke below a triangle pattern after consolidating near the $114,800 resistance zone.
🔻 Key Levels:
Resistance: $114,795 & $115,004
Support Zones:
First: $113,878
Second: $113,249 → $113,179 (Strong demand zone)
⚠️ Price is now trading below the triangle support, showing bearish momentum. A retest of $114,456–$114,516 could act as rejection for further downside.
📌 Bias: Bearish unless BTC reclaims $114,800+
🎯 Next Targets:
$113,878 (mid support)
$113,250 → $113,180 (major liquidity zone)
🕒 Keep an eye on the next few candles for confirmation.
#BTC #Bitcoin #CryptoAnalysis #PriceAction #BTCUSD #CryptoBreakdown #BearishSetup
