BTC Update - Bears are comingIn reference with previous post.
Price dropped from your level of 61-70% zone and broke to new low, price has made a 5 wave downside to make a possible wave and wave 2 is looks like complete at 100741 level and new low of 93270 is possible inner wave of wave 3, which is 100% from high of wave 2, is it can be a wxy irregular correction of is being completed at 99189.
Internal pattern of Irregular wxy looks like wave A has completed at 98949 but going through internal pattern of A we see a sharp move from bottom to 98042, and we have 3 move upside from there to 98949, and irregular C ending at 97599, B looks like completed here and C resume upside and ended at 99144, which is 100% of A to B. Y of C is slow and sluggish but get to the target.
So we can expect another move down to lows, if price breaks to upside, it can a start a complex correction.
That my study
BTCETH.P trade ideas

Bitcoin EW updateIf I try to label to it Via green count ,price has dropped from high of 102433 and retraced almost to from the point wave 2, 50% retracement in price from high creates doubts, as it doesn’t happen often in impulsive moves.
If I try to label is according other way, wave 3 end near 123% and wave 5 doesn’t even cross 61.8% which is mandatory in case of non extended wave 3, than this case entire pattern will be corrective, and correction means fall below 91266 low.
If it is corrective and converts into that pattern than we will be looking to short on confirmation of candle pattern and other strategies at level 1- 99690 and next level 100741.
I am not Sebi registered analyst.
My studies are for educational purpose only.
Please Consult your financial advisor before trading or investing.
I am not responsible for any kinds of your profits and your losses.

15 min tf analysis BTCUSDHello traders another day with another analysis here as we can see in 15 min tf BTC is forming lower lows lower highs unable to hold the gains so there is two trade scenarios 1) for safe traders short BTCUSD below 97700 with SL:-98300.5 and tp:-97073.4 favourable risk reward ratio 2) for risky traders short BTCUSD at 97700 with SL :-98985.5 and tp:- 96500-96000 lvl. Safe traders book profits timely if you get 1:1 RR AND TRAIL YOUR SL FOR GOOD GAINS. Have a profitable day. This is my personal view do your own research before taking any trades. For education purpose only. I reserve the right to be wrong.

BTCUSD 15 MIN ANALYSIS Hello traders another day with another analysis here as we can see in 15 min tf BTC is forming lower lows lower highs unable to hold the gains so there is two trade scenarios 1) for safe traders short BTCUSD below 97700 with SL:-98300.5 and tp:-97073.4 favourable risk reward ratio 2) for risky traders short BTCUSD at 97700 with SL :-98985.5 and tp:- 96500-96000 lvl. Safe traders book profits timely if you get 1:1 RR AND TRAIL YOUR SL FOR GOOD GAINS. Have a profitable day. This is my personal view do your own research before taking any trades. For education purpose only. I reserve the right to be wrong.

Bitcoin Bybit chart analysis February 3Hello
It's a Bitcoinguide.
If you have a "follower"
You can receive comment notifications on real-time travel routes and major sections.
If my analysis is helpful,
Please would like one booster button at the bottom.
This is the Bitcoin 30-minute chart.
Nasdaq indicators will be announced at 12 o'clock soon.
The Nasdaq variable and the Bitcoin weekly chart MACD dead cross are in progress, so the analysis difficulty is high.
I had a hard time finding the entry point and the stop loss price.
It will be hard, but let's hold on this week.
Also, if it falls from the current position,
Nasdaq will have a vertical decline condition, so you have to be careful.
In the case of Tether Dominance, there is no resistance line yet,
so if it doesn't crash all at once, it can be shaken by a short-term wave.
I created today's strategy focusing on this part.
* When the blue finger moves,
It is a two-way neutral
Short->Long switching or long position waiting strategy.
1. 96,413 dollars short position entry section / when pink resistance line is broken
or when section 1 is touched, stop loss price
2. 95,120 dollars long position switching / when purple support line is broken
or when section 2 is touched, stop loss price
3. 99,612 dollars short position switching / when red resistance line is broken
or when Good section is touched, stop loss price
96.4K short position at the top from the current position
If the entry point is not touched
Long waiting at section 2 below / stop loss price when green support line is broken.
Section 1 at the top is a sideways market
It is the second short position entry section of today.
The final long position target and
short position switching section that I expect
is the center line of the 4-hour Bollinger Band chart.
It is expected to be around the top section,
and if it rebounds to this section,
the weekly chart MACD dead cross will be released,
so you can press it again.
There are two conditions for the dead cross to be imprinted:
it is pushed to 86.5K at the bottom (major support line)
or it is imprinted naturally while moving sideways.
It won't be easy to break through all the resistance lines at once with a vertical rise
and touch the Bollinger band resistance line, right?
Of course, it is possible if the Nasdaq goes crazy while soaring.
This week, it can continue to shake while moving sideways,
and it doesn't look easy to see an upward trend,
so short-term trading seems advantageous.
I marked 89,853.5 dollars below the bottom,
and since it is a section where a newly created mid-term upward trend is maintained,
it seems safe to just hold this spot this week.
Above all, the Nasdaq movement is the most important,
so check it in real time.
Up to this point, I ask that you simply use my analysis for reference and use only.
I hope that you operate safely with the principle of trading and cut-off price.
Thank you for reading.

BTCUSDBitcoin is currently trading below the neckline of a bearish Head & Shoulders pattern. The resistance level is at 99,600, while key support levels are at 96,000, 95,000, and 92,000.

BTC in wave 2 in larger wave 5Bitcoin is in wave 5 in that subwave2 is running 94500 to 96500 is best zone for 130000 target

Bitcoin updatesAfter making Low of 91226 price bounced impulsively, it was bound to happen due to extended 5th wave, now making a structure on impulsive nature and 1-2 is complete and 3 is undergoing or about to complete, I have marked 1 at 94915 an wave 2 is running correction-wxy, it also gives an impression of 1-2-1-2 but its inner count doesn’t allow, so wave 3 started from 94150 and its 200% extention is a 101,715 and now in a corrective mode, we can expect a correction for wave 4 in the range of 23-38% and than for 5th wave. Since wave 3 is extended wave 5 has to only a new high and break of 38% to the upside for complete impulse.
There was a mid point where price rested a bit 99462 and continued upside move,it wasn’t even 161.8 of 3, so ignored and if it will the end of three than price must not break 100441 level to downside in current correction is 5th wave needs to make a high 103063 to complete the impulse.

BTCUSD Analysis on (03/02/2025)BTCUSD UPDATEDE
Current price - 94200
If price stay above 89000,then next target 97800,104000 and below that 86000
Plan; if price break 94000-93000 area and above that 94500 area,we will place buy oder in BTCUSD with target of 97800 and 104500 & stop loss should be placed at 89000

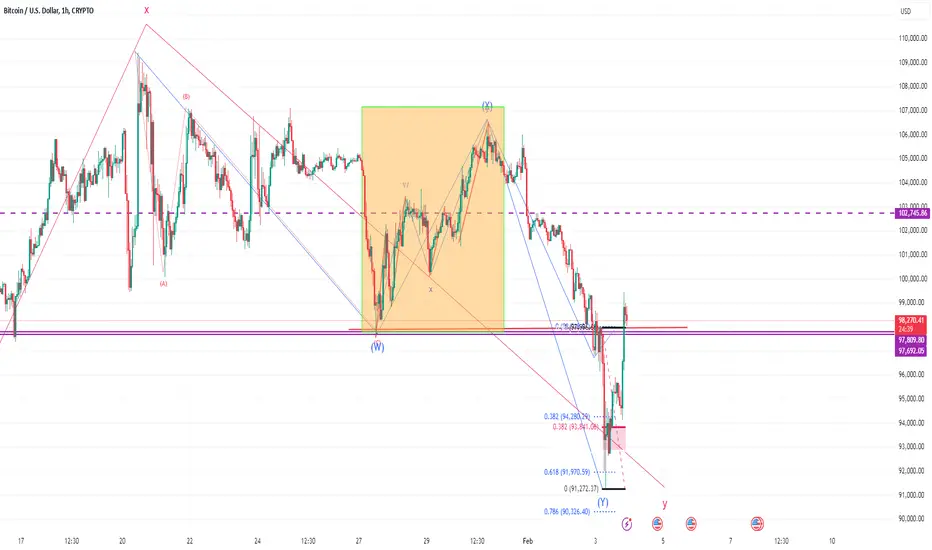
Bitcoin UpdateAs explained earlier, structure in shade was looking like, LD but it turnout to be WXY and broke below the low of entire LD. Over all pattern turned Higher degree WXY and an inregular correction in 4h Time frame. It looks more complex .
In WXY pattern Y usually is Simple zig zag means two moves to the downside.
1 is complete and it may take some time and make intermediate high and turn lower for another lower low.
Now it has completed the move down and broken the 38% of last move and provided an implusive move which we were expecting case of LD.
Bitcoin Bybit chart analysis january 31
Hello
It's a Bitcoinguide.
If you have a "follower"
You can receive comment notifications on real-time travel routes and major sections.
If my analysis is helpful,
Please would like one booster button at the bottom.
This is Bitcoin's 30-minute chart.
There will be two Nasdaq indicators released at 10:30 in a little while.
There is a gap section at the top and bottom of Nasdaq,
so it seems likely that it will shake once.
Bitcoin has MACD dead cross pressure on the 4-hour chart.
I created today's strategy by comparing it to Tether Dominance.
*When the blue finger moves,
Bidirectional neutral
Short->Long switching, or long position waiting strategy
1. $104,641.5 short position entry section / Orange resistance line breakout, stop loss price
2. $103,12 long position switching / Green support line breakout, stop loss price
(If it comes down right away, 104.6K is the long position waiting section, same stop loss price)
3. $106,943 long position 1st target -> Target price in order
To ignore the 4-hour chart MACD dead cross,
The condition is that it touches the 1st section or more, the 4-hour chart resistance line of the Bollinger Band.
If not,
It should be imprinted while moving sideways until 9, 1, and 5 o'clock when the 4-hour candle is created,
and I created a strategy based on that.
The first section at the top is a sideways section / the blue support line at the bottom is
an upward trend line from a mid-term perspective.
If the green support line breaks,
you should be careful because it can go down to Bottom -> 2 at once.
I'm not in good condition today,
so I'll finish here and go in.
Please use my analysis so far as a reference and only
I hope you operate safely with principle trading and stop loss prices.
Thank you.

BTCUSD - HEADED LOWER?Symbol - BTCUSD
BTCUSD is currently encountering substantial resistance, with the price being significantly repelled from the 105-107K zone, establishing a strong resistance area. However, this resistance does not yet negate the broader bullish outlook in the market. A complex market structure is unfolding, characterized by both a descending channel and a symmetrical triangle pattern. The interpretation of these formations will depend largely on how market participants perceive them. A potential reaction to the support of the symmetrical triangle could result in a brief rebound; however, considering the prevailing resistance levels, it is anticipated that this rebound will be shallow, with the price likely attempting to move lower.
Looking at the descending channel, the price is currently supported by a key level at 1,01,600 which is crucial in preventing further declines. This level will play a decisive role in determining the near-term price action. The primary uncertainty lies in whether this support will hold or be breached.
On a fundamental level, the situation remains uncertain and largely dependent on developments in the United States, particularly regarding how political figures, including former President Trump, address cryptocurrencies. This could manifest in various ways: as a bubble, a strategy to influence elections, or simply as rhetorical posturing. Alternatively, it could reflect a genuine, coherent policy direction.
Resistance levels: 1,03,500 - 1,05,800
Support levels: 1,01,600 - 99,600
The 1,01,600 level remains the focal point. In the short term, a potential breakdown below this level followed by price consolidation could lead to a decline to the 100-97K range. However, given the presence of the symmetrical triangle, a false breakdown of 101.6K could trigger a brief upward bounce before a subsequent decline towards the 100K level.

Bitcoin Breakout from Bearish Channel – Potential Reversal PlayBitcoin has broken down from a descending channel, leading to a strong bearish move. The price has reached a critical support zone, where a potential reversal or a deeper drop could occur.
Technical Analysis:
The price has decisively broken below the lower boundary of the bearish channel.
A strong bearish momentum has pushed Bitcoin toward a key support level around $93,000.
If the price holds above this level, a bounce towards the $106,000-$107,000 resistance area is possible.
However, failure to hold support could result in further downside towards $91,500 or lower.
Trade Setup:
Entry: Around $93,800 (current price level)
Stop Loss: Below $91,500
Target: First target $106,000, extended target $110,000 for a high-risk reward play.
Conclusion:
Bitcoin is at a critical decision point. Bulls need to defend the support zone to confirm a reversal, while bears might push further downward if the breakdown continues. Traders should watch price action closely at this level and adjust risk accordingly.

BITCOIN DECIDED LOW FOR TODAYIt look like BITCOIN decided it's low for next 2-3 days,Here i marked support and resistances which will help you to take decision red as resistance green as support,But keep inmind it's not my buy/sell call only view is here.

BTCUSDT TRDAING POINT UPDATE > READ THE CHAPTIAN Buddy'S dear friend 👋
SMC Trading Signals Update 🗾🗺️ crypto Traders SMC-Trading Point update you on New technical analysis setup for crypto BTC USDT crypto currency 💲 crypto Traders BTC
USD ready for. A New. ATH that month Technical patterns support and Resistance level 🎚️ Look good bullish trend 📈 114k don't dare qt Hit but soon 🔜😁
Key Resistance level 106k + 107k + 109k + 114k
Key Support level 97222 - 94219 - 92105 - 89219
Mr SMC Trading point
Pales support boost 🚀 analysis follow)

BTCUSDENTRY TARGET SL Mention in the chart.
ALWAYS TAKE TRADE WITH CONFIRMATION
Note : Trading in any financial market is very risky. I post ideas for educational purpose only. It is not financial advice. Do not hold us responsible for any potential loss you may incur. Please consult your financial adviser before trading.

Bitcoin long term chart sell 92700,86200 downside Target sell How to take trades using Harmonic pattern projection Trade setup is explained below :-
1st D point : 0% is recent top or bottom.
2nd D Point : 13.5% is work as trailing SL of buy or sell trade if hit then we have to book profit
.If price goes below 13.5% then early or risky traders can reversal trade ,
Safe traders can wait for 27% levels break
Targets :
Target T1 is 27.3% if you are taken entry from 13.5% if taken entry from 27.3 then Target T1: 38.2 % level is our 1st Target
( 38.2% if also a reversal zone so if price reverse then we can make fresh entry also).
T2: 50% level is our 2nd Target
T3: 61.8% to 65 % is our 3rd Target
( This is also reversal zone so we have to book profit at this area and if break then take fresh entry with SL of 2nd Target 50% .)
Next Targets are 78.6 % , 88.9 % 100% , 113.5 % , 127.2% , 141.5% and 161.8% to 165%.
161.8 to 165% if profit booking area so book full profit and wait for reversal.
How to take reversal trade :
If price going upside/ downside then then buy or sell levels appear on Chart ( Automatically show when price reach any reversal zone of harmonic projection pattern based .
After showing reversal levels wait for confirmation until 13.5 % or 27 .6 % level not break if break then exit from current buy / sell trade and take fresh reverse trade buy/ sell .
Trailing SL:
After reach 1st Target trail SL to just above or below cost ( for example we are holding sell trade from 100 1st Target 110 hit then move trailing sl to 104-105 and move SL as price move upside or Downside)
Blue Line is 1st support/ Resistance
Green line is 2nd support/ resistance
Red line is 3rd Support/ resistance

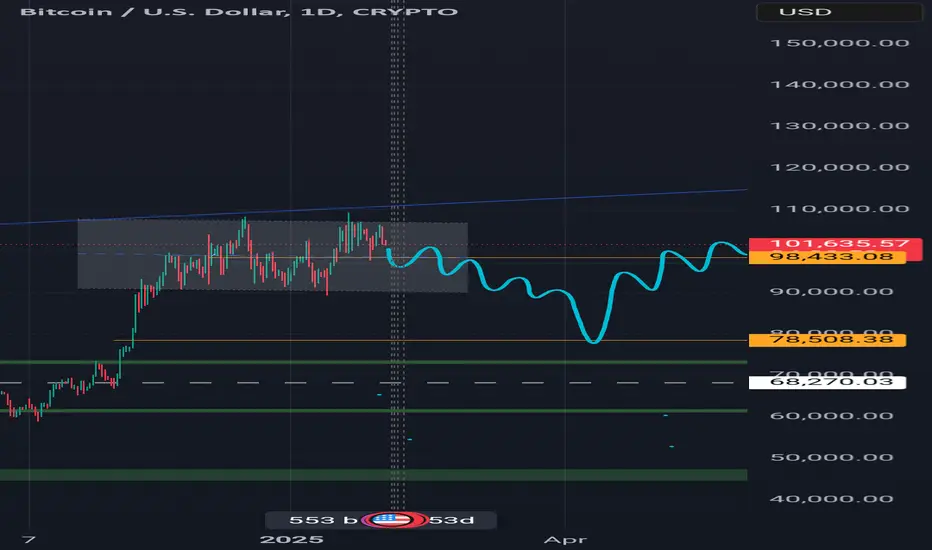
Btc q1 of 2025 outlook and forecast by lokendra Bitcoin Q1 2025 Outlook: Potential Dip Before a Strong Rally
Bitcoin is currently trading at $101,500, but a significant correction may be on the horizon. Based on market trends and technical analysis, Q1 2025 could see a bearish phase before a strong recovery.
One of the key factors influencing this prediction is the CME gap around $78,000, which remains unfilled from previous price movements. Additionally, trendline support sits around $74,000, making it a critical level to watch. Given the prevailing sell-side pressure, Bitcoin could gradually bleed downward, testing these levels before a meaningful recovery.
However, after reaching these support zones, a strong rebound could follow. If the U.S. markets remain strong and macroeconomic conditions support risk assets, Bitcoin could potentially rally to $180,000 later in the year. The price action is likely to be volatile, with short-term recoveries occurring amid the broader downtrend.
Overall, Q1 2025 may present an opportunity for long-term investors looking to accumulate at lower levels before Bitcoin resumes its upward trajectory. Traders should remain cautious, as sharp moves in both directions are expected. Monitoring market trends and key support levels will be crucial in navigating this volatile period.
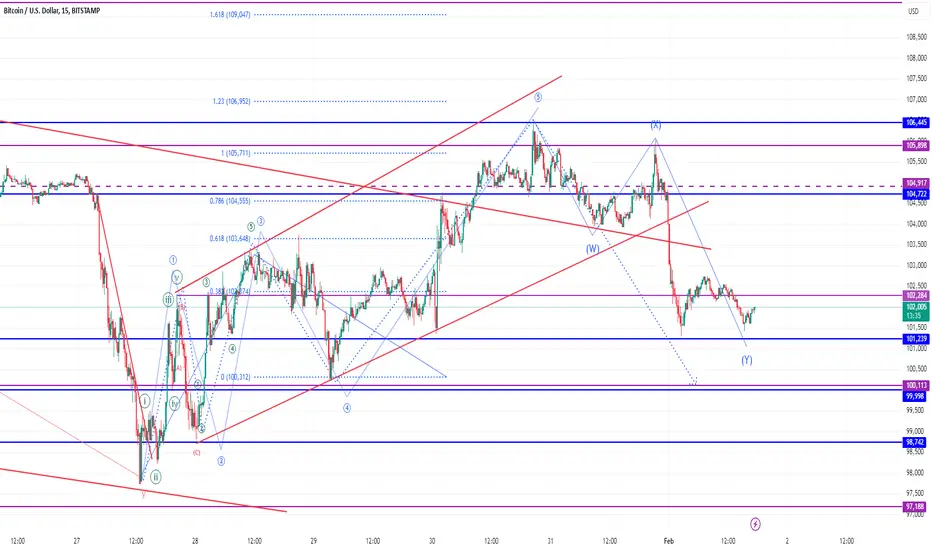
BTC EW Update 01-febIn reference to my earlier post,
As I mentioned in my analysis it Can be a Leading diagonal structure.
It has turn out almost the same. Under the rules of LD wave 4 is overlapping wave 1 and and wave 3 is not extended and wave 5 is more than 61.8% hence extended and move from wave 5 to downside as 3-3-3 WXY correction has broken the trendline as normally happens with the LD and now we are looking for completion of wave Y and than break out 38.2% of last fall and long for next upside. Invalidation point is break of low of 1.
Than this structure will turn out in Triple Zigzag.
BTCUSD SHOWING A GOOD DOWN MOVE WITH 1:7RISK REWARD BTCUSD SHOWING A GOOD DOWN MOVE WITH 1:7 RISK REWARD
DUE TO THESE REASON
A. its following a rectangle pattern that stocked the market
which preventing the market to move any one direction now it trying to break the strong resistant lable
B. after the break of this rectangle it will boost the market potential for break
C. also its resisting from a strong neckline the neckline also got weeker ald the price is ready to break in the outer region
all of these reason are indicating the same thing its ready for breakout BREAKOUT trading are follws good risk reward
please dont use more than one percentage of your capitalfollow risk reward and tradeing rules
that will help you to to become a bettertrader
thank you

BTC TRADE IDEA how btc chart works in Coming some time but BTC Bulish in consolidated zone. monday btc revesre in bullish trend

(Lunar New Year Special) Bitcoin Bybit chart analysis january 24Hello
It's a Bitcoinguide.
If you have a "follower"
You can receive comment notifications on real-time travel routes and major sections.
If my analysis is helpful,
Please would like one booster button at the bottom.
Bitcoin 4-hour chart
This is the main drawing section.
It seems to have taken about 2 and a half hours just to draw it.
The section where the flag is marked is the section where the daily chart is created,
and the last flag is January 31st, when the holiday ends.
This week, there has been absurd and bizarre repetition of
unasked rises and unasked falls.
The reason is that after the report was updated,
as I explained in detail in the last video,
it is right before the bitcoin price skyrockets.
Based on the Bollinger Band weekly chart, it is important to see whether the resistance line is touched first
(a major rise)
and whether the MACD dead cross on the weekly chart
will occur first,
and adjustments and sideways movements will occur.
Based on that, if you look at the high and low points on the right,
I have indicated the prices.
At the very top, 117,182 dollars touches the weekly chart resistance line,
moving towards a mid-term upward trend
If 99,703 dollars at the bottom is broken first,
it will be the place where the weekly candle low is broken.
It would be bad if the two light-colored sky-blue support lines I drew were broken.
Because it is the place where the sideways movement and support line are broken,
I calculated the main section, so
I think it would be good to refer to it.
This is a 30-minute chart of Tether Dominance moving in the opposite direction of the beat.
Today, in terms of the pattern,
it touched the 5-minute and 15-minute resistance lines,
and the 30-minute chart resistance line section order.
I carried out a short position strategy in the sky blue finger section/strong downward section.
In the case of Tether Dominance,
the 6-hour chart and 12-hour chart MACD dead cross are currently in progress.
I applied it to Bitcoin as is.
Here is the Bitcoin 30-minute chart.
There is a Nasdaq indicator announcement at 12 o'clock tonight.
The Nasdaq is in the process of a 6-hour MACD dead cross,
and I judged that this section is not very dangerous.
The short-term pattern is still alive,
and the MACD golden cross is imprinted on the weekly chart,
and even if there is a strong adjustment in Nasdaq,
since the 1+4 rising pattern is waiting,
I focused on the rise and proceeded with the strategy.
*One-way long position strategy when the red finger moves
1. $104,740 long position entry section / stop loss price when the green support line is broken
2. $109,231.5 long position 1st target -> target price in order from the top
Based on the Tether dominance movement and the Bitcoin pattern,
I focused on the rebound from the 30+1 pattern.
Up to the first section, it is a sideways movement, and from the top section, it is a new record, and if it reaches this point, it will continue to rise significantly.
In preparation for a strong adjustment in Nasdaq,
I maintained the stop loss price for the 30-minute support + 1-hour support of the second section, which is marked as the final long position waiting section.
If it touches the bottom section today,
It is not good because the daily chart low is broken.
If it falls to 101.4K at the very bottom,
Pay attention to the 6+12 pattern that was not recovered yesterday.
Basically, if it comes down to this section,
It is not good because the center line of the 12-hour Bollinger Band chart has been touched several times,
and the support line of the 6-hour chart is also open.
Please refer to the final support line explained at the mid-term point at the top.
Today, I explained it in detail for the first time in a while,
and I did my best to analyze a week's worth,
I hope it was helpful for your actual trading.
Up to this point, I ask that you simply use my analysis for reference and use only
and I hope that you operate safely with principle trading and stop loss prices.
Since it's a long holiday,
don't just look at the charts,
and I hope all my followers have a good time with their families next week on Lunar New Year.
Happy New Year.
Thank you always.
