BITCOIN - LIKELIHOOD OF A SHORT SQUEEZE BEFORE A DOWNWARD SLIDESymbol - BTCUSD
CMP - 84540
BTCUSD continues to exhibit a bearish trend after breaking the bullish structure on the weekly timeframe. There are no discernible bullish drivers at present, and from a technical standpoint, the price is poised to approach the imbalance zone between 75K and 73K.
Recent events, such as the crypto summit and discussions surrounding crypto asset support, have failed to provide substantial backing for the market. These events have historically been followed by further market declines.
From a technical perspective, the market remains in a downtrend, indicative of a global counter-trend. This suggests that the current price movement is contrary to broader market sentiment, which aligns with typical market behavior. On a general scale, key zones of interest include 75K, 73K, and the order block between 69K and 66K.
On a more specific level, attention should be given to the nearest liquidity zones at the higher levels, which may be tested prior to any further declines. These levels are located at 86,697 and 89,397
Key Resistance levels: 85135, 86678, 89397
Key Support levels: 79987, 78173, 73512
Following the false break of the 78K support level, there has been no significant market reaction. The market appears to be consolidating within the 84-85K range, which suggests a weakening of buying interest. Prior to any further downward movement, there may be a short squeeze within the identified liquidity zones, potentially leading to an additional decline.
Trade ideas

Bullish Reversal Trade Setup for BTC/USD – 4H Chart AnalysisZone: Around 76,094 USD
This zone aligns with a demand/support area, highlighted by the purple rectangle.
Price has sharply dropped into this zone, suggesting a potential reversal or bounce opportunity.
⛔ Stop Loss
Level: Around 73,312 USD
Placed below the support zone to allow some volatility wiggle room.
A break below this could invalidate the bullish setup.
🎯 Target Point (Take Profit)
Level: 87,271 USD
Risk-to-reward ratio is approximately 1:3+, offering solid trade potential.
This level corresponds to a previously established resistance zone or supply area.
📊 Indicators
EMA 50 (red): ~82,106 USD
EMA 200 (blue): ~85,250 USD
Current price is below both EMAs, suggesting short-term bearish momentum, but this setup banks on a mean reversion or swing back up.
📈 Trade Idea Summary
Parameter Value
Entry 76,094 USD
Stop Loss 73,312 USD
Take Profit 87,271 USD
Risk/Reward ~1:3
Setup Type Bullish Reversal
🧠 Extra Notes
Wait for confirmation (candle reversal pattern) in the demand zone before entering.
Be cautious of fake-outs or breakdowns below support, especially with broader market weakness.

Bitcoin Bullish IdeaI'll be buying for that point of interest 78544.71 if I see confirmation for reversal.
Though H8 zone 79100.20 looks valid too as the price has triggered it and rejects it awesomely.
My projection is this new week is going to be Bullish not just for Bitcoin but some other. Crypto pairs too.

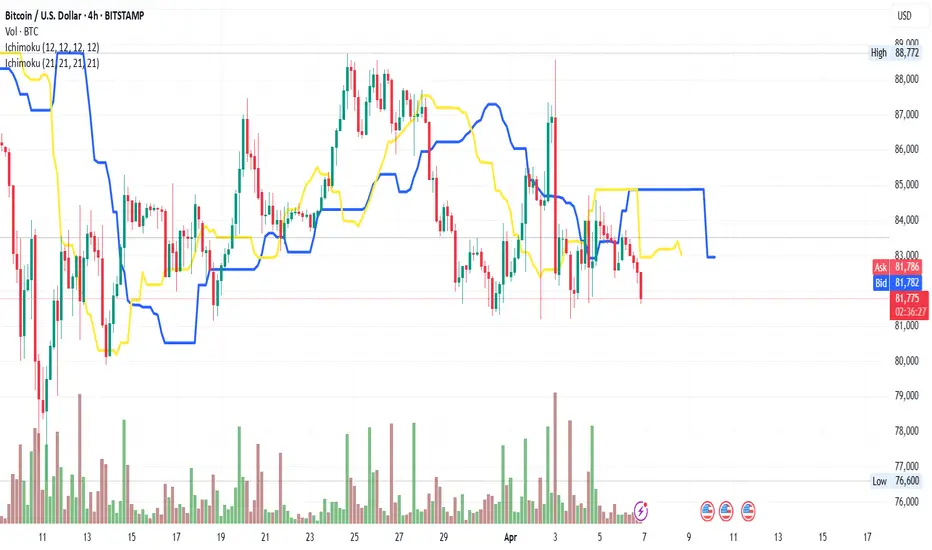
Using Ks Indicator of Two ichimokusUsing ichimoku to identify trend. works well for shorting as also going long. Cross over marks rise and fall, depending on time frame crossings.
BTCUSD SHOWING A GOOD DOWN MOVE WITH 1:10 RISK REWARD BTCUSD SHOWING A GOOD DOWN MOVE WITH 1:5 RISK REWARD
DUE TO THESE REASON
A. its following a rectangle pattern that stocked the market
which preventing the market to move any one direction now it trying to break the strong resistant lable
B. after the break of this rectangle it will boost the market potential for break
C. also its resisting from a strong neckline the neckline also got weeker ald the price is ready to break in the outer region
all of these reason are indicating the same thing its ready for breakout BREAKOUT trading are follws good risk reward
please dont use more than one percentage of your capitalfollow risk reward and tradeing rules
that will help you to to become a bettertrader
thank you

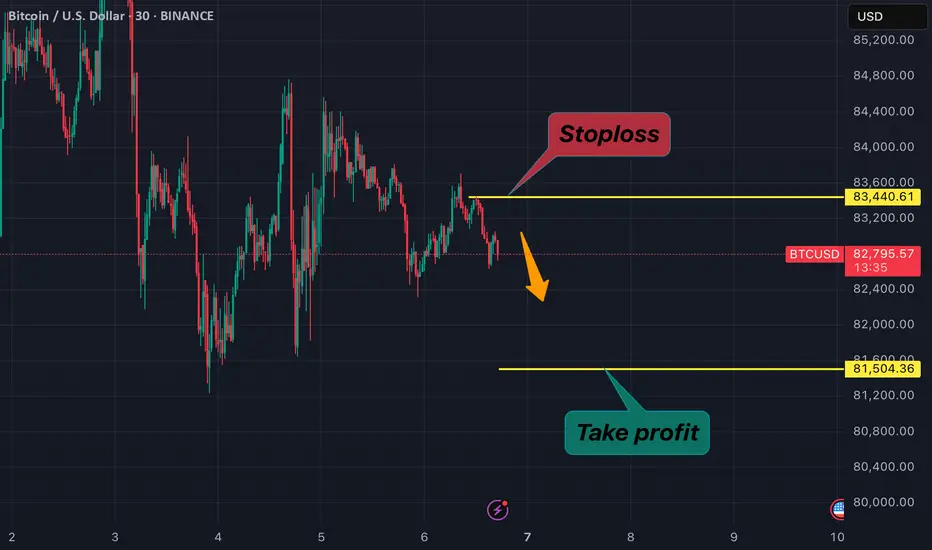
Sell Bitcoin Now!!!The price broke through the resistance zone and began to weaken, showing no growth momentum. The 83,000 area was breached along with the moving average line
Stoploss and Take profit in this pictures
Good luck all!!!
Bitcoin buy near 82k huge buying now will blast upside as covid How to take trades using Harmonic pattern projection Trade setup is explained below :-
Entry : 1st SL point : 0% is recent top or bottom.
Trailing D: 11.4% is work as trailing SL of buy or sell trade if hit then we have to book profit
.If price goes below 2nd D 21.4% to 23.6% range then early traders can make fresh reversals trade after breaking 1st D 11.4% safe traders can reversal trade after breaking Point D 21.4% to 23.6% range
Targets :
Target T1 : 35.1% to 38.3%
Target T3 : 49.1% to 53.2%
T3: 60.9% to 64.8% is our 3rd Target since this is reversal zone so must book profit if break then take fresh trade again
Target T4 : 76.4% to 79.7%
Next Targets are 100% , 127.2% ,141.4% and final Target 161.8%.
How to take reversal trade :
If price going upside/ downside then then buy or sell levels appear on Chart ( Automatically show when price reach any reversal zone of harmonic projection pattern based .
After showing reversal levels wait for confirmation until 21.4% or 28.3 % level not break if break then exit from current buy / sell trade and take fresh reverse trade buy/ sell .
Trailing SL:
After reach 1st Target trail SL to just above or below cost ( for example we are holding sell trade from 100 1st Target 110 hit then move trailing sl to 104-105 and move SL as price move upside or Downside)
Re- Entry :
For Re-entry in any pull back Point D ( 11.4% ) is used for re-entry then SL recent high or low Point SL ( 0% ) .
Blue Line is 1st support/ Resistance
Green line is 2nd support/ resistance
Red line is 3rd Support/ resistance

BITCOIN REVERSAL SOON!!!On the daily chart of bitcoin a trend line can be seen to which bitcoin is quite respectful by not breaking through resistance or support of its either.This indicates if price bounces off the support line there might be a reversal leading prices upto 115000 to 117500,a new higher high considering the previous demand levels.
If the price beaks the trendline we might see more bearish movement.
DISCLAIMER;this analysis was just for educational purpose and no recomendation of buy or sell.

Btc Current Posible scenario
Please note that cryptocurrency markets are highly volatile, and prices can change rapidly. It's advisable to consult multiple sources and stay updated with the latest market trends before making any investment decisions.

How Algo Bots Target Retail SL – Learn to Beat Them!Hello Traders!
Have you ever seen your stop-loss get hit by just a few points and then the market moves in the direction you expected? That’s not a coincidence — it’s often the work of Algo Bots and big players trying to trap retail traders . These bots are designed to trick traders by moving prices to hit SLs before starting the real move.
Let’s understand how these bots work — and how you can avoid getting trapped.
How Algos Hunt Retail Stop-Losses
They Target Common SL Zones:
Algo bots look for areas where many traders place their stop-loss — like just below support or above resistance.
They Trick with Fake Breakouts:
You may see a fast move above or below a level — but it’s just to hit SLs and then reverse. This is called a stop hunt .
They React Fast:
Bots can place thousands of trades in a second. They use their speed to catch traders off guard.
How to Beat the Bots – Pro Tips
Avoid Obvious SL Levels:
Don’t keep SL right at support or resistance. Place it a little beyond where bots won’t expect it.
Use Structure-Based SLs:
Look at price structure and place SLs based on key swing highs/lows — not just round numbers.
Wait for Confirmation:
Don’t enter as soon as a level breaks. Wait for retest or a strong candle signal.
Mark Smart Zones:
Learn to spot liquidity areas and imbalance zones — that’s where big players usually trade after bots do their job.
Rahul’s Tip
The market isn’t cheating you — it’s just smarter. Learn how it works and you’ll trade with more confidence and better results.
Conclusion
Algo bots are fast and smart — but not unbeatable. If you place SLs wisely, trade with structure, and wait for confirmation, you’ll stop being trapped and start trading like the smart money.
Has your SL ever been hunted like this? Let’s talk in the comments and help each other grow!

BTCUSD-shortprice if facing rejection from pivot level
100-50 MACD shows window of oppurtunity
10 % profit oppurtunity
low risk setup

BTCUSD READY TO FLY 1450 POINTS UPSIDE POSSIBLEBTCUSD strong zone above only 82940
There is no resistance upto 84400...
wait for active zone
Buy above 82940
Stoploss 82700...........240 points
Target1.............83200.....260 points
Target2..............83400.....460 points
Target3.... Risk...84400.......1460 points
Disclaimer - This level only for education and papertrade purpose. Do ur own analysis

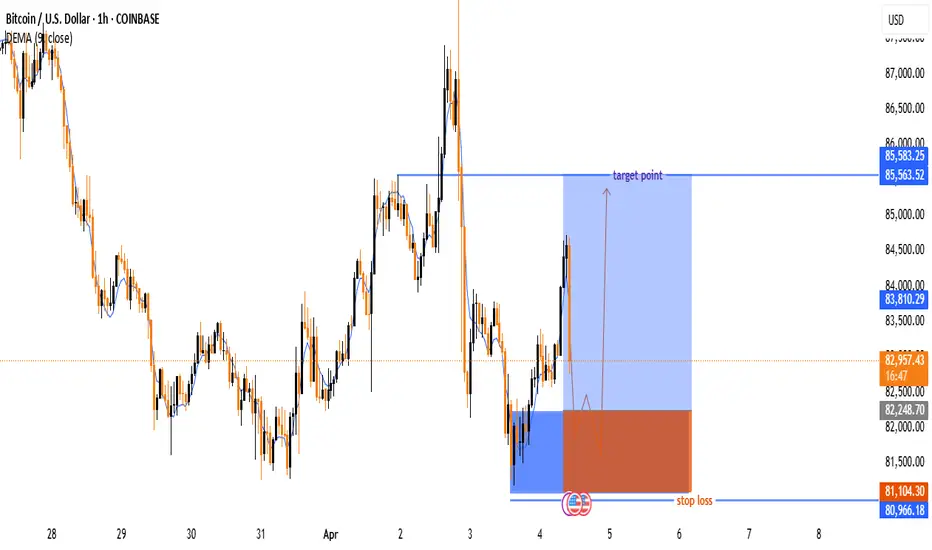
Bitcoin (BTC/USD) Trade Setup & Analysis🔹 Trend Analysis:
📉 The chart shows a downtrend followed by a reversal attempt.
📈 The price bounced off a support zone and is moving upwards.
🔹 Indicators:
📊 The 9-period DEMA (83,805.38) is slightly above the current price, acting as a resistance level.
🔹 Trade Setup:
🟢 Entry Zone: Around 82,943 (Current Price)
🔴 Stop-Loss: 81,183.22 ❌ (Below support level)
🎯 Target Point: 85,563.52 ✅ (Upper resistance level)
🔵 Strategy: The trade anticipates a price dip before
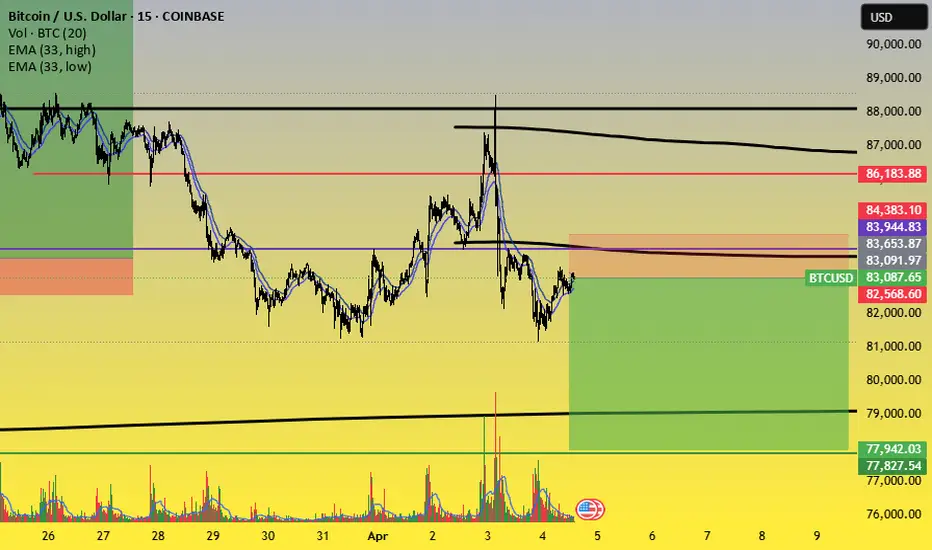
BTC Trading Recommendation (2nd Short Position)BTC Trading Recommendation (2nd Short Position)
📌 Pair: BTC/USD
📌 Timeframe: 15-Minute (M15)
📌 Exchange: (Hidden as requested)
Technical Analysis
Key Resistance Levels:
83,944 - 84,383 USD (Orange Zone)
86,183 USD (Strong Resistance)
Key Support Levels:
82,568 USD
77,827 - 77,942 USD (Strong Support)
EMA Indicators:
Price is currently hovering near EMA 33 and EMA 89, indicating a consolidation phase before the next move.
Trading Volume:
Slight increase but no clear breakout direction yet.
Trading Strategy
🔻 2nd Short BTC Recommendation: Enter a sell position when the price approaches 83,944 - 84,383 USD (minor resistance zone).
🎯 Target Prices (Take Profit - TP):
TP1: 82,568 USD
TP2: 77,827 - 77,942 USD
🚨 Stop Loss (SL):
Place SL above 84,400 USD to avoid stop-hunting.
📊 Risk-Reward Ratio (R:R) is favorable (~3:1) if price follows the plan.
⚠️ Note: Manage risk properly and observe price action at resistance zones before executing the trade.
BTCUSD 1H ANALYSIS GO LONG?Hello traders here we are going to analyse BTCUSD on 1h TF. What we can see here is BTCUSD has taken support near the previous support zone. And good thing is it's consolidated for few time after it gave the break out in this particular set up we can get 1:4 RR setup it's my personal view your view may differ from mine, please do your own research before taking trades.this is for education purpose only.

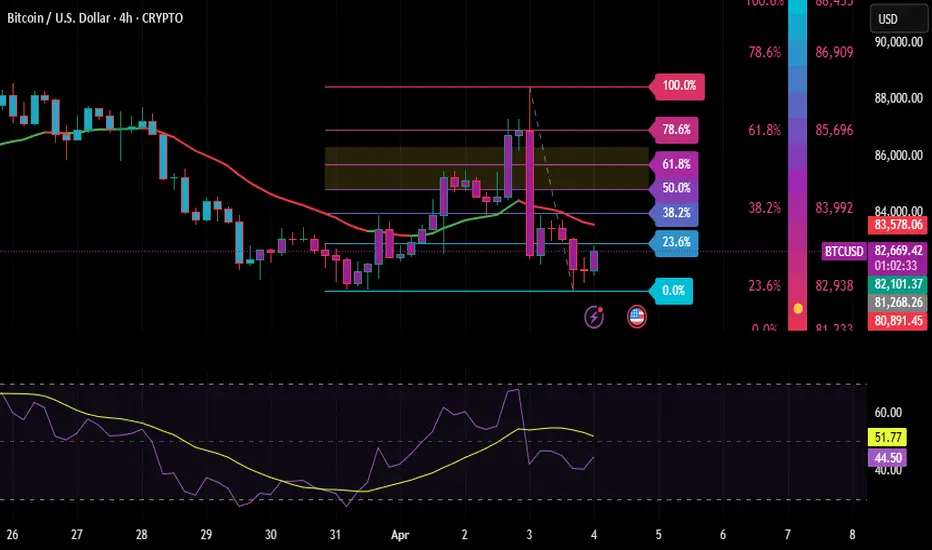
Bitcoin Bounce or Breakdown? Watch These Key RSI + Fib Levels ThBitcoin Bounce or Breakdown? Watch These Key RSI + Fib Levels This Week ₿⚠
⸻
Bitcoin has pulled back from the 85,000–86,000 zone and is now hovering near the 23.6% Fibonacci retracement level. Using AutoFibGauge, QMA, and RSI, I’ve mapped out the key zones to watch for this week.
⸻
Key Levels from the Chart:
• 86,909 – 100% (swing high)
• 85,696 – 61.8% Fib
• 83,992 – 38.2% Fib
• 82,093 – 23.6% Fib (Currently reacting here)
• 81,298 – 0% Fib (Support base)
⸻
What I’m Watching:
• RSI is neutral (~52) but starting to tick upward — early bounce signs?
• If price holds above 82,000, we may see a move back to 83,900–85,600
• A breakdown below 81,300 could trigger deeper selling into the 80,000–78,000 zone
• QMA still shows bearish trend, so I’ll wait for structure confirmation before going long
⸻
This setup is based on Fib structure + RSI strength + QMA confirmation — a combo I’ve found highly reliable on BTC/USD.
⸻
LIKE ❤ & FOLLOW ➕ for more weekly crypto setups and pro strategies!
⸻
#BTCUSD #Bitcoin #CryptoStrategy #RSI #Fibonacci #AutoFibGauge #QMA #TechnicalAnalysis #PriceAction #BTCAnalysis
Bitcoin (BTC/USD) Technical Analysis: Breakout or Rejection at K200 EMA (Blue Line): 84,124 – This is a long-term trend indicator.
30 EMA (Red Line): 83,925 – A short-term trend indicator.
Key Levels
Resistance Point: Around 83,925 (marked in blue).
Support Zone: Around 82,184 (Stop Loss zone).
Target Point: 88,197, indicating a potential 6.34% upside.
Potential Trade Setup
Scenario 1 (Bullish Case):
If price breaks above resistance (83,925) and EMA 200, then a move towards 88,197 is expected.
A breakout confirmation might lead to an uptrend continuation.
Scenario 2 (Bearish Case):
If price rejects at resistance (83,925) and falls back below the support zone (82,184), a downward move could happen.
Pattern Analysis:
The chart suggests a potential accumulation phase before a breakout.
Possible retest of resistance before a rally.
Conclusion
Bullish above 83,925, targeting 88,197.
Bearish below 82,184, with potential downside.
Price action near the 200 EMA is crucial for the next move.

last deadline According to My technical and astrological analysis Bitcoin at deadline and if take support here again and again that Means bitcoin will break the previous high, if break support then it stop at last below black line

Bitcoin (BTC/USD) Short Trade Setup: Resistance Rejection & TargThis chart is a Bitcoin (BTC/USD) 15-minute price chart from TradingView, showing a potential short trade setup based on technical analysis. Here’s a breakdown of the key elements:
1. Resistance Zone & Short Setup
The purple highlighted area represents a resistance level around $85,358.
Price is consolidating within this resistance zone, suggesting a potential reversal.
The expected scenario involves a price rejection from this resistance, leading to a downward move.
2. Moving Averages
EMA (200, blue line) at $83,433: A long-term trend indicator suggesting a strong support zone.
EMA (30, red line) at $84,657: A short-term trend indicator, currently above the price, indicating a potential bearish setup if the price moves below it.
3. Target & Stop-Loss Le

Bitcoin (BTC/USD) Price Analysis: Bearish Breakdown Ahead?🔥 Bitcoin (BTC/USD) 1-Hour Chart Analysis 🔥
🔹 Trend Analysis:
🟡 Price was moving in an ascending channel 📈 but has broken below the trendline.
🟠 A retest of the broken trendline is happening, suggesting a potential drop 📉.
🔹 Trade Setup:
🔽 Short Entry: Expected rejection from the trendline.
❌ Stop Loss: $85,671 - $85,710 (Above resistance).
✅ Take Profit Target: $81,386 - $81,347 (Bearish target 🎯).
🔹 Indicators & Confirmation:
📊 EMA (9) at $84,254 → Acting as resistance 🚧.
🔄 Break & Retest Pattern → Typical for a bearish continuation 🛑📉.
🔹 Conclusion:
⚠️ Bearish Bias: If the price rejects the trendline, it could drop towards $81,386 🎯.
🚨 Invalidation: If the price breaks above $85,710, the short setup is canceled ❌.

Bitcoin Bullish BY Jkit will work definetely
When more people want to buy Bitcoin than sell it, the price tends to rise. Conversely, if more people are looking to sell than buy, the price may drop. This dynamic creates a market environment where the balance between buyers and sellers directly influences price movements

Is Bitcoin on the Verge of a Massive Breakout?Bitcoin's wave ((4)) has successfully completed a W-X-Y corrective formation. If Bitcoin manages to decisively break above the key resistance level of 88,826, it could trigger a powerful impulsive rally, potentially driving prices toward the next major targets at 95,250 - 99,508 - 109,176.
Additionally, the parallel channel's lower trendline is offering substantial support, preventing further downside movement. A strong breakout above this channel could significantly enhance bullish momentum, increasing the probability of Bitcoin reaching new all-time highs. We will update you soon!

Bitcoin updated chart start buying near 81700-500How to take trades using Harmonic pattern projection Trade setup is explained below :-
Entry : 1st SL point : 0% is recent top or bottom.
Trailing D: 11.4% is work as trailing SL of buy or sell trade if hit then we have to book profit
.If price goes below 2nd D 21.4% to 23.6% range then early traders can make fresh reversals trade after breaking 1st D 11.4% safe traders can reversal trade after breaking Point D 21.4% to 23.6% range
Targets :
Target T1 : 35.1% to 38.3%
Target T3 : 49.1% to 53.2%
T3: 60.9% to 64.8% is our 3rd Target since this is reversal zone so must book profit if break then take fresh trade again
Target T4 : 76.4% to 79.7%
Next Targets are 100% , 127.2% ,141.4% and final Target 161.8%.
How to take reversal trade :
If price going upside/ downside then then buy or sell levels appear on Chart ( Automatically show when price reach any reversal zone of harmonic projection pattern based .
After showing reversal levels wait for confirmation until 21.4% or 28.3 % level not break if break then exit from current buy / sell trade and take fresh reverse trade buy/ sell .
Trailing SL:
After reach 1st Target trail SL to just above or below cost ( for example we are holding sell trade from 100 1st Target 110 hit then move trailing sl to 104-105 and move SL as price move upside or Downside)
Re- Entry :
For Re-entry in any pull back Point D ( 11.4% ) is used for re-entry then SL recent high or low Point SL ( 0% ) .
Blue Line is 1st support/ Resistance
Green line is 2nd support/ resistance
Red line is 3rd Support/ resistance
