Thematic Trading Strategies1. What Is Thematic Trading?
Thematic trading is an approach that identifies and invests in powerful macro trends (“themes”) rather than individual stocks in isolation. These themes may include:
Artificial intelligence and automation
Clean energy and sustainability
Electric vehicles (EVs)
Digital transformation
Cybersecurity
Space exploration
Biotechnology advancements
Shifting demographics (aging populations, rising middle class)
Geopolitical realignments
Consumption trends (premiumisation, digital retail)
Instead of selecting stocks purely based on historical performance, thematic traders focus on where the world is heading, and then choose assets that are positioned to benefit from that direction.
2. Why Thematic Trading Is Growing Rapidly
Several structural reasons explain its rising popularity:
a) Long-Term Visibility
Mega trends like renewable energy adoption or AI penetration unfold over decades, providing a clearer long-term direction compared to cyclical sectors.
b) Innovation-Driven Growth
Technological disruptions create exponential opportunities. Companies aligned with these innovations often deliver outsized returns.
c) Investors Want Purpose-Driven Portfolios
Thematic portfolios allow investors to align their investments with personal beliefs—such as sustainability, robotics, or healthcare advancement.
d) Easier Access Through ETFs & Basket Products
Dozens of thematic ETFs now offer exposure to specific trends, making participation easier.
3. Core Elements of a Thematic Trading Strategy
To build a strong thematic strategy, traders analyze three dimensions: the trend, the beneficiaries, and the timing.
a) Identifying the Theme
A strong theme usually has:
Long-term structural drivers
Global policy support (like green energy subsidies)
Strong demand-side and supply-side catalysts
Early or mid-stage development (not fully priced in)
b) Theme Validation
For validation, traders study:
Growth forecasts
Industry adoption rates
Scientific or technological feasibility
Capital inflows into the sector
Market size expansion
Regulatory environment
c) Mapping the Value Chain
Once the theme is established, traders look at the value chain:
For example, in Electric Vehicles:
Battery manufacturers
Lithium/cobalt miners
EV OEMs
Charging infrastructure providers
Software and sensor companies
Understanding the value chain helps discover early movers and high-growth segments.
d) Selecting Instruments
Thematic trading can be executed using:
Individual stocks
ETFs & sector baskets
Index futures
Options (for leverage & hedging)
Commodity plays related to the theme
Global stocks or ADRs
4. Types of Thematic Trading Strategies
**1. Technological Themes
These are the most widely followed themes today, due to rapid digital transformation.
Key examples:
Artificial Intelligence
Machine Learning & Automation
Robotics
Cybersecurity
Cloud computing
FinTech & digital payments
Why attractive?
Tech themes offer exponential growth potential as adoption scales globally.
2. Sustainability & Clean Energy Themes
Driven by global climate commitments and government incentives:
Solar and wind energy
Hydrogen fuel economy
Electric vehicles
Waste management & recycling
Water purification
Green metals (lithium, copper, nickel)
Why attractive?
Clean energy is expected to dominate global energy transition, providing decades of investment opportunity.
3. Healthcare & Biotechnology Themes
These include:
mRNA technology
Genomics & DNA sequencing
Precision medicine
AI-driven medical diagnostics
Senior care & aging population industries
Why attractive?
Healthcare demand grows steadily with demographic shifts and breakthroughs.
4. Demographic Themes
These focus on changes in population structures:
Rising middle class in Asia
Aging populations in Japan, Europe
Urbanization in developing economies
Millennial and Gen Z consumption patterns
Why attractive?
Demographic shifts drive predictable long-term market behavior.
5. Geopolitical & Macro Themes
These arise due to global realignments:
Defence and aerospace sector uptrend
Commodity supercycles
Reshoring of manufacturing
Supply-chain diversification
Currency realignments
Why attractive?
These themes often have strong policy and budgetary backing.
6. Consumer Behavior Themes
Based on changing lifestyles:
Digital commerce boom
Subscription economy
Luxury consumption growth
Health & wellness industry
Travel and experiential spending
Why attractive?
Consumer preferences shape long-lasting corporate winners.
5. How To Build a Thematic Portfolio
A systematic approach ensures risk-managed exposure.
Step 1: Define the Theme
Example: "AI adoption in enterprise workflows"
Step 2: Evaluate Theme Drivers
Corporate AI spending
Cloud migration
Data infrastructure growth
Step 3: Map the Value Chain
Semiconductors
Data centers
Software & AI service providers
Hardware companies
Step 4: Select Stocks or ETFs
Choose leaders + emerging disruptors.
Step 5: Portfolio Allocation
Balance between:
High-growth stocks
Value chain diversification
Geographical spread
Step 6: Risk Management
Stop-loss
Portfolio rebalancing
Diversification across themes
6. Benefits of Thematic Trading
a) High Growth Potential
Themes like AI and clean energy can outperform traditional sectors.
b) Long-Term Visibility
Themes often remain relevant for years, reducing dependency on short-term volatility.
c) Innovation Exposure
Provides access to cutting-edge technologies before mainstream adoption.
d) Easier Diversification
ETFs offer broader exposure with fewer stock-specific risks.
7. Risks in Thematic Trading
a) Overhype Risk
Trends can become overpriced quickly due to speculative demand.
b) Technological Uncertainty
Some innovations fail to reach commercial viability.
c) Regulatory Risks
Government rule changes can impact themes like crypto or clean energy.
d) Concentration Risk
Too much focus on a single theme reduces diversification.
e) Timing Risk
Entering a theme at its peak can lead to long drawdowns.
8. Examples of Popular Thematic Trades
AI Boom (2023–2025)
Benefited:
Chipmakers
Cloud platforms
AI software companies
EV and Battery Metals Surge
Lithium and copper saw explosive demand.
Cybersecurity Uptick
Driven by ransomware growth and global cyber threats.
Green Energy Push
Solar, hydrogen, and EV charging firms gained substantial traction.
9. Best Practices for Thematic Traders
Study multi-year macro reports
Focus on value chain leaders
Avoid hype-driven buying
Diversify across multiple themes
Use ETFs when unsure about specific stocks
Regularly review theme performance
Balance high-risk innovation stocks with stable players
Conclusion
Thematic trading strategies provide a powerful framework for capturing long-term transformative trends shaping global markets. By focusing on structural changes—technological, economic, environmental, or demographic—traders can design portfolios that benefit from multi-year compounding growth. While thematic trading offers enormous potential, it also requires disciplined research, smart diversification, and timing awareness.
When done correctly, thematic trading not only provides strong returns but also aligns investments with the future direction of global progress.
Trade ideas

What BTC has to offer now - Swing Trade opportunityBINANCE:BTCUSDT.P
DELTAIN:BTCUSD.P
BYBIT:BTCUSDT.P
BTC played our level perfectly giving about 8.5% return in three days
Now what can be done next - LETS DISCUSS
After touching our level 94000 which was a 0.5 retracement zone BTC is down 1500 points
I am expecting bearish momentum in the upcoming days
LOGIC - To sustain the upwards trend in the long term BTC has to test its 0.6 retracement zone in 1 month tf which is around 74700 level, I could be 100% wrong but the global environment is not so good which might act as a catalyst for the downwards momentum.
Leverage recommended 5x or below (Level based on Delta Exchange Chart)
Short at Current market price = 92600
Stop loss = 97600
Target 1 = 87500 (RR 1:1)
Target 2 = 80608 (RR 1:2.4)
Target 3 = 74700 (RR 1:3.6)
RR ratio = 1:3.6
Total point to capture = 17850
Stop loss point = 5050
Disclaimer: The content is for educational purposes and should not be considered a recommendation to buy or sell any security.

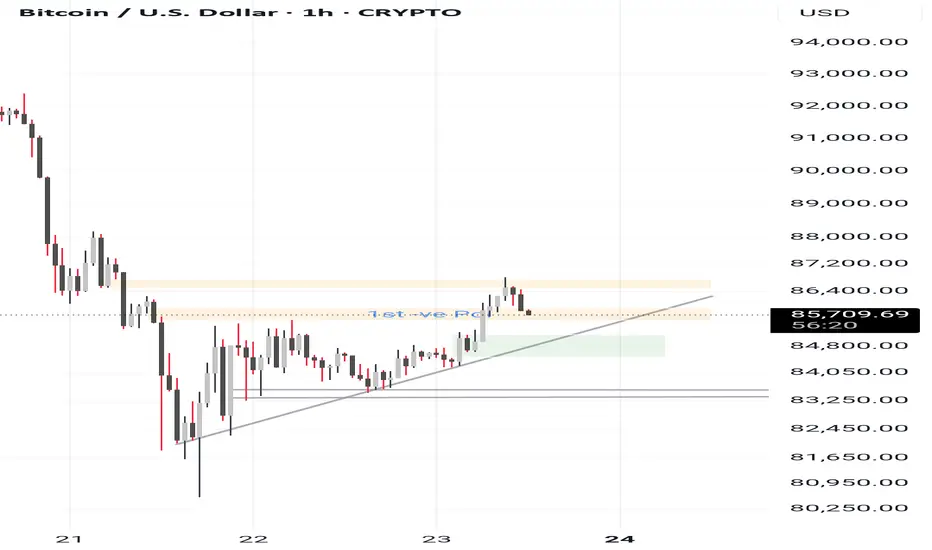
BTC bullish again in 4H || Bullish Thanks for giving so much love to my last post. Here I am back again with a new analysis.
A bullish divergence is visible on the Daily & 4H charts: Price is making lower lows RSI is making higher lows This signals that downside momentum is weakening and buyers are slowly stepping in. However, divergence alone is not confirmation — we need price breakout.
Entry: ~$88,000 — after a bounce off support or on confirmation of bullish reversal signals (candles, volume, RSI)
Stop-Loss: ~$83,000 — just below support
Take-Profit: ~$96,000 — aiming for move back toward lower resistance
These setups are hypothetical examples, not trade calls or financial advice. They assume you manage risk properly and monitor the trade.

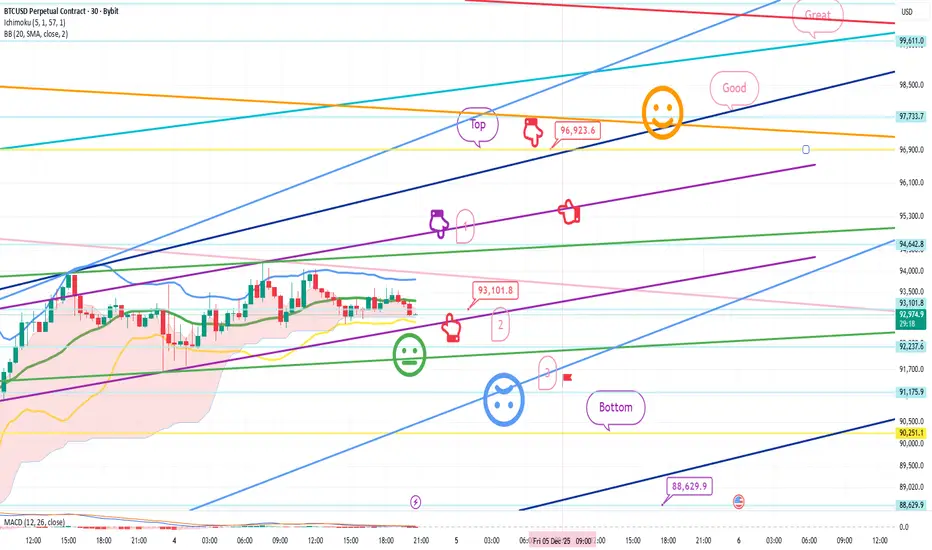
Bitcoin Bybit chart analysis December 4Hello
It's a Bitcoin Guide.
If you "follow"
You can receive real-time movement paths and comment notifications on major sections.
If my analysis was helpful,
Please click the booster button at the bottom.
This is a 30-minute Bitcoin chart.
It's not visible on the screen due to limited space,
but at the bottom, it touched the long position entry point of $83,495.4 on December 1st,
and continues to rise.
The Nasdaq indicators will be released shortly at 10:30 AM,
and I developed today's strategy based on the Nasdaq and Tether dominance patterns.
*Conditional long position strategy based on the red finger's path
1. After touching the purple section once at the top (autonomous short)
Switch to a long position at the red finger at the bottom at $93,101.8
/Stop-loss price if the green support line is broken
2. First target for a long position at the top section at $96,923.6 -> Target prices in the order of Good and Great
Before tomorrow's daily candlestick is created,
if the top section is touched alone,
since it is a resistance line on the Bollinger Band daily chart,
a strong correction is likely.
If the Good section is touched at once,
it is highly likely to be ignored and continue to rise.
If the price drops immediately without touching the first section at the top,
it's a final long strategy in the second section,
and the stop-loss price remains the same.
The third section below is a sideways movement.
If the green support line holds today, a vertical rise is possible after tomorrow.
If the price holds today's light blue support line,
it could lead to a strong upward movement after tomorrow.
Below the bottom, the price is open to 88.6K, the lowest point today.
Please note this.
Please use my analysis to this point for reference only.
I hope you operate safely, adhering to principled trading and a stop-loss price.
Thank you.

Part 7 Trading Master Class Long Call – Best for Trending Bullish Markets
This is the simplest directional option trade.
How it works
You buy a call option.
Profit increases as price moves above strike + premium.
When to use
You expect a big upside in short time.
Market volativity is low, premiums are cheap.
Risk and reward
Risk: Only premium paid.
Reward: Unlimited theoretical upside.
Example
You buy a Nifty 23,000 CE for ₹50.
If Nifty goes to 23,200, your call may become ₹200.
Your profit = ₹200 – ₹50 = ₹150 per unit.

BTCUSD — extending the declineThe most likely scenario I see is a move to the 70k area or slightly lower. From that level we can then look for the next move.

BTC has fallen by 35% from ATH, what to expect nowDELTAIN:BTCUSD.P
Bitcoin fell 5% last night,
Currently bitcoin is trading inside 1day FVG support + 0.6 level upside fib retracement level
i.e Range of 85000 - 87000
On monthly support of bitcoin remain near 74600 level, which may get tested by bitcoin in the upcoming days
Resistance remain near 93900 which is a fib retracement zone of 0.6
If bitcoin breakout 87000 level in the upcoming days there high chance it would move towards 93900 level or if bitcoin loses the 85000 support it will fall towards 80400 low and then towards 74600 level for an immediate support
Bullish momentum could be seen in the upcoming days towards 93900 levels as market will take sellers liquidity
Current market price buy at current market price: 86500
Stop loss: 83350
Target: 93900
RR ratio: 2.5
Leverage recommended: 10x or lower
Disclaimer: This content is for educational purposes only and is not financial or investment advice. It is not a recommendation to buy or sell any specific security or cryptocurrency.

BUY BITCOIN FOR SHORTTERM SWINGbuy bitcoin at 85500 for target of 94100 for short term with stoploss of 83300 it is at a harmonic support can give a pull back

Candle Patterns Limitations of Candlestick Patterns
They do not predict exact price targets.
False signals occur during high volatility.
Requires combining with other tools for accuracy.
Works less effectively in extremely choppy markets.

Bitcoin levels and target on mondayBitcoin target and levels on Monday... Check high probability 1 hour candle bitcoin strategy link in yt channel catchandreadtradingtools

BITCOINbitcoin trend sift bullish.best buy zone dip near 88520 to 86900 invalidation below 85000
next bias 97500

Bitcoin looks positive post 48000.As per the montly chart, the lines are coming out strong. The actual target in coming years is looking way big. Please consult your financial advisor before investing.

Part 8 Trading Master ClassAdvantages of Option Trading
1. Limited Risk for Buyers
Buying options never risks more than the premium.
2. High Leverage
Small investment can control large quantity.
3. Flexibility
Hundreds of strategies exist.
4. Hedging Power
Investors can protect long-term portfolios.
5. Income Potential
Option writing gives fixed, predictable income.

BTC USD SHORT ✅ BTCUSD – Sell Setup (based on your chart)
Sell Entry
👉 90,750 – 90,850 zone
This is where your chart shows a retest + rejection of the trendline & EMA zone.
🎯 Take-Profit Levels (TP)
TP1 (Safe Target)
89,800
• First liquidity pocket
• Near S1 line
• Easy to hit in a small dump
TP2 (Main Target)
88,700 – 88,400
• Clear demand zone
• Your yellow line hits this area
• Previous support & Monday high region
TP3 (Extended Target)
87,900 – 87,800
• Final drop level in your projection
• Last strong support before reversal zone
🛡️ Stop-Loss (SL)
SL Above Rejection Zone
91,150 – 91,250
Why?
• Break above this means structure flips bullish
• Break above descending trendline
• Above your M2 level + EMA cluster
This SL gives the trade room to breathe without invalidating the bearish setup.
📌 Final Trade Summary
Component Level
Sell Entry 90,750–90,850
SL 91,150–91,250
TP1 89,800
TP2 88,700–88,400
TP3 87,900–87,800

BTCUSD - Wave 5 Decline Still Likely AheadPrevious Analysis:
BTC is approaching a critical reaction zone where the current rise looks more like a corrective push than the start of a new trend. Price is moving toward the highlighted supply region, which aligns with a potential wave 4 completion inside the descending channel. The structure from the recent low shows an internal a–b–c formation, suggesting this bounce could run into exhaustion as it enters the red zone. Unless BTC breaks out of the channel with conviction, the broader momentum still leans bearish. A rejection from this region would likely trigger the final wave 5 leg, driving price toward deeper Fibonacci levels and completing the corrective cycle before any meaningful recovery attempt can begin.
Stay Tuned!
@Money_Dictators

short BTCbitcoin on higher time frame is at a strong supply zone and gave ltf confirmations for downside potential.
study the reaction at any retracement for potential down move.

Part 12 Trading Master Class How Put Options Work
A Put Option gives the buyer the right to sell the underlying asset at the strike price.
You buy a put when you expect the market to fall.
Example:
Nifty at 22,000
You buy 21,800 PE at ₹45 premium.
If Nifty drops to 21,600:
Intrinsic value = 21,800 – 21,600 = ₹200
Profit = 200 – 45 = ₹155
If Nifty stays above 21,800, you lose only the premium.

Part 9 Trading Master Class With Experts What Are Options?
Options are derivative contracts. This means their value is derived from an underlying asset—such as Nifty, Bank Nifty, stocks like Reliance or TCS, commodities, or currencies.
There are two types of options:
Call Options (CE) – Right to buy at a specific price
Put Options (PE) – Right to sell at a specific price
But remember this key point:
Options give a right, not an obligation.
This is what makes options asymmetric:
Buyers have limited risk and unlimited potential gain.
Sellers (writers) have limited profit but potentially high risk.

BTCUSD Liquidity Sweep Setup Before Bearish ContinuationBTCUSD Liquidity Sweep Setup Before Bearish Continuation
Overview
BTCUSD continues to display persistent downside pressure across the mid-term structure. Price action on the 3H timeframe shows a sequence of lower highs and lower lows, reflecting sustained bearish control. Despite short periods of stabilization, the overall market environment remains distribution-driven.
Market Structure
Recent price behavior confirms multiple break-of-structure (BOS) events, each reinforcing the broader downward momentum. Every attempt at upward expansion has been met with supply absorption, indicating that buyers are failing to regain initiative. The consolidation developing in the current region suggests an accumulation of short-term liquidity, but without structural evidence of reversal.
Supply & Liquidity Context
Price is positioned directly beneath a key supply zone highlighted on the chart. This zone remains unmitigated and acts as the primary area where counter-trend reactions are likely to be absorbed. The tightening range beneath this level indicates liquidity buildup, commonly preceding engineered sweeps by institutional players.
The current model suggests that the market may execute a short-term liquidity run above local highs before resuming its downward trajectory. Such a move would align with previous behavior in this trend cycle, where short-term rallies were primarily used to deliver liquidity into higher-timeframe supply.
Downside Expansion Risk
Should the market complete a liquidity sweep into the supply zone, the next phase of downside continuation becomes probable. The structural projection on the chart anticipates a revisiting of the lower demand region around 74,300 – 75,000, an area aligning with previous inefficiencies and untested demand.
This target supports the continuation of the broader bearish structure unless a significant shift in order flow emerges.
Summary
BTCUSD remains positioned within a well-defined bearish cycle, characterized by repeated structure breaks and unmitigated supply zones controlling price. Current compression suggests the market is preparing for another liquidity-driven move. Unless buyers regain structure above the key supply region, the market retains a high probability of extending toward lower demand zones.

BTC What IF || Bull or bear$70K is the critical support, As long as price holds that trendline, the bull structure remains intact Upside only confirms if price reclaims $92K → $100K.
Support: around $70K–$72K, Resistance: around $92K EMA-100 is near $112K (long-term dynamic resistance above). RSI was oversold ~32 and is trying to recover, also a falling RSI trendline, showing potential bullish divergence.
I’ve marked a possible 5-wave impulse:
1 → bounce
2 → deeper retest (near 70K)
3 → strong move up
4 → pullback
5 → final push (above $100K)
The information shared is for general purposes only and should not be considered as professional advice. All views expressed are my own and do not represent the opinions of any organization I am associated with.

#bitcoin respected #fibbo#bitcoin respected #fibbo
all fibbonaci ratio being respected by chart pattern
waiting for reversal hope for best

How many wants to join free live market analysis?How many interested?
Join live market
Learn live market sentiment
That is everything , closing market looks good to trade but what we learn in live market will make u understand the real behaviour of market.
Let go
Just like it, we will update asap where u want to join