NZDCAD MULTI TIME FRAME ANALYSISHello traders , here is the full multi time frame analysis for this stock , let me know in the comment section below if you have any questions , the position will be taken only if all rules of the strategies will be satisfied. wait for more price action to develop before taking any position. I suggest you keep this pair on your watchlist and see if the rules of your strategy are satisfied.
🧠💡 Share your unique analysis, thoughts, and ideas in the comments section below. I'm excited to hear your perspective on this pair .
💭🔍 Don't hesitate to comment if you have any questions or queries regarding this analysis.
CADNZD trade ideas

Inverse Cup and Handle for Bearish indicationAfter strong Bullish Engulfing formation on 5th September 2025, the OANDA:NZDCAD price is rocketing towards higher highs, aiming for 0.8624 resistance.
Now it needs some breath after forming a bearish Harami on 12th September 2025.
Looking at the Hourly timeframe, it made an inversed Cup and Handle which indicates for bearish signal.
Yet we need another confirmation for breaking its lower high at 0.8229 which is our entry price
I am bearish from Monday onwards waiting for that cup's handle breakout. Once its done my orders must be triggered and left for bearish.
I will place a sell stop order 0.8229 with my SL at the handle of cup at 0.8256.
I will take two positions both at the breakout of Handle at 0.8229. Both position has 2% risk in total
Note: The Sell stop order is a must. If its not triggered then we are not aiming for any other trade.
Position 1 with 1 % Risk
Buy Stop: 0.8229
Stop Loss: 0.8256
TP: 0.8197
Position 1 with 1 % Risk
Buy Stop: 0.8229
Stop Loss: 0.8256
TP: 0.8160

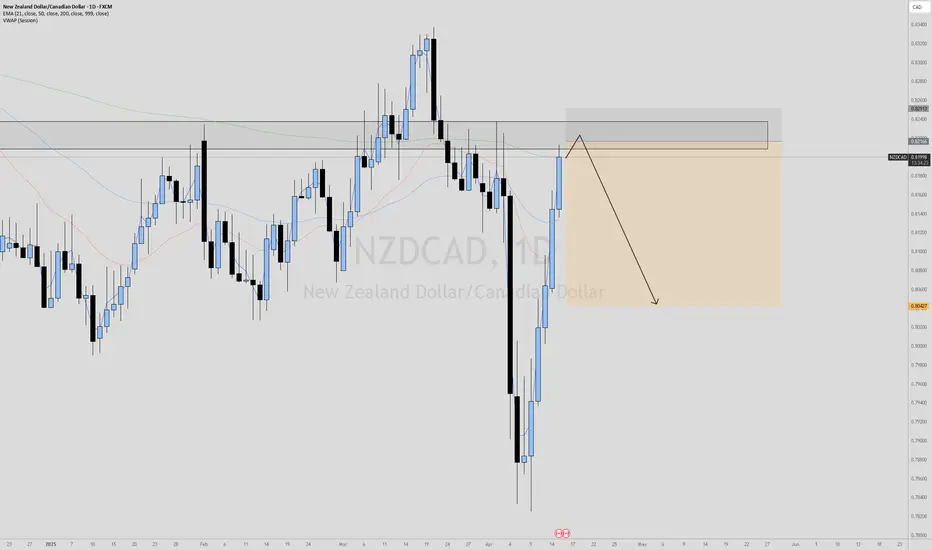
NZDCADThe pair remains in a downtrend and overall bearish, but I see a potential counter-trade opportunity. This could set up as a “buy to sell” scenario. I’ll be watching for a possible bounce toward the upside before resuming shorts. First area of interest is around the 0.8100 level, where I’ll wait patiently to see how price reacts.

NZDCAD – H4 Short SetupMarket Structure:
Price shifted bearish after failing to make a higher high and breaking previous structure lows (MSS). A clean Fair Value Gap (FVG) formed after the shift, and a major supply zone sits just above.
⸻
Entries:
• Aggressive Entry: 0.82037 (FVG retest)
• Conservative Entry: 0.82181 (Major supply zone)
Stop Loss (for both entries): 0.82600
⸻
Targets:
• Target 1: 0.80750 – Mid-level demand + Sell-side liquidity grab zone.
• Target 2: 0.79731 – Major demand zone + Previous swing low.
⸻
Note:
This plan is based on market structure and supply-demand confluence. Manage your risk carefully and always validate with your own analysis before taking any trades.

NZDCAD, SELLThe daily market structure remains bearish, as price is still tradin in Daily supply. and the most recent reaction occurred from the last point of a daily supply zone, reinforcing the current downtrend.
On the 15-minute timeframe, we observed a clear transition in trend structure, with price breaking bullish order flow and shifting momentum downward. This transition was confirmed by a bearish mitigation of imbalance, followed by a move to the downside.
As a result, a new trading range has formed, and a fresh 15-minute supply zone has been identified around the 0.82400 level. This area aligns well and provides a high-probability zone for continuation shorts.
With a clear downside target, price is expected to drop lower offering an good risk-to-reward (RR) setup.
Entries from the 0.82400 supply with could present a good opportunity in line with both the higher and lower timeframe bias.
Let's see how it plays out.

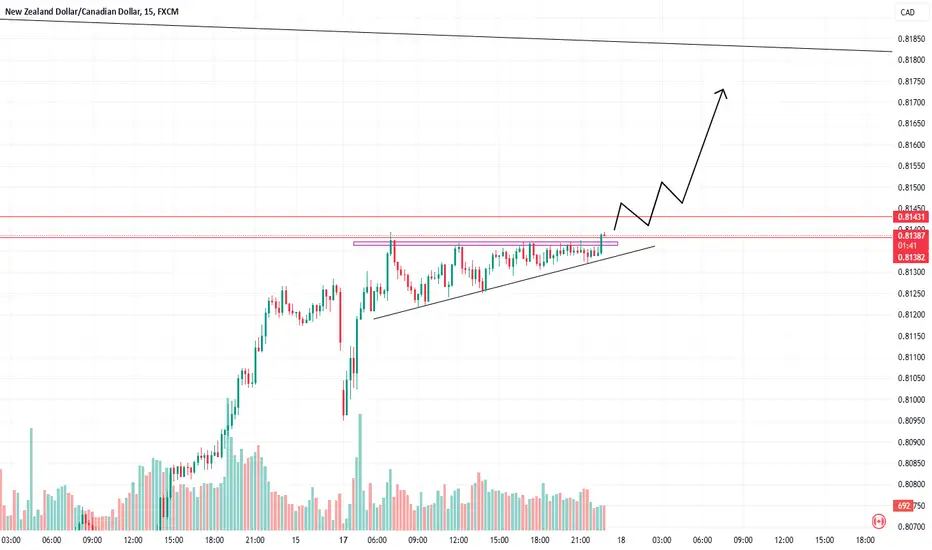
ICT NZDCADHello, I'm FXHUNTER. Welcome to the Forex Hunter channel. Analysis of the NZDCAD symbol. This symbol has formed a Stop Hunter pattern and it is likely that the price will be supported by the specified area. Of course, the market structure is also bullish and you can wait for the price to reach the desired area and enter a buy position by changing the structure in the 1m time frame and keep your trade active until the previous ceiling.

NZDCAD - CAUGHT IN THE MIDDLE, INTRA-RANGE TRADINGSymbol - NZDCAD
NZDCAD continues to exhibit strength within a broadly neutral trading range, supported in part by a corrective pullback in the US dollar. However, the sustainability of this momentum remains uncertain as market participants await key upcoming events, including the FOMC meeting and a speech by Federal Reserve Chair Jerome Powell.
The primary focus remains on the current consolidation zone, where the pair is exhibiting a localized upward bias. Notably, liquidity accumulation near the 0.8315 level appears to be exerting a magnetic effect on price action. The recent correction in the US dollar has provided short-term support to the New Zealand dollar, contributing to the pair's recent gains.
Nevertheless, upcoming fundamental developments pose significant event risk. Market expectations suggest a potentially hawkish tone from the Federal Reserve, which could prompt a reversal in the prevailing trend. Given the current neutral range, there is an elevated risk of a false breakout, followed by a corrective move.
Key Resistance Levels: 0.8315
Key Support Levels: 0.8264, 0.8235, 0.8225
The 0.8315 liquidity zone may act as a temporary barrier or potential reversal point. Future price direction will likely hinge on the tone and content of forthcoming US economic data and Fed communications. Should the Federal Reserve adopt a more aggressive policy stance or signal intent to do so, the US dollar could regain strength, potentially weakening the NZD in the process.

NZDCAD -Week 4 AprilUptrend in 4H, D Timeframe. W - downtrend pullback.
So will be buyer till the market gives reversal signal.
So far making HH and HL.
We can see double top and RSI diverngence in 4H. but
We need BOS to go down.
If you are not getting strong signal to go up(4H candle),
Do not go for buy

NZDCAD MULTI TIME FRAME ANALYSISShorted NCAD around 0.82145, SL at around 0.83420, TP at 0.78275.
Even though the last bullish impulse in NCAD was strong—really strong—the weekly structure still feels bearish. But NZD just cleared 2022 lows and now seems to be trying to shift bullish. That makes me question whether this is just a correction or the beginning of a new trend.
Still, on the 4H chart in NUSD, a correction seems likely, and in that context, this short makes sense as a swing play within a broader corrective phase.
On the CAD side, UCAD is rejecting downside from weekly resistance quite well. But we’re also sitting on a key resistance -turned-support around 1.3900 on the weekly, which adds some complexity.
So yeah, structure supports the short, but I’m aware of the macro factors that could shift momentum. Clear bias for now, but staying flexible around key levels.
It's one of those swing setups where I need to stay flexible, even if the current bias is clear.,

A Short View on NZDCAD .Currency Pair: NZDCAD (New Zealand Dollar / Canadian Dollar)
Timeframe: Daily Chart
Analysis:
The chart shows a strong bearish (downtrend) momentum with lower highs and lower lows, indicating seller control. The price has broken below a significant support level, now acting as resistance. The price has retraced to this resistance, a classic "throwback/pullback" pattern, often seen as a short-selling opportunity. Recent candlesticks show bearish momentum.
Potential Trade Setup:
Entry: Near the resistance level. Look for bearish candlestick patterns for confirmation.
Stop Loss: Above the resistance level.
Target: A previous low or a new lower low.
Additional Considerations:
Consider fundamental factors affecting NZDCAD.
Use proper risk management.
Disclaimer: This is a technical analysis and not financial advice. Trading involves risk. Do your own research.
NZDCAD SELL ZONE 🔴 NZDCAD SELL TRADE ALERT! 🔴
📉 Shorting NZDCAD based on strong supply zone rejection and bearish momentum! 🚀
🔥 Trade Breakdown:
✅ Price hit a key resistance level 📊
✅ Bearish confirmation on higher timeframes 📉
✅ High probability setup with solid risk-to-reward ratio 🎯
🎯 Expecting a strong move downward—let’s ride the trend! 💰

NZDCADFX:NZDCAD
Hi guys, As you can see in NZDCAD it was in consolidation from 3days in 15min TF and it created a strong support and resistance. If it gives breakout either side we can take entries, make sure to take retest entries and SL will be at pull back candle. ( My prediction was bearish ) so, plan your trade accordingly.

NZDCAD FX:NZDCAD
Hi Guys, IN NZDCAD you can see that, it created a horizontal resistance. take entry if the price breaks the drawn level and candle must close 50% out side the drawn level and for safer entries take retest entry on long position.
NZDCAD Resistance Ahead!
HI,Traders !
NZDCAD is making a local
Rebound but a horizontal
Resistance is ahead at 0.81417
So after the retest we will be
Expecting a local bearish pullback
And a move down !
Comment and subscribe to help us grow !

NZDCAD BUY STRUCTURE i can see the buy possibility here , this trade will be valid till , if market does not hit 0.8575 zone for a buy trade , but once the market hits 0.8575 zone then the structure will get changed, i will updated if the structure get changed

NZD CAD BUY the trade is till active, 0.8233 level if it does not break, now this is last buy possibility for NZDCAD , this trade is continuity of NZD CAD

Buys on NZDCAD on 1 hr timeframeNZDCAD has grabbed liquidity below its previous suport level 0.83600 and has pulled back to continew its uptrend. One can look for swing buys towards 0.8430 levels with 10-15 stop loss. RR is impressive upto 1:5.

Swing Trading Strategy for NZDCAD (4-Hour Chart)Based on the NZDCAD 4-hour chart that you provided, the following analysis and swing trading strategy can be established:
Chart Analysis:
Main Trend:
The price showed a downward trend from late August to late September, forming a bottom around the 0.8220 region.
Afterward, the price has rebounded, creating higher highs and higher lows, indicating a temporary uptrend forming.
The 33-week EMA is currently below the price, which signals short-term bullish momentum.
Support and Resistance Levels:
Support: Strong support around the 0.8220 - 0.8240 zone, as this is the recent bottom.
Resistance: Current resistance near 0.8541, close to the recent peak in September.
Trend Line and EMA:
The price is bouncing off the 33-week EMA and approaching the strong resistance level near 0.8400. This suggests that if the price breaks this resistance, the bullish trend could continue.
Swing Trading Strategy:
Buy on a Break of 0.8400 Resistance:
When the price breaks above the 0.8400 resistance level with increasing volume, this is a potential buy signal.
Entry Point: Open a buy position when the price closes a 4-hour candle above 0.8400.
Stop Loss:
Place a stop loss below the nearest support level, around 0.8300, as this is a key price level that could hold in case of a short-term pullback.
Take Profit:
The profit target can be set around the 0.8540 level, which corresponds to the key resistance zone.
If the price reaches this resistance and trading volume weakens, you might consider taking full or partial profits to lock in gains.
Strategy Summary #NZDCAD:
Buy: When the price breaks above 0.8400.
Stop Loss: Set below 0.8300.
Take Profit: Around the 0.8540 resistance level.
Given the volatility in the forex market, continuous monitoring and adjusting the strategy are essential.
Ready to start trading and learning?
Get $10,000 in virtual money and learn how to trade with a market-leading broker. Sign up for an Exness account today using this link: Web in Profile of me!
Thank!

NZDCAD MULTI TIME FRAME ANALYSIS Hello traders , here is the full multi time frame analysis for this pair, let me know in the comment section below if you have any questions , the entry will be taken only if all rules of the strategies will be satisfied. wait for more price action to develop before taking any position. I suggest you keep this pair on your watchlist and see if the rules of your strategy are satisfied.
🧠💡 Share your unique analysis, thoughts, and ideas in the comments section below. I'm excited to hear your perspective on this pair .
💭🔍 Don't hesitate to comment if you have any questions or queries regarding this analysis.

NZDCAD MULTI TIME FRAME ANALYSISHello traders , here is the full multi time frame analysis for this pair, let me know in the comment section below if you have any questions , the entry will be taken only if all rules of the strategies will be satisfied. wait for more price action to develop before taking any position. I suggest you keep this pair on your watchlist and see if the rules of your strategy are satisfied.
🧠💡 Share your unique analysis, thoughts, and ideas in the comments section below. I'm excited to hear your perspective on this pair .
💭🔍 Don't hesitate to comment if you have any questions or queries regarding this analysis.

NZDCAD View!!Markets increased the likelihood of a surprise rate hike this week so while the outcome came somewhat as a surprise, outcome had gained traction in recent days. Last week Wednesday markets priced in 16 basis points (bps), but ahead of the announcement it had risen to 20 bps.
Unemployment has picked up; and while GDP growth improved in Q1 compared to Q4, it still disappointed when viewed alongside estimates. Low growth and inflation combined with rising unemployment provides a mix that the committee believed justified a rate cut today.

NZDCAD MULTI TIME FRAME ANALYSISHello traders , here is the full multi time frame analysis for this pair, let me know in the comment section below if you have any questions , the entry will be taken only if all rules of the strategies will be satisfied. wait for more price action to develop before taking any position. I suggest you keep this pair on your watchlist and see if the rules of your strategy are satisfied.
🧠💡 Share your unique analysis, thoughts, and ideas in the comments section below. I'm excited to hear your perspective on this pair .
💭🔍 Don't hesitate to comment if you have any questions or queries regarding this analysis.

NZDCAD SHOWING A LONGTERN UP MOVE WITH 1:10 RISK REWARDNZDCAD SHOWING A GOOD UP MOVE WITH 1:10 RISK REWARD
DUE TO THESE REASON
A. its following a rectangle pattern that stocked the market
which preventing the market to move any one direction now it trying to break the strong resistant lable
B. after the break of this rectangle it will boost the market potential for break
C. also its resisting from a strong neckline the neckline also got weeker ald the price is ready to break in the outer region
all of these reason are indicating the same thing its ready for breakout BREAKOUT trading are follws good risk reward
please dont use more than one percentage of your capitalfollow risk reward and tradeing rules
that will help you to to become a bettertrader
thank you
