Clear Buy SideBuy Side Confirmed with MSS formation And a strong inefficiency candle may go good with the CAD news today announcement will come with favor of buy side in USDCAD may end the sell trend
CADUSD trade ideas

short idea in usd/cadit is in a down trend
its recent price behaviour suggest
after a one big move upward it starts consolidating and make range which eventually gives breakdown towards downside

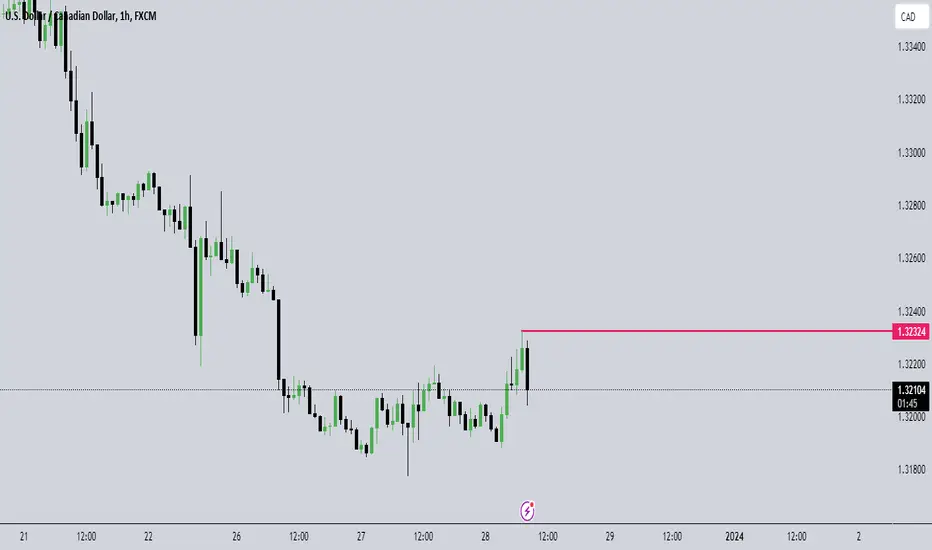
USDCAD Bullish Kangaroo Tail Signals Potential Upside Amid CPI D📈 Trade Idea Overview:
The USDCAD pair presents an intriguing opportunity with the emergence of a Bullish Kangaroo Tail candlestick pattern, suggesting a potential reversal in the current downtrend. This formation, characterized by a long lower wick and a small body, indicates a rejection of lower prices and a possible shift in market sentiment.
📊 Technical Analysis:
Bullish Kangaroo Tail: The recent candlestick pattern near key support levels on the USDCAD chart signals bullish momentum. Traders may consider this as a buying opportunity.
Fibonacci Confluence: The Bullish Kangaroo Tail aligns with significant Fibonacci retracement levels, reinforcing the potential for a bullish reversal.
📆 Upcoming Catalyst:
Market participants should keep an eye on the upcoming Consumer Price Index (CPI) data release, as it can act as a catalyst for increased volatility. Positive CPI figures may further support the bullish bias, while negative results could pose a challenge to the anticipated reversal.
🎯 Potential Targets:
Short-term: Target the recent swing high as a conservative profit target.
Medium-term: Aim for higher resistance levels, considering the broader trend reversal.
🛑 Risk Management:
Implement proper risk management strategies, including setting stop-loss orders based on technical levels and market conditions.
🚨 Caution:
Trading involves risk, and it's essential to stay informed about economic events and adapt your strategy accordingly. Always use proper risk management to protect your capital.
📈📉 Disclaimer:
This is not financial advice. Traders should conduct their own research and consider their risk tolerance before making any trading decisions.

Waiting For Buy Confirmation to enter TradeHere need to wait 1H candle close above 1.34034 for buy Side Confirmation after confirmation can enter buy trade on Retracement

Looking for Long!USDCAD is looking for long after forming descending channel expecting target to reach 1.35200

usd/cad looks super bearish to selltrend is down
it is super bearish and most of the time unable to break previous high
so here is the plan

Strong Bullish PossibleIts Clear Retracement Happened will be Strong Bullish Possible waiting for the 1H Choch for the Buy Setup will strong towards Higher High

USDCAD GOOD For Swing Trade Short TradeUSDCAD GOOD For Swing Trade Short Trade
Entry : 1.35781
SL : 1.36202
TP : 1.34508

Bullish Trend May StartsOn Weekly it is on Clear Bullish Correction Happened 618% waiting for the change of Character to enter on retracement for the Buy Side Expected High Probably

USDCAD LONGthis trade was taken for a long as soon as it passed the first break-out zone that was fixed by looking at the support and resistance zones that were set and once the target zone was crossed the force that it went was so fast that it hit the resistance zone in no time but what was predicted that it would cross the resistance zone and shoot out bullish didn't happen so had to take profit
Mistakes to be corrected :
entered in the middle of the trade by missing the trade alerts and set up

USDCAD retreats from 1.3600 resistance ahead of BoC announcementUSDCAD takes offers to refresh the intraday low near 1.3570 while snapping a two-day uptrend ahead of the Bank of Canada (BoC) Interest Rate Decision. In doing so, the Loonie pair reverses from a convergence of the 100-day Exponential Moving Average (EMA) and a month-old descending trend line, around 1.3600 by the press time. It’s worth noting that the BoC is expected to keep the monetary policy unchanged but the latest rebound in the Crude Oil price, Canada’s key export, could join the hawkish commentary from the central bank, if any, to drag the quote further toward the 200-EMA. The expectations of a pullback in prices also take clues from bearish MACD signals and sluggish RSI. That said, the quote’s weakness past the 200-EMA level of 1.3518 appears difficult as the bottom line of a five-week-old bearish channel, forming part of a broader “bull flag” formation, could challenge the bears around 1.3470.
Alternatively, a daily closing beyond the 1.3600 resistance confluence will enable the USDCAD buyers to aim for the bull flag confirmation by crossing the 1.3685 upside hurdle. Following that, the quote’s theoretical rally towards 1.4500 gains attention. However, the previous monthly high of around 1.3900 and the 1.4000 psychological magnet could test the Loonie pair buyers. It should be observed that the April 2020 high surrounding 1.4300 also acts as an upside filter should the quote remain firmer past the 1.4000 threshold.
Overall, the USDCAD is likely to decline ahead of the BoC’s verdict. However, the downside room appears limited.

USD CAD upside movement possibleUSD CAD upside movement possible
Buying above the 1.35996
Stoploss 1.34755
Target 1.38773

shorting method for usd/cadthe trend is down
its recent history suggest an formation of v pattern then consolidates for some time
and will give us its original trend direction
so here is the plan

short usd/cad for intraayoverall trend is down
it down moves after retracing to 50% levels
(this is analysis is after analysis of recent history on 15hr timeframe )
so here is the plan

USD/CAD trend 27/11USD/CAD broke out from the uptrend channel (1) early last week, officially ending the upward trend that started in early July. By the end of last week, the USD/CAD closed at 1.3624, clearing the buying from the support level of 1.3650(3). In the coming week, expecting a new round of selling with a temporary target near the 100-day MA(2) around 1.3550. This week, besides keeping an eye on the US inflation data on Thursday, it is also important to pay attention to the delayed OPEC+ meeting. If the news comes out that OPEC+ will extend or even increase production cuts, there is a chance that the USD/CAD may drop even further.
S-T Resistances:
1.3734
1.3680
1.3650
Market price: 1.3648
S-T Supports:
1.3620
1.3580
1.3550
If you like my work, please give me a thumbs up 👍.
Feel free to leave a comment; share your thoughts 🤟.
P. To

USDCAD Strong SupportWhile looking at shrot time frame tarde we must keepin it simple makes more sense. While looking at this particular timeframe I'm personally taking long in this trade
OANDA:USDCAD

USDCAD is sell sideThe USDCAD pair is currently trending towards the sell side according to my analysis. After a brief period of consolidation, the pair has broken through the semantic triangle and key support level at 1.36700, which is a significant bearish signal. Therefore, I suggest placing an entry point at 1.36600 to initiate a short position.
My target for the sell trade on the USDCAD pair is set at 1.35500. I arrived at this target price by analyzing the price action and historical levels of support and resistance on the pair's chart. Additionally, I have factored in the current fundamental factors affecting the CAD, such as the recent strong economic data and rebounding oil prices.
Overall, my analysis suggests that the USDCAD pair is poised for further weakness in the near term, making it an attractive sell opportunity with a good risk to reward ratio. However, as always, traders should exercise caution and implement appropriate risk management strategies when entering any trade.

sell usd/cadoverall trend is down
after analysing history it has some patterns as per drawn by me on chart
and also dxy index looks consolidating towards downside
so here is the plan

USDCAD sellers need validation from 1.3670 and Canada inflation USDCAD fades the week-start recovery as market players await Canada inflation data on early Tuesday. In doing so, the Loonie pair defends the previous week’s U-turn from the 100-SMA while retreating towards a two-month-old rising support line. Adding strength to the bearish bias are the downbeat MACD signals and the mostly steady RSI (14). However, the quote’s further downside needs a clear downside break of the aforementioned trend line support, close to 1.3670 by the press time, as well as upbeat prints of the Canada Consumer Price Index (CPI) and the Bank of Canada (BoC) CPI for October. That said, the pair’s sustained downside past 1.3670, backed by strong Canada inflation, could quickly drag prices to the 50% and 61.8% Fibonacci ratios of the pair’s September-November upside, respectively near 1.3640 and 1.3570.
Meanwhile, USDCAD buyers need to cross the 100-SMA level of 1.3770 and must get support from the Canada inflation to retake control. Even so, a downward-sloping resistance line from early November, close to 1.3815 at the latest, will act as an extra filter toward the north. Following that, the pair’s run-up toward the monthly high of around 1.3890 and then to the 1.4000 psychological magnet can’t be ruled out.
Overall, USDCAD is likely to remain on the bear’s radar but needs strong Canada inflation data to drop further.

USD / CAD TECHNICAL OUTLOOK1) USD /CAD moves downside to 1.3700 on weaken US Dollar.
2) The bearish outlook for USD / CAD remain below the 50, 100 AND 200 moving average ( 1 hour TF ).
3) Major support level seen at 1.3655.
Technically, the bearish outlook for USD/CAD remains intact as the pair holds below the 50- and 100-day Exponential Moving Averages (EMAs) on the four-hour chart. Additionally, the Relative Strength Index (RSI) is located in the bearish territory below 50, which means the path of the least resistance of USD/CAD is to the downside.

#USDCADDear Friends See the USDCAD Weekly Analysis, and also you can choose Martingale Strategy for select the Buy & sell orders & also Follow my Trading View Channel forget the Instant Notification of Every New Analysis.
