Go Short...Everything is mentioned in chart. Chart is only for educational purposes. Educationby gauravmishra_150
Don't miss the great buy opportunity in CADCHFTrading suggestion: . There is a possibility of temporary retracement to suggested support line (0.7315). if so, traders can set orders based on Price Action and expect to reach short-term targets. Technical analysis: . CADCHF is in a range bound and the beginning of uptrend is expected. . The price is below the 21-Day WEMA which acts as a dynamic resistance. . The RSI is at 55. Take Profits: TP1= @ 0.7425 TP2= @ 0.7475 TP3= @ 0.7630 SL= Break below S2Longby ForecastCity_EU4
Don't miss the great buy opportunity in CADCHFTrading suggestion: . There is a possibility of temporary retracement to suggested support line (0.74917). if so, traders can set orders based on Price Action and expect to reach short-term targets. Technical analysis: . CADCHF is in a range bound and the beginning of uptrend is expected. . The price is above the 21-Day WEMA which acts as a dynamic support. . The RSI is at 71. Take Profits: TP1= @ 0.76150 TP2= @ 0.77145 TP3= @ 0.78658 SL= @ 0.73500Longby ForecastCity_EU118
CADCHF likely to touch the 0.7400 supportThe pair has been moving in a falling channel pattern for half a month. The prices have completed the re - test of the upper ceiling at 0.74703 and has started to move towards the south, creating an opportunity to short the pair. The expected target for it to reach is, initially at the centre of the channel at 0.73998 (centre line shown by the dotted line). If the prices sustain below this level as well, we might be headed for the next support of 0.73500. The stop loss for the trade will be at 0.7500. Shortby forexnoobmaster0072
CAD/CHF Technical analysisCAD/CHF has bounced sharply to the highs of 0.75969. It consolidated in the highs with a flat correction. The MACD indicator moved into the sell zone owing to correction but has now reversed to the buy zone. We expect the pair to higher and trade with positive bias from here, however, the counter might find support at the trendlines which we indicated in the chart and then can bounce too. So, traders can trade according to their plan and the pair is exhibiting strong bullish momentum for the day. Longby traderpulse0
CAD/CHF Technical analysisA triangle formation has formed in the counter, in the short term. The price has bounced from the trendline sharply and is consolidating. Hence, we expect the pair to reach the resistive trendline. Shortby traderpulse0
buy cad/chf buy cad/chf. for stoploss and take profit look at the scale axis on the chart in red and green.Longby anup233120
SELL CADCHF FOR WEEKLEY INCOME TRADER.- ALERT SIGNAL FOR POSITIONAL TRADE ALERT SIGNAL DATE -14/10/2018 SELL ENTRY 1 - .76501 SELL ENTRY 2 - .76841 STOPLOSS- .77190 TARGET 1 - .76181 TARGET 2 - .75849 Hit like, comment and follow for more profitable Trades. Happy trading. THANK YOU HOW WEEKLEY WIT SIGNAL IS VALID FOR DAILY INCOME TRADER(DIT) 1,IT IS VALID UPTO 24 HOURS,ONCE IT HITS THE ENTRY 2,ONCE PAIR CROSSED 10 PIPS,MOVE YOUR TRAILING STOPLOSS TO 2 BREAKEVEN OR ENTRY 3, WAIT FOR TARGET OR EXIT AT YOUR OWN COMFORT MONEY MANAGEMENT RULES Let’s say, If you have 1000 USD trading balance, you can use Maximum 0.10 lot (0.02+0.03+0.05 = 0.10 lot is the addition of all your open trade lot sizes). 0.10 lot should be your maximum open lot on your 1000$ trading account. 10,000 USD balance = 1 lot maximum (Example : 0.25 lot x 4 orders = 1 lot) 50,000 USD balance = 5 lot maximum (Example : 1 lot x 5 orders = 5 lot) If you are more emotional(tension, sad, greedy) while trading, You can change your leverage below 1:50 to control your emotions. *SUBJECTED TO MARKET RISK Understanding the importance of each or these trading rules, and how they work together, can help traders establish a viable trading business. Trading is hard work, and traders who have the discipline and patience to follow these rules can increase their odds of success in a very competitive arena. Personally, I like to use a system that has the highest reward to risk, which means that I tend to look for turning points at support and resistance levels because these are the points where it is easiest to identify and quantify the risk. Support is not always strong enough to stop a falling market, nor is resistance always strong enough to turn back an advance in prices. However, a system can be built around the concept of support and resistance to give a trader the edge required to be profitable. THANK YOU TEAM FXSIGNAL] Shortby E_R_S0
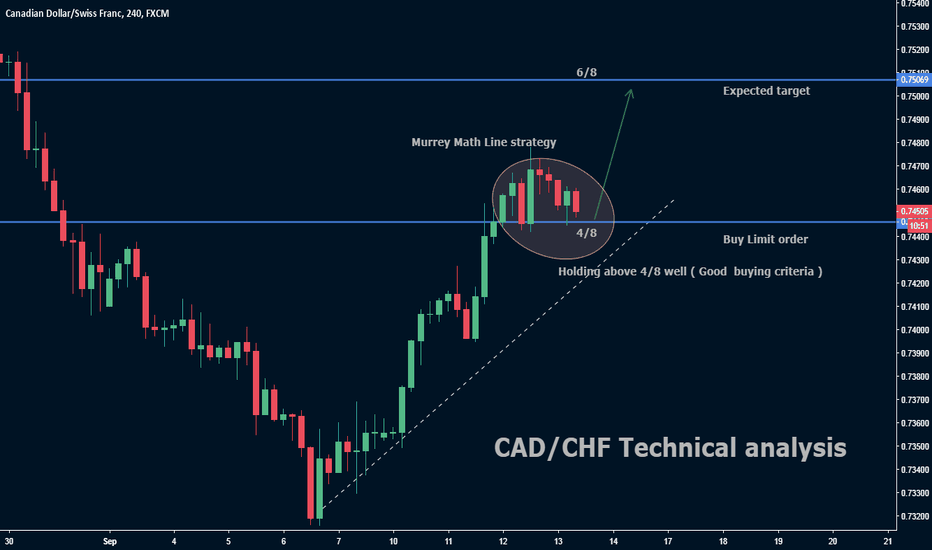
CAD/CHF Technical anaysisThe CAD/CHF pair is currently trading above the 4/8 Murray math line. It is also in a strong uptrend and is currently consolidating. We expect the momentum to continue and move towards 0.75069. Longby traderpulse0
CADCHF Formed 4H chart Bullish Wolfe Wave Chart PatternCADCHF Formed 4H chart Bullish Wolfe Wave Chart Pattern Technical Analysis: We are expecting that 0.73345 is it took the support of trend line. If hold that support then can lead 0.74500, so down side is limited and its opportunity for buy on dips What looked like an almost free fall from 0.73982 to 0.73355 today for CADCHF is currently halted. The price re-tested 23 Feb 2018 lows and bounced back being supported by really high stopping volume at point 5 of the grand Wolfe-wave. Longby sagar.potekar.70
Good trade of short in CADCHFIt is respecting the falling trendline with good risk reward trade for short term, potentially it is forming an Inverse H&S, this fall would potentially will make the head before heading to create right shoulder. Shortby rf16saun3